Institutional Presentation - June 2021

Page created by Bryan Owen
 
CONTINUE READING
Institutional Presentation - June 2021
Institutional Presentation
June 2021
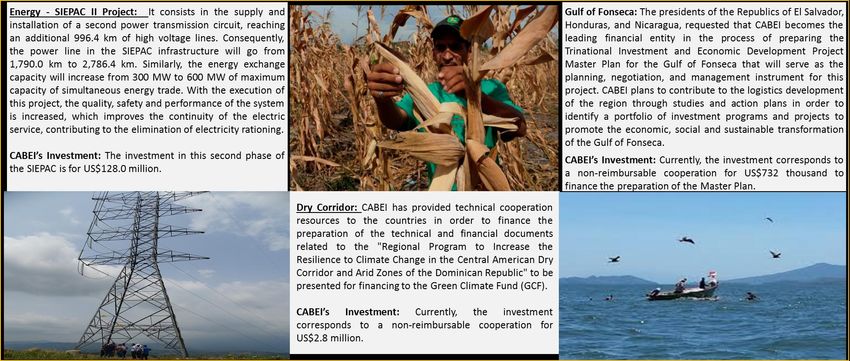
Institutional Presentation - June 2021
Table of contents

              1. Macroeconomic Overview

              2. CABEI’s Role and Policy Importance

              3. Results of the Amendments to CABEI’s Constitutive Agreement

              4. CABEI´s Credit Ratings

              5. Equity and Profitability

              6. ALM Policy

              7. Credit Risk Management

              8. Comparison with other MDBs

                                                                               2
Institutional Presentation - June 2021
The Central American region: CABEI’s core business

       Key Economic Facts:
                                                                                      Guatemala

       •   Area: 572,563 km 2                                                         El Salvador
       •   Population: 60.7 million
       •   Population density: 106.1 people per km2                                    Costa Rica
       •   Population Growth (2017-2019): 1.41%
       •   Regional GDP: US$366.2 billion                                               Honduras
       •   GDP per Capita: US$6,023
                                                                                        Nicaragua

                                                                                           Belize
✓    The Central American region consists of eight countries: Guatemala, El
     Salvador, Honduras, Nicaragua, Costa Rica, Belize, Panama and Dominican
     Republic.                                                                           Panama

✓    Central America is the sixth largest economy in LATAM.
                                                                               Dominican Republic

Source:
http://www.secmca.org/simafir.html                                                                  3
http://www.imf.org/external/pubs/ft/weo/2019/01/weodata/index.aspx
Institutional Presentation - June 2021
Central American Region: Economic growth outlook
                                   Economic growth                                                                                 Inflation
                                     (percentage)                                                                                (percentage)

                                            Central
                                                           Latin America                                             Central        Latin America
                                            America
                                                                                                                     America
Source: International Monetary Fund, WEO April 2021                        Source: International Monetary Fund, WEO April 2021
*2021 estimates                                                            *2021 estimates
                                         Major Economic Activities

                                                                                  ➢ Year 2020 indicates that Latin America fell by 7.0% while Central America by
                                                                                    7.2%.

                                                                                  ➢ The projection for 2021 indicates a better recovery for Central America with 4.8% vs.
                                                                                    4.6% for Latin America.

                                                                                 ➢ Average inflation in 2020 for Central America was 1.8% and the 2021 projection is
                                                                                   2.8%, below the average for Latin America which was 6.4% and 7.2%,respectively.

                                                                                                                                                                            4
Institutional Presentation - June 2021
Central American Region: Economic Outlook
                                                   Fiscal Deficit
                                                 (PIB percentage)

                                                                    ➢ During the 2000-2008,the average deficit in Central
                                                                      America was 2.2% while LATAM stood at -1.8%

                                                                    ➢ During 2009-2019 the average deficit of Central
                                                                      America was 2.9% on the other hand Latam had an
                                                                      average of -4.3%.

                                                                    ➢ During 2020 Central America´s average deficit
                                                                      estimates of -7.8%, well under Latam´s average of
                                                                      -10.8%.

                                                     Debt
                                               (PIB percentage)

                                                                    ➢ Between 2000-2020, the average debt for Central
                                                                      America was 54.4% of its GDP, lower than the Latin
                                                                      American average at 61.1% of its GDP.

                                                                    ➢ In 2020, Central America's average debt increased to
                                                                      67.9% of its GDP due to the negative impact of the
                                                                      health crisis and extraordinary fiscal measures
                                                                      implemented while LATAM stood at 79.3%.

                                                                    ➢ In 2021, the average debt of Central America is
                                                                      projected to reach 70.3% of its GDP, lower than the Latin
                                                                      American average which stood at 79% for the same
                                                                      period.

Note: Data correspond to General Government.                                                                                      5
Source: International Monetary Fund, WEO April 2021.
Institutional Presentation - June 2021
The Central American region and Dominican Republic: a resilient
  integration scheme
          Latin America and the Caribbean: Interannual                                               Latin American and The Caribbean: Coefficient of intra-group
          variation rate of intra-group export in various                                                 trade measured by exports in the various integration
               integration schemes, Jan-May 2020.                                                                 schemes, Jan-May 2019 and 2020

                                   (In percentages)                                                                                       (In percentages)

Source: CEPAL, based on information from central banks, customs services, and statistical institutes of the region.
The information corresponding to the Caribbean community is sourced from the Direction of Trades Statistics (DOTS) database o f the International Monetary Fund.

                                                                                                                                                                    6
Institutional Presentation - June 2021
International remittances levels in the region have returned to normal

            Evolution of remittances from the period 2015-2020            Behavior of remittances in the region during the COVID-19 (Jan. 2020-feb 2021)
                                      (In USD million)                                                               (In USD million)

Source: Secretariat of the Central American Monetary Council            Source: Secretariat of the Central American Monetary Council

 ➢ The region has shown a steady and healthy growth in international remittances over the course of the past 5 years, with a total
   increase of US$ 21.5 billion from year 2015 to US$ 34 billion in year 2020.

 ➢ The decrease in remittances showed resilience to the impact of COVID-19, ending 2020 with an average growth of 9% and
   starting 2021 with an average growth of 17%.
                                                                                                                                                           7
Institutional Presentation - June 2021
COVID-19’s impact in the Central American region

                                                                          Confirmed    Confirmed   % of the population
                                                            Country
                                                                            cases       deaths     partially vaccinated

                                                             Panama        382,475       6,402            16.5%
                                                            Dominican
                                                                           301,078       3,654            34.9%
                                                             Republic
                                                            Costa Rica     327,979       4,153            19.9%

                                                            Guatemala      261,958       8,294            2.7%

                                                            Honduras       241,826       6,479            3.7%

                                                            El Salvador     74,141       2,274            18.1%

                                                            Nicaragua       7,481         187             2.5%

                                                              Total        1,596,938     31,443

Sources:
https://www.unah.edu.hn/coronavirus/mapa-mundial-covid-19
https://ourworldindata.org/covid-vaccinations
Data as of June 7th 1st , 2021

                                                                                                                      8
Institutional Presentation - June 2021
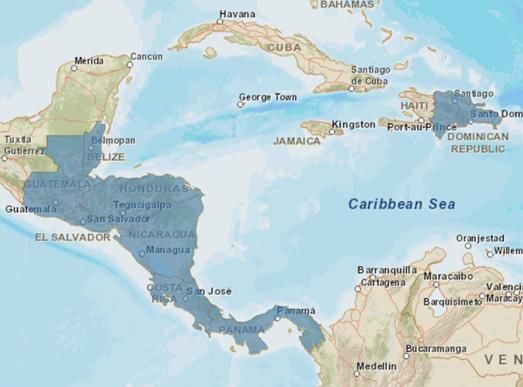
CABEI’s COVID-19 Emergency Program promptly created
   According to the declaration of the SICA countries in the face of the COVID-19 pandemic, an Emergency Program was approved to provide
   financial resources to the countries of the region to finance operations for the prevention, detection and treatment of COVID-19 and mitigation
   of its economic impact in these countries. The Program will be financed with regular CABEI resources of up to US$3,060,125,000

                                                                       Amount                       Financial Instruments and Institutional
                     Components
                                                                         in US$                                     Sector

1. Emergency AID                                                       8,000,000                             Grant to the Public Sector

2. Aid for the regional purchase and supply of
medicines and medical equipment for early detection                    2,100,000                             Grant to the Public Sector
of COVID-19.

3. Credit to finance Public Sector Operations.                        350,000,000                 Sovereign and non-sovereign Public Sector Loan

4. Credit Program to Support the Liquidity
                                                                     1,000,000,000                            Central Bank Credit Line
Management of Central Banks.
                                                                                                     Loans, trade finance and guarantees to the
5. Financial Sector Support Facility.                                 650,000,000
                                                                                                                   financial sector.
6. Support for the Trifinio Project.                                     25,000                             Grant to the Trifinio Project
7. Support for the adquisition of Vaccines to immunize
                                                                      800,000,000                       Loans to the sovereign public sector.
the population against COVID-19.
8. Employment and youth entrepreneurship.                             250,000,000                       Loans to the sovereign public sector.
             Total amount of the program                             3,060,125,000                                                                   9
Institutional Presentation - June 2021
CABEI also approved US$2,513.0 million for the Central American
Program for Resilient Reconstruction

                                               CABEI Resources       External Resources            Total Amount             Financial instrument and
              Components
                                                    (US$)                  (US$)                       (US$)                          sector

1. Emergency aid                                   3,000,000                  TBD                    3,000,000           Non-Refundable

2.Technical     assistance   funds     and
                                                   5,000,000               5,000,000                 10,000,000          Non-Refundable
preparation of FCC investments projects.

3. Public investment Program                      600,000,000            600,000,000               1,200,000,000         Public Sector Loan
                                                                                                                         Public and Private sector loans,
4. Private investment program                     400,000,000            400,000,000                800,000,000          Private and public partnership
                                                                                                                         loans
                                                                                                                         Regional and Global Bond
5. Theme bonds: Green and ESG.                    500,000,000                 N/A                   500,000,000
                                                                                                                         Issuances
6.   Knowledge  development     and
                                                                                                                         Support from CABEI`s Members
management on adaptation to climate                   N/A                     N/A                        N/A
                                                                                                                         and international institutions.
change.
      Total amount of the program                1,508,000,000          1,005,000,000              2,513,000,000

         In response to the damage caused by hurricanes ETA and IOTA in the region, CABEI supported its member countries with the approval
         of the Central American Program for Resilient Reconstruction for an amount of up to US$2,513 million with the objective of
         encouraging SICA countries to confront and combat to climate change.                                                                               10
Central America: Trade Integration Agreements and Regional Initiatives

  Following substantial work towards regional trade integration over the last half century, Central America has emphasized multilateral initiatives that underpin integration:

                  Initiatives                          Year approved                                                              Benefits

                                                                                Improved hemispheric integration.
 Free trade agreement between Chile and          Formally signed October
                                                                                Improved rules for the investments promotion.
 Central America                                 1999
                                                                                Create an expanded and secure market for the goods produced.

 Free trade agreement between Panama             Formally signed March          Improved commercial relationship in the region.
 and Central America                             2002                           Increased the economic and social development.

 Central America* – USA Free Trade                                              Improved commercial relationship in the region.
 Agreement                                       Formally signed May 2004       Increased the market access.
 (DR-CAFTA)                                                                     Encouraged a complementary agenda for Central America Region.

                                                                                Improved the competitiveness between Central America and Mexico.
 Free trade agreement between Mexico             Formally signed
                                                                                Increased the economic and social development.
 and Central America                             November 2011
                                                                                Removed commercial barriers and facilitated the trade between Central America and Mexico.

 The European Union - Central America                                           Improved commercial and cooperative relationship between regions.
                                                 Formally signed June 2012
 Association Agreement (EU-CAAA)                                                Increased social development in the Central America Region.

                                                                                On June 18, 2015, Central American countries and the Republic of Korea launched negotiations towards a free
 Free trade agreement between the                Formally signed February       trade agreement, which concluded on November 16, 2016 in Managua, Nicaragua. On February 21, 2018, the FTA
 Republic of Korea and Central America**         2018                           was signed in Seoul, Korea with Costa Rica, El Salvador, Honduras, Nicaragua, and Panama. The agreement took
                                                                                effect on October 1, 2019.

                                                                                On July 2019, a free trade agreement was signed between the United Kingdom and the Central American Region,
 Free trade Agreement between the United                                        with the aim of ensuring trade relations, considering the United Kingdom’s withdrawal (BREXIT) from the EU.
                                                 Formally signed July 2019​     This incorporates changes that differentiate the existing agreement between the EU and Central America.
 Kingdom and Central America**​

*Includes Guatemala, El Salvador, Honduras, Nicaragua, Costa Rica and, The Dominican Republic.
** Includes Guatemala, El Salvador, Honduras, Nicaragua, Costa Rica and Panama.
                                                                                                                                                                                               11
Table of contents

              1. Macroeconomic Overview

              2. CABEI’s Role and Policy Importance

              3. Results of the Amendments to CABEI’s Constitutive Agreement

              4. CABEI´s Credit Ratings

              5. Equity and Profitability

              6. ALM Policy

              7. Credit Risk Management

              8. Comparison with other MDBs

                                                                               12
About CABEI

                                                             CABEI's Mission*

      “The Bank’s objective shall be to promote the economic integration and the balanced economic and
      social development of the Central American region, which includes the founding countries and the
      non-founding regional countries, and in harmony with the objectives of its non-regional members.”

           * Effective as of January 29, 2020 (Resolution DI-04/2020).

                                                                                                          13
Extraordinary shareholder support through highly rated non-regional
members
➢   Supranational development bank focused on Central
    America, founded in 1960                                                               Cuba        Dominican
                                                                                  Belize                Republic
➢   Headquartered in Tegucigalpa, Honduras                                           Honduras
                                                              Guatemala
➢   Founding Members:                                                                      Nicaragua
                                                                    El Salvador
      ➢ El Salvador                                                                                    Panama
      ➢ Guatemala                                                            Costa Rica
      ➢ Honduras
      ➢ Nicaragua
      ➢ Costa Rica

➢   Non-Founding Regional Members:
      ➢ Dominican Republic (2007)
      ➢ Panama (2007)
      ➢ Belize (2006)

➢   Non-Regional Members :                                                                                         Republic of Korea
      ➢ ROC Taiwan (1992)
      ➢ Mexico (1992)                             Founding Members
      ➢ Argentina (1995)                          Non-Founding Regional Members
      ➢ Colombia (1997)                           Non-Regional Members
      ➢ Spain (2005)
      ➢ Cuba (2018)                                                                                                                    14
      ➢ Republic of Korea (2019)
CABEI as part of the Central American Integration System
(SICA by its acronym in Spanish)
CABEI - SICA

SICA’s purpose is to achieve the integration of Central America
for it to become a Region of Peace, Freedom, Democracy and
Development.

CABEI is SICA’s financial arm.

                                                                  Order of Malta
                                                                  Republic of Serbia
                                                                                       15
Organizational Structure

                                                                                                                        Board of Directors Conformation
                                                                                     Board of
                                                                                    Governors

 CABEI has 413 employees based at its headquarters in
 Tegucigalpa and in its 7 regional offices (1 regional office for each
 Founding Member Country, 1 office in Panama, and 1 recently
 opened regional office in the Dominican Republic).                                 Board of
                                                                                    Directors
 Currently, CABEI has plans to expand its global presence through
 the opening of offices in the Republic of China (Taiwan), the
 Republic of Korea, Spain, and Argentina.

                                                                                    Executive
                                                                                    President
                                                                               Executive Vice-
                                                                                 President

                                                                                               General
                                           Private                                                             Risk
          Public Sector                                                  Finance            Services and                           Credit
                                           Sector                                                          Management
            Division                                                     Division            Technology                           Division
                                           Division                                            Division      Division

                                                                                                                                                          16
CABEI is the dominant MDB in the Central American Region
       CABEI, IADB and World Bank participation (%) of total
   disbursements to the Region¹ in the last 15 years (2004-2018)

                                                                                               1 Includes Guatemala, El Salvador, Honduras,
                                                                                               Nicaragua and Costa Rica
                                                                                               * Includes BID Invest.
                                                                                               ** Includes IFC & IDA. IBRD data until Nov-18.
                                                                                               It does not include Funds in Administration.
                                                                                               Source: www.iadb.org, www.worldbank.org CABEI.

                      Total Disbursements in the region 2004-2018:
                                    US$43.7 billion

     ✓ Throughout the years CABEI has consolidated its role as the Multilateral Development Bank with the most relevant
       presence in the Central American region with a participation close to 50% in the disbursements of the region in the
       last 15 years (2004- 2018).

     ✓ This consolidation has been mainly derived from the Preferred Creditor Treatment conferred to CABEI by its member
       countries.
                                                                                                                                                17
Rising importance of CABEI in the Region

               CABEI`s total disbursements (2000-2020)

                                                         ✓ Since its creation, CABEI has disbursed over
                                                           US$31.2 billion to the Central American region.

                                                         ✓ In times of economic crisis, CABEI has
                                                           continued to fulfill its mandate; thus
                                                           strengthening the preferential creditor status.

                                                         ✓ CABEI has a track record of six (6) decades of
                                                           fulfilling its public policy mandate throughout
                                                           credit cycles, and will continue to do so in the
                                                           future.

                                                                                                              18
Table of contents

              1. Macroeconomic Overview

              2. CABEI’s Role and Policy Importance

              3. Results of the Amendments to CABEI’s Constitutive Agreement

              4. CABEI´s Credit Ratings

              5. Equity and Profitability

              6. ALM Policy

              7. Credit Risk Management

              8. Comparison with other MDBs

                                                                               19
2016: Amendments to CABEI’s Constitutive Agreement

                                                                                AA-

           April 2014               February 2015            June 2016

   CABEI’s Board of Governors     CABEI’s Board of      The amendments to
   required the formulation of    Governors approved    the      Constitutive
   an action plan to modify the   the        proposed   Agreement became
     Institution’s Constitutive   amendments to its     effective.
            Agreement.            Constitutive
                                  Agreement.
                                                                                      20
Results of Amendments to CABEI’s Constitutive Agreement: capital
increase, loan diversification and incorporation of new members

                                                                 On December 31, 2019,                            On     July,   2020,      the
                                                                 the Republic of Korea´s                          implementation process of
                                                                 Adhesion Protocol to                             the 8th GCI was completed,
CABEI’s Board of Governors                                       CABEI´s     Constitutive                         within the framework of
approved the increased                                           Agreement and shares                             which the founding, non-
participation     of     the                                     Subscription
                                    Belize     Cuba became a                                                      founding regional and extra-
Republic of Panama and                                           Agreement       entered
                                acquires the    non-regional     into full force and                              regional           members
the Dominican Republic for
US$197.4 million each,            status of       member,        effect. As of That date,   CABEI’s authorized    formalized the subscription
                               non-founding      through a       the Republic of Korea´s    capital   increased   of 195,330 shares (all of the
within       the      Bank’s
                                  regional     US$50.0 million   US$450 million capital                           available shares) equivalent
shareholder structure, for a                                                                from US$5.0 billion
                                member of          capital       subscription    became                           to a subscribed capital of
total subscription of shares                                                                to US$7.0 billion.
                                   CABEI.       subscription.
of US$256.0 million each.                                        effective.                                       US$1,953.3 million.

         Feb 2016              Nov 2016           July 2018             Dec 2019                April 2020                 July 2020

                                                                                                                                                  21
CABEI’s Capital Structure: almost 20% attributed to highly-rated Asian
   countries
                                                                                                                    Capital Structure as of may 2021

                                                                                              Subscribed                                                  No. of             No. of                                    Series A Shares                Share
                                                          Subscribed Capital                                             Subscribed Paid-In                                                     Total No. of
             Founding Members                                                               Callable Capital                                             Series A           Series C                                   % of Authorized             Participation
                                                               (US$)                                                      Capital (US$) (*)                                                    Shares (A+C)
                                                                                                 (US$)                                                   Shares              Shares                                        Capital                  (A+C) (%)
                                                                                                                                                                                                                                                                 (**)
                                                                                                                                                                                                                                                                          ✓ Under CABEI’s 8th General Capital Increase (GCI),
                Guatemala                                           714,000,000                    535,500,000                     178,500,000               71,400              21,147                    92,547                   10.20%                   10.73%         the second one in less than a decade, shareholder
                El Salvador                                         714,000,000                    535,500,000                     178,500,000               71,400              21,147                    92,547                   10.20%                   10.73%
                 Honduras                                           714,000,000                    535,500,000                     178,500,000               71,400              21,147                    92,547                   10.20%                   10.73%
                                                                                                                                                                                                                                                                            participation of founding member countries falls
                 Nicaragua                                          714,000,000                    535,500,000                     178,500,000               71,400              21,147                    92,547                   10.20%                   10.73%         from 64.4% in 2015, to 54.0% in 2020.
                Costa Rica                                          714,000,000                    535,500,000                     178,500,000               71,400              21,147                    92,547                   10.20%                   10.73%
         Total Founding Members                                   3,570,000,000                  2,677,500,000                     892,500,000               357,000            105,735                   462,735                   51.00%                   53.66%       ✓ The amendments to the Constitutive Agreement
                                                                                              Subscribed                                                  No. of             No. of                                    Series B Shares                Share                 and the incorporation of new members, further
                                                          Subscribed Capital                                             Subscribed Paid-In                                                     Total No. of
   Non-Founding Regional Members                                                            Callable Capital                                             Series B           Series C                                   % of Authorized             Participation            strengthen CABEI’s "business profile“, as they
                                                               (US$)                                                      Capital (US$) (*)                                                    Shares (B+C)                                                      (**)
                                                                                                 (US$)                                                   Shares              Shares                                        Capital                  (B+C) (%)
                                                                                                                                                                                                                                                                            solidify its relationship with all of its members
              Dominican Republic                                    378,400,000                     283,800,000                     94,600,000                37,840              5,180                   43,020                     5.41%                    4.99%         and diversify its shareholder structure.
                  Panama                                            358,400,000                     268,800,000                     89,600,000                35,840              5,655                   41,495                     5.12%                    4.81%
                    Belize                                           25,000,000                      18,750,000                      6,250,000                 2,500                394                    2,894                     0.36%                    0.34%
                  Sub-total                                         761,800,000                     571,350,000                    190,450,000                76,180             11,229                   87,409                    10.88%                   10.14%
                                                                                                                                                                                                                                                                          ✓ Considering current subscriptions, CABEI’s 8th GCI
                                                                                                                                                                                                                                                      Share
                                                                                                                                                                                                                                                                            will generate at least US$488.3 million in new
                                                                                              Subscribed                                                  No. of             No. of                                    Series B Shares
          Non-Regional Members
                                                          Subscribed Capital
                                                                                            Callable Capital
                                                                                                                         Subscribed Paid-In
                                                                                                                                                         Series B           Series C
                                                                                                                                                                                                Total No. of
                                                                                                                                                                                                                       % of Authorized             Participation            paid-in capital installments.
                                                               (US$)                                                      Capital (US$) (*)                                                    Shares (B+C)
                                                                                                 (US$)                                                   Shares              Shares                                        Capital                  (B+C) (%)(**)
                                                                                                                                                                                                                                                                          ✓ US$163.5 million is currently available for
             ROC (Taiwan)                                           776,250,000                    582,187,500                    194,062,500                77,625             20,864                    98,489                    11.09%                   11.42%
           Republic of Korea                                        630,000,000                    472,500,000                    157,500,000                63,000              2,769                    65,769                     9.00%                    7.63%         additional subscriptions by current non-founding
                Mexico                                              306,250,000                    229,687,500                     76,562,500                30,625             12,486                    43,111                     4.38%                    5.00%         members, as well as new members.
              Argentina                                             305,800,000                    229,350,000                     76,450,000                30,580              6,085                    36,665                     4.37%                    4.25%
                Spain                                               280,000,000                    210,000,000                     70,000,000                28,000              8,293                    36,293                     4.00%                    4.21%       ✓ Capital subscribed by members rated at or above
              Colombia                                              203,000,000                    152,250,000                     50,750,000                20,300              5,987                    26,287                     2.90%                    3.05%
                Cuba                                                 50,000,000                     37,500,000                     12,500,000                 5,000                555                     5,555                     0.71%                    0.64%         a “AA-” rating reached 19.2% (Taiwan and the
              Sub-total                                           2,551,300,000                  1,913,475,000                    637,825,000               255,130             57,039                   312,169                    36.45%                   36.20%         Republic of Korea) from 17.9%.
Sub-total Non-Founding Members                                    3,313,100,000                  2,484,825,000                    828,275,000                331,310             68,268                   399,578                   47.33%                   46.34%
      Total Subscribed Capital                                    6,883,100,000                  5,162,325,000                  1,720,775,000                688,310            174,003                   862,313                   98.33%                  100.00%
          Unsubscribed Shares                                       116,900,000                                                                               11,690                                                                 1.67%
       Total Authorized Capital                                   7,000,000,000                                                                              700,000                                                                  100%
(*) Subscribed Paid-in Capital Includes Unpaid Capital.
(**) The right to vote for the capital subscription from the corresponding capital increase will take effect once the first capital payment of the founding member countries has been received to guarantee the 51% proportion, and provided that the period granted to
non-founding regional members and extra-regional members to make the first capital payment has elapsed.

                                                                                                                                                                                                                                                                                                                            22
New Paid-in Capital 2020-2024 to strengthen CABEI’s solvency

                                                               23
The impact of CABEI´s investments
                                    Impact on Development Assessment System (SEID for its acronym in Spanish) aims to assess
                                    the impact on development for operations financed by CABEI. The Evaluation Cycle brings
                                    together the necessary steps to complete the evaluation process from ex ante, half term to ex
                                    post within the CABEI Project Cycle.
   IMPACT ON DEVELOPMENT

                           HIGH
                           (≥70%)

                           SATISFACTOR
                           Y (≥40%)

                           LOW
                           (>40%)

                                                                                                                                    24
Evolution of Credit Approvals and Disbursements

                                                  25
Credit Operations by Country & Focus Area

 Approvals by Member
        Type
  Founding      86%
    Non-
                14%
  Founding

   Disbursements by
     Member Type
  Founding      69%
    Non-
                31%
  Founding

                                            26
Loan Portfolio: Approvals during 2020

CABEI approves US$ 2.5 billion for the Central American                                                                         CABEI approves US$399.2 million for mega-project that will
Program for resilient reconstruction.                                                                                           supply potable water to the Great Metropolitan Area of
                                                                                                                                Costa Rica.
November 2020, Central America was massively struck by two
devastating hurricanes, ETA and IOTA, which brought along                                                                       CABEI approved the Costa Rican Institute of Aqueducts and
enormous damage in terms of infrastructure, crop losses and                                                                     Sewerage of the Republic of Costa Rica to finance the Supply
damage to the housing infrastructure of the region, as a result                                                                 Project for the Fifth Stage Metropolitan Aqueduct.
on November 16th 2020 ,the bank announced the approval of                                                                       The project consists of the construction of 44.3 kilometers of
the Central American Program for Resilient Reconstruction in                                                                    pipelines, of which 8.6 km are tunnels, a new water
response to natural disaster emergencies for an amount of                                                                       treatment plant and six storage tanks with a total capacity of
US$2.5 billion. These resources will be oriented to finance                                                                     50,000 cubic meters, infrastructure that will allow the
projects that address and prevent natural disasters for the sake                                                                capture, treatment and distribution of 2.5 m3/s (cubic
of adapting to climate change, to restore livelihoods and create                                                                meters per second) of drinking water in the Great
socioeconomic opportunities in affected communities.               CABEI approved the Emergency Support and Preparedness        Metropolitan Area and surrounding areas.
                                                                   Program for COVID-19 and economic reactivation               The direct beneficiaries are estimated at 638,000 people.
                                                                   of US$3.06 billion.
                                                                   The Program responds to the efforts for the prevention and
                                                                   containment of the health emergency faced by the member
                                                                   countries of the Bank.
                                                                   The program includes:
                                                                   • Emergency aid and non-reimbursable funds.
                                                                   • Support to purchase of medical supplies.
                                                                   • Finance sector public operations.
                                                                   • Liquidity management of central banks.
                                                                   • Support the financial sector to support SMEs
                                                                   • Credit facility for the acquisition and application of
                                                                       vaccines.

                                                                                                                                                                                                 27
Regional Integration Projects

                                28
Table of contents

              1. Macroeconomic Overview

              2. CABEI’s Role and Policy Importance

              3. Results of the Amendments to CABEI’s Constitutive Agreement

              4. CABEI´s Credit Ratings

              5. Equity and Profitability

              6. ALM Policy

              7. Credit Risk Management

              8. Comparison with other MDBs

                                                                               29
S&P upgrades CABEI from A+ to AA

✓ On Friday, march 08, 2019, Standard & Poor's (S&P) upgraded the long-term international credit rating of the Central American Bank for
  Economic Integration (CABEI) by two notches from A + to AA; with a stable outlook.

✓ S&P stated that its assessment of the Bank’s policy importance is supported by key developments following the amendments to CABEI's
  Constitutive Agreement which became effective in 2016, with the objective of improving the Institution’s governance, increasing its membership
  base and enabling additional financing through the diversification of its loan portfolio and additional capital injections.

✓ According to the official statement issued by the rating agency, the aforementioned upgrade results from the solid preferred creditor treatment
  that member countries grant the Institution which supports the Bank's capital position and the fact that CABEI has managed to extend its
  mandate and increase its membership base through the recent incorporation of the Republic of Korea.

✓ S&P highlighted the fact that during the last 10 years, a period they define as an economic cycle, borrowing members have not entered into
  arrears in their debt service to the Bank; a situation the rating agency considers sustainable towards the future, despite the economic pressures
  that some countries face.

✓ The upgrade consolidates CABEI as the best rated issuer in all Latin America, placing it at a level deemed as “high” investment grade, under
  which, obligations are considered as high quality, baring very low credit risk.

                                                                                                                                                      30
S&P upgrades CABEI from A+ to AA

                                   Results from the solid preferred creditor treatment that member countries grant the
                                   Institution which supports the Bank's capital position and the fact that CABEI has
                                   managed to extend its mandate and increase its membership base through the recent
                                   incorporation of the Republic of Korea.

                                   S&P highlighted the fact that CABEI's policy importance is supported by key
                                   developments following the 2016 amendments to it's Constitutive Agreement, which
                                   improved the bank's governance structure, increased its membership base, and unlocked
                                   additional financing through diversification and capital injections.

                                   S&P factored extraordinary support in the form of callable capital into the rating from
                                   CABEI's highly rated shareholder, which provides an uplift to our RAC ratio.

                                   Currently, eligible callable capital comes from the Republic of China, Taiwan, rated 'AA-
                                   ', for $375 million. With the Republic Korea making its capital installment payments,
                                   additional callable capital is eligible for coming years.

                                                                                                                               31
Credit Ratings
              Credit Ratings to Date
                                                                            Key Factors Supporting High Investment Grade Rating
                    Rating
                                                  Last
   Agency    Long            Short   Outlook                             Proven preferred creditor        Diversification of funding
                                               reviewed
             term            Term                                        treatment (PCT)                  resources
    S&P      AA              A-1+    Stable     Sep-20                   Solid capital adequacy           High quality loan portfolio
  Moody’s*   Aa3             P-1     Stable     Jul-20
                                                                         Robust liquidity position        Extraordinary shareholder
    JCR      AA              N/A     Stable    Mar-21
                                                                                                          support

                                                          CABEI’s Rating History

                                                          18 upgrades in 18 years

                                                                                                                                        32
CABEI is the highest-rated issuer in all of Latin America

                                                               S&P                                                                        Moody´s
     Country/Bank         Non-investment                            Investment Grade                                                Investment Grade
                               grade       BBB-   BBB   BBB+   A-       A     A+   AA-   AA   AA+   AAA   Baa3   Baa2   Baa1   A3    A2      A1     Aa3   Aa2   Aa1   Aaa
1          CABEI
2           Chile
3            CAF
4       FONPLATA
5           Peru
6         Panama
7        Uruguay
8        Colombia
9         Mexico
10       Paraguay
11      Guatemala
12         Brazil
13         Bolivia
14   Dominican Republic
15      Honduras
16      Costa Rica
17       Argentina
18      El Salvador
19         Belize
20        Ecuador
21      Nicaragua
22      Venezuela
23          Cuba
24          Haiti

                                                                                                                                                                            33
Table of contents

              1. Macroeconomic Overview

              2. CABEI’s Role and Policy Importance

              3. Results of the Amendments to CABEI’s Constitutive Agreement

              4. CABEI´s Credit Ratings

              5. Equity and Profitability

              6. ALM Policy

              7. Credit Risk Management

              8. Comparison with other MDBs

                                                                               34
Balance Sheet: US$ 13.3 billion, with an average growth rate of 8.6%
(2015 – 2020)
                          Balance Sheet as of December 31, 2020
                                      (US$ million)

                      Assets                          Liabilities and Equity

                 Total US$13,295                       Total US$13,295         35
Balance Sheet

                               5.8%                  6.3%                 4.7%
                       14.5%                 17.6%                 7.1%
                                      6.7%                  7.7%
                7.0%

                                                                                 36
Loan Portfolio: improving diversification beyond founding members

                                                          As of December 31, 2020
              Loan Portfolio
                                                 Loan Portfolio by Country US$8,204 Million

                                      12.1%
                               6.5%
                     2.9%

                                                                                              37
Loan portfolio is mainly in the public sector, which grants CABEI
Preferred Creditor Status
                                                                     As of December 31, 2020
                                                              Total Loan Portfolio US$8,204 Million
                            Loan Portfolio by Institutional Sector                                             Loan Portfolio by Focus Area
                                        (US$ million)                                                                       (%)

 ✓ The Bank’s loan portfolio is mainly in the public sector; which grants CABEI a Preferred Creditor Status.
 ✓ Within the private sector, the portfolio has a greater proportion corresponding to the financial sector (with 71% ), in line with the trend
   observed over the past 5 years.
                                                                                                                                                 38
Consistent and above-peer average profitability

                                                        CABEI, in line with the
                                                        principle of institutional
                                                  ROE   self-sustainability,
                                                        maintains consistent levels
                                                        of profitability. All net
                                                        income is capitalized to the
                                                        general reserve.

                                                                                  39
Very strong capital adequacy
             Capital Adequacy Ratios                    RAC Evolution

✓ The capital adequacy ratio is the main pillar to
  assure CABEI’s financial soundness.                     ✓ The      aggregate     impact    of
                                                            diversification, the implementation
✓ The Bank has a          strict   capital   adequacy       of an 8th GCI, a PCT enhancement,
  requirement (35%).                                        the     incorporation     of   new
                                                            members, and the consolidation of
✓ CABEI, in compliance with its ALM Policy, also            FETS, will allow CABEI to maintain
  monitors the Capital Adequacy Ratio established           and improve its adjusted RAC ratio.
  by the Basel Accords; as of December 2020, Basel I
  ratio reached 32.2%.
                                                                                                  40
Table of contents

              1. Macroeconomic Overview

              2. CABEI’s Role and Policy Importance

              3. Results of the Amendments to CABEI’s Constitutive Agreement

              4. CABEI´s Credit Ratings

              5. Equity and Profitability

              6. ALM Policy

              7. Credit Risk Management

              8. Comparison with other MDBs

                                                                               41
High level and strong liquidity position

✓ Liquidity risk is mitigated by CABEI’s ALM Policy, which requires compliance with
  the key liquidity indicators used by rating agencies Standard & Poor’s and Moody’s
  to evaluate MDBs, in line with the Bank’s credit rating; as well as holding a
  minimum liquid asset coverage of 6 months of gross cash requirements which
  include loan disbursements, debt service obligations and operating expenses.

✓ CABEI also maintains a high level of liquid assets in relation to its total assets.

✓ In line with international risk management standards and the Bank’s ALM Policy,
  CABEI monitors both the Liquidity Coverage Ratio (LCR) and the Net Stable Funding
  Ratio (NSFR) proposed by Basel III. As of December 31, 2020, the aforementioned
  ratios stood at 4.56x and 1.32x, respectively.

✓ As of December 31, 2020, the effective duration of the Investment Portfolio was
                                                                                        42
  0.66 years.
Liquidity Risk - Investment Portfolio & Liquidity Levels

    Investment Portfolio Credit Quality Evolution                                                                      Liquidity by Sector

  ✓ The credit quality of the Investment Portfolio has improved in recent years, from 94% invested in liquid assets with an A rating or higher in 2016 to 96% in 2020.

  ✓ Likewise, the investment portfolio conformation by sector also reflects an improvement as the sovereign and supranational exposures have increased.

                                                                                                                                                                         43
Funding Strategy

               Objective                   Pilars

                                                        •   Bond Issuances
                                                        •   Loans
                                          Instruments   •   Comercial Paper Program
                                                        •   Term Deposits Program

   To access money markets and
   international capital markets to                     • International
                                          Markets       • Regional
   ensure     that    the     required
   resources to fulfill CABEI’s
   obligations will be available at the
   most efficient cost, to benefit
   CABEI´s     borrowing      member                    • Diversification by tenors
   countries.
                                          Maturities    • Asset/Liability Duration Management

                                          Costs         • Cost Efficiency

                                                                                                44
Evolution of Funding Sources shows how CABEI has matured as a frequent
issuer in the capital markets

      ✓ Funding Cost Optimization, which reflects the good perception international markets have regarding its credit profile and maturity
        as an institution.

      ✓ CABEI's financing structure reflects the institution’s preference for stable funding sources.

                                                                                                                                             45
Funding Diversification: CABEI has flexibility to access different markets
and currencies
                             Bonds Payable/Distribution by markets and currencies
           December 2006                                                               December 2020                                        NOK   2.84%
           US$1,200 million                                                            US$6,362 million
                                                                                                                    Others                  CNY   2.35%
                                                                                                                     16%
                                                                                                                                            AUD   2.13%
                                                           USD
                                                           32%                                                                              COP   1.74%

                                                                                                                                      CHF   CRC   1.72%
                                                                                                                                      23%
                                                                                                                                            NZD   1.11%

                                                                                                                                            HKD   0.81%

                                                                                                                                            USD   0.79%

                                                                                                                                            USD   0.79%

                                                                                                                                            THB   0.63%

                                                                 JPY                                                                        ZAR   0.39%
                                                                 3%
                                                                                                                             MXN
                                                                                                                             12%            SEK   0.33%
                                                                       UYU
                                                                       4%            EUR                 CNH
                                                                                     5%                   5%

  ✓ Funding Cost Optimization.
  ✓ Investor Diversification via debt issuance across markets and currencies as well as thematic bond. Historically, CABEI has made
    debt placements in 24 different currencies and 23 different markets.
  ✓ Funding and Lending Match in terms of floating rate exposure.
                                                                                                                                                          46
CABEI`s Recent Transactions

        3-Feb-2021             4-Dic-2020              12-Nov-2020          4-Jun-2020
        US$ 500 Mn             NZD 72 Mn                US$ 50 Mn           CHF 150 Mn

                                   2020                     2020
            2021                                                                 2020
                          Vaccine Bond II Private   Vaccine Bond Private
     Global Social Bond                                                      Swiss Market
                                Placement                Placement

         3-Jun-2020           29-Apr-2020               24-Mar-2020          31-Oct-2019
        US$ 375 Mn            US$ 750 Mn                                    US$ 375 Mn
                                                        MXN 4.3 Bn

          2020                   2020                      2020                   2019
      Formosa Market          Global Note             Mexican Market       Global Green Bond

                                                                                               47
International Strategic Partners of CABEI to mobilize/blend
resources to the Central American region.
                                Development Resources
                                   for Energy, MSME,
      Green Funding            Infrastructure, Education
                                    and Agriculture.       On-lending

                                                                             Central America
                                                                           development projects
           Export Credit
             Agencies
                                                            Co-financing

                                                                                                  48
CABEI Statements and Commitments on Climate Change

CABEI’s Board of Governors, as its highest level Authority, has issued two statements to express the Bank’s commitment to support
climate change mitigation and adaptation.

  April 2016 - Statement to Promote and Support Actions                    April 2019 - Statement on Zero Carbon
   to Finance Climate Change Adaptation and Mitigation                                    Emissions

 CABEI's commitment to:                                               CABEI’s commitment to:

 •   Support member countries to achieve the goals established        1) Refrain from financing projects related to the
     in COP21.                                                           exploration and extraction of coal and to the energy
                                                                         generation based on coal.
 •   Promote and support financing actions for climate change
                                                                      2) Contribute actively in:
     adaptation and mitigation.                                            a) Structuring and developing financial instruments
                                                                              to support climate change mitigation and
 •   Generate and implement mechanisms that facilitate the                    prevention.
     adoption of best practices regarding climate change                   b) Strengthening of low carbon economies.
     financing.                                                            c) Communities resilient to climate change.
                                                                           d) Sustainable food production.
                                                                           e) Clean energy generation and energy efficiency.
                                                                                                                                    49
Diversification of Financial Instruments to channel resources for
Climate Change projects

  Credit Lines from Partners                                                     Accreditation to Global Funds                    Green Bonds
                                                                                                                 CABEI´s contribution to sustainable world
                                                                                                                 green finance, supporting green infrastructure
                                                                                                                 in Central America

CABEI has mobilized US$1.2 billion to
finance climate change operations within
the 2016-2020 period.

 Mobilization of Resources from partners
       for Climate Change Projects
100%                   21,000,000.00
                                                                 50,000,000.00

 80%
                                                375,000,000.00
 60%                                                                                                             On November 2019, CABEI issued its first Global Green
          148,363,950.80            251,076,240.00
                                                             143,962,917.00                                      Bond for a total Amount of US$375 million.
                       125,173,761.00
 40%
                                                                                                                 CABEI's incursion in the green bond market is its latest
 20%                                             12,500,000.00

                                                 82,559,784.0031,529,249.00
                                                                                                                 green initiative.

 0%
           2016         2017           2018          2019        2020
       On-lending        Cofinanciamiento   paralelo
                             Parallel co-financing                 Bonos
                                                                     Bonds

                                                                                                                                                                            50
Green Bond Issuance Rationale

                                CABEI has implemented a strategy focused on Sustainable Development with
                                Environmental and Social Commitments. As such, by considering Sustainability as a
                                transverse strategic axis, CABEI aims not only to improve the quality of life of Central
                                Americans, but also to ensure the sustainable development of the territory and its
                                resources.

                                CABEI’s Green Bond issuances are intended to redirect financial flows towards strategic
                                sectors with strong contributions to the transition to a low-carbon economy:

                                •   Sustainable Land Use

                                •   Renewable Energy

                                •   Sustainable Water Management

                                •   Clean Transport

                                On September 24, 2019, CABEI’s Green Bond Framework achieved a favorable Second Party
                                Opinion (SPO) by the firm Sustainalytics. As part of its conclusion, the firm stated:

                                Sustainalytics: “CABEI’s Framework is aligned with the Bank’s Sustainable Development
                                strategy and that the environmental and social use of proceeds categories will advance a
                                number of key Sustainable Development Goals (SDGs). By adhering to strong eligibility
                                criteria, demonstrating a structured and transparent project selection process which ensures
                                the mitigation of environmental and social risks, committing to manage proceeds in
                                alignment with market practices and reporting on allocation and relevant quantitative
                                indicators, Sustainalytics considers that the CABEI Green Bond Framework is robust, credible
                                and in alignment with the four core components of the Green Bond Principles 2018.”

                                                                                                                               51
CABEI Reaffirms its Commitment to Promote Actions to Finance
Climate Change Mitigation: US$375 million 2019 Green Bond Issuance.

         ✓ On November 15, 2019 CABEI issued a US$375 million Floating Rate “USD Reg S Only”
           5-year Green Bond, listed on both, the Luxembourg and Taipei Stock Exchanges.

            ✓ The issuance engrossed an aggregate demand for approximately US$974 million,
              equivalent to an oversubscription of 3.2 times its original US$300 million
              announcement. Such demand was driven by Asian (75%) and European (25%)
              investors, including Banks, SSAs/Central Banks, Asset Managers, Broker Dealers and
              Private Banks among others, resulting in a well-diversified/high-quality transaction.

                                                                                                      52
CABEI´s Social Bond Framework

                                CABEI´s Social Bond framework is aligned with the 2020-2024 institutional strategy, which
                                includes human development and social inclusion within its transversal axes. CABEI´s social
                                bond framework has received favorable SPO by Sustainalytics, issuances are intended to
                                finance and refinance financial flows to:

                                ✓   Access to Essential Services

                                ✓   Employment Generation

                                ✓   Socioeconomic Empowerment

                                ✓   Affordable Basic Infrastructure

                                ✓   Food Security and sustainable food systems.

                                On January 6, 2021, CABEI’s Social Bond Framework received a favorable Second Party
                                Opinion (SPO) by the firm Sustainalytics. As part of its conclusion, the firm stated:

                                “Sustainalytics is confident that CABEI is well-positioned to issue social bonds and that
                                the social bond framework is robust, transparent, and in alignment with the core
                                components of the social bond principles 2020”.

                                                                                                                              53
CABEI issues its first Global Social Bond US$500 Million
                                         60.6% ESG Investors
                                         participation
  USD mm

                                                                       Closing price (Feb 3 2020)
                                                                       US$ 500 million MS + 57

                            IPT (Feb 2 2020)
                            MS + 70, CABEI 5YR USD 144A/REG S
                            Social Bond

2 DE FEB                                                                                         3 DE FEB

 ✓ On February 3rd 2021, CABEI successfully priced US$500mm a 1.140% 5-year Social rated Aa3 (Moody’s),
   and AA- (Fitch). This transaction represents CABEI’s inaugural USD-denominated Social Bond.

 ✓ The orderbook grew steadily, attracting real money investor demand, reaching over US$1.2bn in orders
   at its peak, Despite the price-tightening, orderbooks remained steady enabling CABEI to launch US$500
   million at +57 bps over Mid-Swaps
                                                                                                            54
Table of contents

              1. Macroeconomic Overview

              2. CABEI’s Role and Policy Importance

              3. Results of the Amendments to CABEI’s Constitutive Agreement

              4. CABEI´s Credit Ratings

              5. Equity and Profitability

              6. ALM Policy

              7. Credit Risk Management

              8. Comparison with other MDBs

                                                                               55
Financials: Credit Risk - Risk Management Policy

  Capital Adequacy and Leverage
                                                     Main Credit Policies:                     Main Credit Policies for Derivatives Exposures:
             Policies:
✓ CABEI´s Capital Adequacy Ratio           ✓ CABEI´s participation in project finance      ✓ Subscription of Credit Support Annexes (CSAs) with all
  requires that total equity represent       loans to the private sector must not            counterparties in order to mitigate the credit exposure. In that
  at least 35% of total risk weighted        exceed 40% of the total amount of the           sense, CABEI has established thresholds and margin calls
  assets.                                    loan during its life (60% for projects with     (collateral).
                                             amounts lower than US$25 million or with
                                             public sector participation).                 ✓ Credit risk in derivatives has been eliminated by requiring daily
✓ CABEI´s total loan portfolio shall not                                                     collateral and establish a "threshold" of 0. As part of this
  exceed 3.5 times its total equity                                                          initiative, since December 2013, a third party provides collateral
  (Gearing Ratio).                         ✓ For corporate private sector loans, the         management service to CABEI.
                                             collateral put forth by the client, must
✓ CABEI´s maximum leverage cannot            maintain a minimum coverage of 100% of        ✓ Calculation of net positions with counterparties under ISDA
  exceed 3 times its total equity (Debt      the total loan.                                 agreements.
  / Equity).
                                           ✓ Single Client Exposure (Private) must not     ✓ All counterparties must be approved by the ALCO Committee.
✓ By policy, the ALCO Committee              exceed 5% of the Bank´s equity, and the
  should monitor the capital adequacy        exposure to a regulated private financial     ✓ Counterparties in derivatives contracts must have an
                                             economic group must not exceed 10%.             investment grade rating. If an existing counterparty is
  indicator that incorporates the                                                            downgraded below investment grade, no new derivative
  criteria established in the framework                                                      contracts can be agreed between such entity and CABEI.
  of Basel II and III.                     ✓ State or mixed institutions with majority
                                             state participation with NSG should not       ✓ Credit exposure limits with derivative counterparties are
✓ By policy, the ALCO Committee              exceed 22% of CABEI’s equity.                   defined by the following conditions:
  should monitor the leverage ratio                                                               ✓ Financial international counterparties: Up to US$50
  established under Basel III.                                                                      million.
                                                                                                  ✓ For clients (Government, Financial Institutions o
                                                                                                    Corporates): ALCO Approval.

                                                                                                                                                                  56
Credit Risk: improving credit quality, zero arrears and NALs

                                           ✓ All Public Sector borrowers are current with their
                                             payments.
                                           ✓ All overdue and non-accrual loans observed in past years
                                             correspond to private sector operations.
                                           ✓ Historically and due to its preferred creditor status,
                                             CABEI's public sector loan portfolio does not present
                                             overdue loans or non-accrual status.
                                           ✓ CABEI’s credit quality has reached historical levels and
                                             is under control.

                                                                                                        57
Proven Preferred Creditor treatment
      CABEI´s Sovereign Arrears / Public Sector Outstanding Portfolio
                         (Dec. 2000 - Dec. 2020)                                       CABEI has consistently benefited from its Strong
                                                                                                            PCT.
                                                                                       ✓ Arrears on both Sovereign and Non- Sovereign loans do
                                                                                         not consider a grace period and are immediately
                                                                                         accounted for.

                                                                                       ✓ Arrears on sovereign lending have been scarce and all
                                                                                         cases have been quickly cured.

                                                                                       ✓ Even when considering the most conservative
                                                                                         scenario/analysis of using arrears of 1 day or more, the
                                                                                         outstanding balance of public sector arrears has not
                                                                                         exceeded 0.5% of the public sector’s total loan exposure.

                                                                                       ✓ CABEI has a strong track record of PCT, and will remain
                                                                                         so in the future.

                                                                                       ✓ According to the Bank’s Policy, loans are considered in arrears
                                                                                         when there is a delay in their effective date of payment >=1
                                                                                         day.

                                                                                       ✓ CABEI considers a loan to be in Non-Accrual Status when arrears
The importance of CABEI's policy is supported by key developments following the
                                                                                         are:
amendments to its Constitutive Agreement that entered into force in 2016, with the
aim of improving the Institution's governance, increasing its membership base and               >= 90 days in the case of private sector loans, and
allowing additional financing through diversifying its loan portfolio and additional
capital injections.                                                                            >= 180 days in the case of public sector loans.             58
Table of contents

              1. Macroeconomic Overview

              2. CABEI’s Role and Policy Importance

              3. Results of the Amendments to CABEI’s Constitutive Agreement

              4. CABEI´s Credit Ratings

              5. Equity and Profitability

              6. ALM Policy

              7. Credit Risk Management

              8. Comparison with other MDBs

                                                                               59
Key Financial Indicators: CABEI is better positioned than AAA MDBs
                                                         Ratio                                CABEI                        IBRD                         IADB

                            Rating (S&P/Moody's/JCR)                                     AA/Aa3/AA                  AAA/Aaa/AAA                   AAA/Aaa/AAA

                            Total Assets (US$ Million)                                        13,295                     296,804                       151,737

                                                                                     5 Year                      5 Year                        5 Year
                            Financial Ratios                                        Average
                                                                                                   Year 2020
                                                                                                                Average
                                                                                                                                  Year 2020
                                                                                                                                              Average
                                                                                                                                                               Year 2020

                            Return on Average Equity (ROE)                          5.26%              4.02%     0.70%             -0.10%      2.78%             1.81%
            PROFITABILITY

                            Return on Average Assets (ROA)                          1.54%              1.18%     0.09%             -0.01%      0.68%             0.42%

                            NII/Average Earning Assets (*)                          2.38%              2.07%     0.73%             0.74%       1.34%             1.05%

                            Equity/Total Assets                                     29.12%             27.74%   12.83%             13.61%     24.27%            22.19%
            LEVERAGE

                            Debt/Equity (times)                                      2.41               2.58      5.31              6.02       2.93              3.27
            LIQUIDITY

                            Liquid Assets/Total Assets                              32.92%             38.94%   23.74%             28.99%     25.77%            25.95%

                            Administrative Expenses/Average Total Assets            0.49%              0.46%     0.60%             0.72%       0.65%             0.62%
            EFICIENCY

                            Administrative Expenses/NII                             20.45%             22.56%   105.20%            99.14%     51.44%            62.41%

                            Administrative Expenses/Net Income                      34.90%             39.50%   -929.79%      -4952.38%       105.76%          145.90%

                            Allowance for Loan Losses/Total Gross Loan Portfolio    3.45%              3.47%     0.85%             0.78%       0.51%             0.48%
            PROVISIONING

                            Public Sector Allowance for Loan Losses/Public Sector
                                                                                    3.19%              3.14%     0.85%             0.78%       0.02%             0.06%
                            Loan Portfolio
                                                                                                                                                                           60
        (*) Earning Assets: Gross Loan Portfolio and Investments.
Thanks
You can also read