Investor Information Q2 2020 - Published July 22, 2020 - Suncor
←
→
Page content transcription
If your browser does not render page correctly, please read the page content below
SUNCOR ENERGY

Investor
Information
Q2 2020
Published July 22, 2020

 SUNCOR ENERGY
Living our purpose through COVID-19 response
                                 Suncor’s Purpose
               To provide trusted energy that enhances people’s lives,
                      while caring for each other and the earth

       What we are doing to promote the safety & well-being of our
                 employees, customers & communities

   • As an integrated energy producer, we continue to provide the energy needed to get critical goods and services to
     health-care providers, communities, & essential businesses

   • Enhanced safety protocols to protect our workforce including physical distancing guidelines, temperature screening,
     ramp up of on-site testing and protocols to manage any symptomatic workers

   • Rapidly implemented remote work for all non-essential personnel, supported by strengthened IT systems as well as
     tools and resources to maintain productivity and ensure employee well-being

   • Contributed $3 million to Petro-Canada locations to support essential workers through small acts of kindness, from
     fuel discounts to meals and showers

   • Contributed $2 million from Suncor, the Suncor Energy Foundation and employees through our SunCares program

   • Donated & distributed 40,000 N95 masks to Canada’s northernmost communities, in partnership with the Government
     of Canada

   • Collaborating with Western University to develop affordable COVID-19 home antibody testing kits using technology
     intended to treat wastewater from our operations1

SUNCOR ENERGY                                     1 See Slide Notes & Advisories                                           1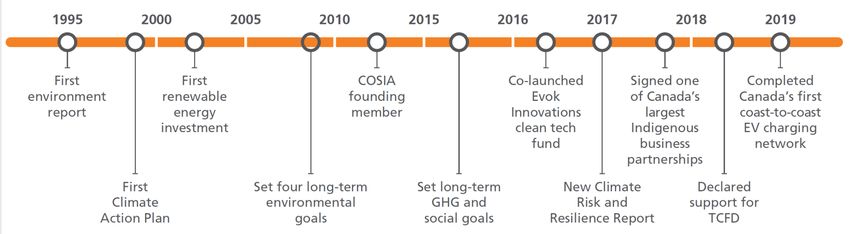
Financial Health & Long Term Value Focus
                                                                                                  reduction in go-forward
• Balance sheet strength & financial health is the foundation
                                                                                                  annualized cash
  of our strategy & capital allocation framework                               ~$4.5B             commitments1
                                                                                                  (from original 2020 guidance)
• Capital, operating cost & dividend reduction support our
  strong balance sheet, high investment grade credit ratings &                                    reductions from
  add to the resiliency of the company to focus on & invest in
  long term value creation                                                          ~$3B          changes to business2
                                                                                                  (capital + opex reductions)
• Commitment to shareholder returns remains –
                                                                                                  2020E FFO breakeven
  increasing shareholder returns when market conditions &
  balance sheet health permits as dividends & share
                                                                               ~$35/bbl           cost structure3,4
  buybacks remain core elements
                                                                                   WTI (US$)      (total enterprise operating costs
                                                                                                  + sustaining capital + dividend)

                                             Original 2020                                          Current 2020
                                              Guidance                                          Guidance & Outlook6,7
   2020E FFO Breakeven3,4
Integrated Model
2018 / 2019 AVERAGES OF PRODUCTS SOLD TO MARKET
REFINED PRODUCTS
~50% FFO1
470 kbpd2
SYNTHETIC CRUDE OIL
OFFSHORE ~25% FFO1 GASOLINE (43%)
BITUMEN 309 kbpd2 DISTILLATES (42%)
~15% FFO1
~10% FFO1 ASPHALT (6%) OTHER (9%)
104 kbpd2
163 kbpd2
HIGH
BASE PROCESSING,
VALUE
ENERGY INFRASTRUCTURE CONSUMER
ENERGY
SOURCES4 & LOGISTICS5 CHANNELS6
SOURCES3
Processing & using extensive Refining hydrocarbons into
Sale of Sale of
infrastructure, logistics & trading consumer products & marketing
unprocessed unprocessed
to optimize product movement to wholesale & retail consumers
energy products energy products,
at Brent pricing to majority at USGC across value chain
global markets heavy pricing
P H Y S I C AL I N T E G R AT I O N S T R AT E G Y
Agile & informed model to capture margin by processing & moving energy across the value chain
SUNCOR ENERGY 1, 2, 3, 4, 5, 6 See Slide Notes & Advisories 3Converting
500 Asset Value Maximization hydrocarbons into
consumer products
$150.00
2018 / 2019 AVERAGES1 ($CAD)
(Refer to pages 36 - 39 in Supplemental IR Deck for full reconciliation)
470
Product Value Transportation Cost kbpd3
Product Margin Processing Cost ~1/3 margin from
400 Royalty Cost Feedstock Cost $120.00
physical integration,
marketing & logistics1
Upgrading bitumen to $109
Globally priced higher value product per bbl
offshore production
300 $47 $90.00
309 per bbl
$88 kbpd2
per bbl
Minimizing $73
per bbl
200 exposure to low $60.00
$68 value bitumen
$34
per bbl per bbl
163
$45
$62 per boe
kbpd
per bbl $20
100 per bbl $30.00
104
$39 per bbl
kbpd Majority
$25 per bbl
$20 per boe
sold at
USGC
at global
heavy
pricing
0 $-
OFFSHORE SALES BITUMEN SALES SYNTHETIC CRUDE OIL REFINED PRODUCT
to market to market SALES SALES
to market to market
M A J O R I T Y O F P H Y S I C A L L Y I N T E G R A T E D V O L U M E S
SUNCOR ENERGY 1, 2, 3 See Slide Notes & Advisories 4Capital Allocation & Breakeven Sensitivities
Disciplined Capital Allocation1
O R D E R O F P R I O R I T Y
Annual FFO1,3 allocation (C$B)
Sustained Balance
price outlook2 sheet leverage
(WTI USD$/bbl) metrics Sustaining Economic Buyback
Dividend5
capital1,4 investment6 target5
$35 - $45 Upper range +Value Creation & Cost Management
Leading FFO/boe2 & Total Operating Expenses
Fort Hills & $1B target
Value over volume Hebron come cost
Total Operating reductions5 FFO2/boe
Elevated 2019 costs due to Expenses ($B) online & ramp
higher Y/Y FFO1 (+$800M) in up during year
12 $35
production vs. bitumen barrels Industry leading
as a result of higher SCO FFO/boe2
throughput during mandatory $30
10
production curtailment 10% Y/Y
cost
reduction $25
8
Counter cycle
$20
acquisitions in 2016
& new assets online in 6
2018 with >$5B/yr $15
additional revenue
4
+$800M
$10
FFO Y/Y
$1 billion target from
2 higher
operating cost reduction5 $5
margin
through cost savings, capture
staffing efficiencies, & 0 $-
temporary transition of Fort 2016 2017 2018 2019 2020E 5
Hills to one train operation
WTI ($US/bbl) $43.35 $50.95 $64.80 $57.05
Suncor FFO/boe2 Supermajor Avg FFO/boe2,3 Oil Sands Avg FFO/boe2,4
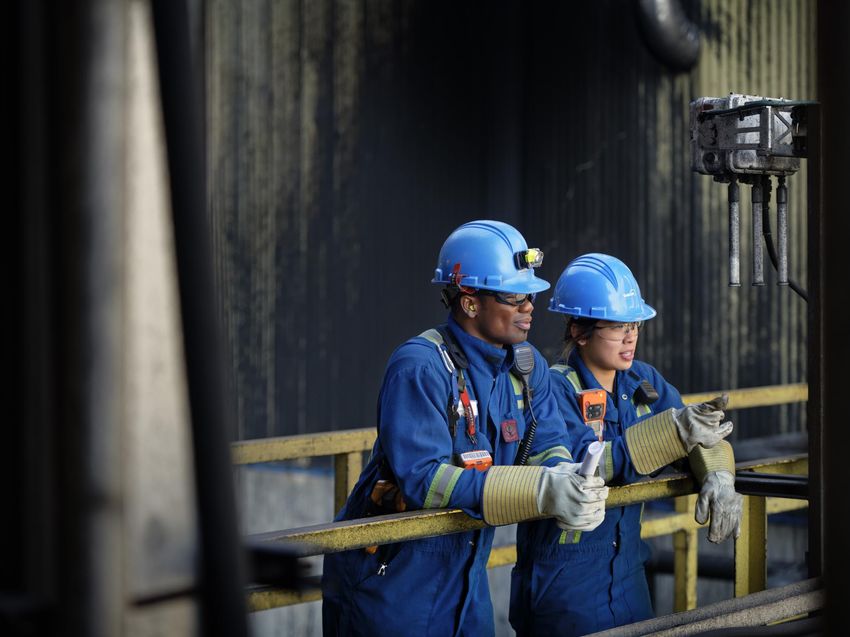
SUNCOR ENERGY 1, 2, 3, 4, 5 See Slide Notes & Advisories 6Operations & Consumer Network
29 year
Oil Sands
Reserve Life
Index1
~25 mmbbl
storage
Western
Canada
~1,850
PetroCanada
sites2 ~15 mmbbl
storage
Eastern
Canada
Only
refinery in
Colorado
~10 mmbbl
storage
Central US &
Gulf Coast
OIL & REFINED PRODUCT STORAGE (SUNCOR OPERATED)
CURRENT PIPELINES PROPOSED PIPELINES3
SUNCOR ENERGY 1, 2, 3 See Slide Notes & Advisories 7The Suncor Advantage1
L E A D I N G S U S T A I N A B I L I T Y T R A C K R E C O R D A C R O S S B U S I N E S S
PROCESSING,
ENERGY CONSUMER
INFRASTRUCTURE
SOURCES CHANNELS
& LOGISTICS
Access global markets through
sale of unprocessed energy Processing & using extensive Refining hydrocarbons into
products infrastructure, logistics & trading consumer products & marketing
to optimize product movement to wholesale & retail consumers
Bitumen: Majority USGC heavy pricing across value chain
Offshore: Brent pricing
ENERGY PROCESSING, CONSUMER
SOURCES INFRASTRUCTURE CHANNELS
& LOGISTICS
• Long life, low decline assets with • ~20% Canadian retail market share2
operational connectivity & flexibility • Upgrading improves value & • 1st cross-Canada EV charging network
• Newest oil sands asset (Fort Hills) marketability of products • Canada’s largest ethanol producer
has carbon intensity equivalent to • Asset flexibility
average U.S. refined barrel • Base Plant upgrader tied into Edmonton • ~460 kbpd refining capacity3
(refer to page 30 in Supplemental IR deck) Refinery, optimizing upgrading capabilities • Refineries & associated product market
• Produce bitumen to keep upgraders • Completion of interconnect pipeline
• Edmonton – across Canada, northwest US
anticipated in Q4 2020 to connect Base Plant &
full to support the value chain • Sarnia & Montreal – Toronto, Midwest US
Syncrude upgrading complexes
• Commerce City – Colorado
• Partnering with First Nations in • Refinery product mix flexibility4
• Capitalize on price dislocations through • Diesel: ~35 – 45%
responsible resource development alignment of upstream operations & risk • Gasoline: ~35 – 45%
• Target to reduce corporate GHG management activities • Jet Fuel: ~0 – 5%
intensity by 30% by 2030 • International presence through STO • Asphalt / Chemicals / Other: ~10 – 15%
(refer to page 14) office locations in London & Houston
• Significant storage (~50 mmbbls), • Investing in low carbon technologies to
infrastructure & logistics across, reduce GHG intensity of products
(refer to page 29 in Supplemental IR deck)
including 5,600 rail cars to move refined
products
SUNCOR ENERGY 1, 2, 3, 4 See Slide Notes & Advisories 8Strong Liquidity & Financial Position
Liquidity1 Manageable debt maturity profile1
~$9B Cash & cash equivalents (~$1.85B)
& available credit facilities (~$6.80B)
(C$ billion – as of June 30, 2020)
as of June 30, 2020
2020 $0.0
ALow Investment grade credit rating
2021-2022 $1.7
BBB+ DBRS Rating Limited (A Low)
Standard & Poor’s Rating Services (BBB+)
2023-2024 $1.6
Baa1 Moody’s Corp (Baa1)
2025-2029 $3.0
2030-2034 $3.0
2035-2039 $5.2
Total debt to capitalization
37.5% as of June 30, 2020; Target 20-35%;
Debt Covenant of 65%
2040-2047 $1.5
Net debt to FFO2 Supermajor Peer3 Oil Sands Peer3
Suncor demonstrates financial responsibility among peers
Suncor
PEER
0x 6x
RANGE
Peer Supermajor Peer
Oil Sands
Min Peer Median Max
Peer Median
TTM as of March 31, 2020
SUNCOR ENERGY 1, 2, 3 See Slide Notes & Advisories 92020 Capital Allocation1,2
ECONOMIC ($millions) Q1 Q2 Rem 20201 Total2
INVESTMENT
Decline Mitigation 257 155 300 – 400 ~715 – 815
CAPITAL
E&P 162 120 280 – 330 ~565 – 615
$1.4 - $1.6B Q2 SPEND ~$261M___ _____
In-Situ Well Pads 95 35 20 – 70 ~150 – 200
High grading capital spend on Q1 SPEND ~$543M__________
$2B Free Funds Flow
quick payout, top quartile IRR 105 80 170 – 220 ~355 – 405
Growth3,4
projects to improve efficiency,
flexibility & resilience3 Other Economic
181 26 165 – 175 ~370 – 380
Investment
Total 543 261 635 – 795 ~1,440 – 1,600
($millions) Q1 Q2 Rem 20201 Total2
ASSET
SUSTAINMENT & Oil Sands 673 340 755 – 925 ~1,765 – 1,935
MAINTENANCE1 Q2 SPEND ~$410M_________
Refining & Marketing 49 64 235 – 285 ~350 – 400
$2.2 - $2.4B E&P 3 2 20 – 30 ~25 – 35
Investing in base business Q1 SPEND ~$739M_________
Corporate 14 5 0 – 10 ~20 – 30
& regular maintenance Total 739 410 1,010 – 1,250 ~2,160 – 2,400
SUNCOR ENERGY 1, 2, 3, 4 See Slide Notes & Advisories 10$2B Free Funds Flow Growth Update1,2
Structural, sustained free funds flow1 growth potential for years 2020 – 2025 inclusive3,
through margin improvements, operating & sustaining capital cost reductions, & growth opportunities
Projects Implemented by 2023 2024 – 2025 Deployment
(~$1B Free Funds Flow1,2) (~$1B Free Funds Flow1,2)
Supply & Trading Refinery Optimization
Value chain optimization Product mix & turnaround optimization
Suncor / Syncrude Interconnecting Pipelines Debottlenecks
Optimizing margins; in-service Q4 2020 Fort Hills, MacKay River & Firebag processing facilities
Coke Fired Boiler Replacement (cogen)
Tailings Management – Implementation of PASS4
Lower cost, high efficiency, power revenue upside;
~$4/bbl average expected savings
sanctioned September 2019; in-service 2024-2025
(Refer to page 25 in Supplemental IR deck)
(Refer to page 31 in Supplemental IR deck)
AHS Deployment5 Asset Synergies
Fort Hills fully deployed by Q4 2020; Millennium deployment TBD Coordinated maintenance strategies,
(Refer to page 30 in Supplemental IR deck) sharing of knowledge & best practices, etc.
Forty Mile Wind Project
Business Process Transformation
Sustainable economic returns through low carbon power generation
SAP S4 digital process transformation
& retaining generated carbon credits; in-service 2024-2025
Supply Chain Management
Reduce supplier base to strategic suppliers;
integrate across supply chains; regionalization of services
Digital Technology Adoption
Advanced process analytics (operational optimization), robotic process automation (cost reduction),
wireless employee badges (worker safety & optimization), rotating equipment sensoring & remote monitoring, etc.
SUNCOR ENERGY 1, 2, 3, 4, 5 See Slide Notes & Advisories 11Technology & New Energy Investment
2019 investment breakdown >$2B in technology investment
cumulative spend since 20151
$830M New technologies1 $830M spent on $2,165
(~70% capitalized2) technology development &
deployment in 2019
$115M Low carbon power3
(Base Plant Cogeneration capital spend)
$1,335
$85M Renewable energy4
(Forty Mile Wind Project capital spend)
$700
2019 TECHNOLOGY & $350
>$1B NEW ENERGY SPEND (~$770M capex)5
$200
2015 2016 2017 2018 2019
($millions)
~14% 2019 CAPITAL ALLOCATED TO TECHNOLOGY & NEW ENERGY 5
$830M technology investment breakdown
In situ
Emissions Mining & Low optimization,
Digital transformation Tailings & mine closure carbon joint
e.g. PASS6 reductions extraction
e.g. solvents e.g. AHS7 fuels ventures,
e.g. Enerkem etc.
SUNCOR ENERGY 1, 2, 3, 4, 5, 6, 7 See Slide Notes & Advisories 12Our Sustainability Journey
A multi-decade history of environmental and social action
1
2
A track record of setting and exceeding sustainability targets
2009
Improve key environmental performance indicators by 2015
Energy efficiency, fresh water use, reclamation, air emissions – met or exceeded targets
✓
Increase participation of Indigenous Peoples in energy development, evaluate by 2025
Examples of successful partnerships include $1B East Tank Farm, $3.1B SCM spend since 2015, On track
39 Indigenous-owned PetroCanada retail sites and counting
2015
Harness technology and innovation for a lower-carbon energy system
Target 30% lower GHG intensity3 by 2030 vs. 2014 – achieved or sanctioned 20%4
On track
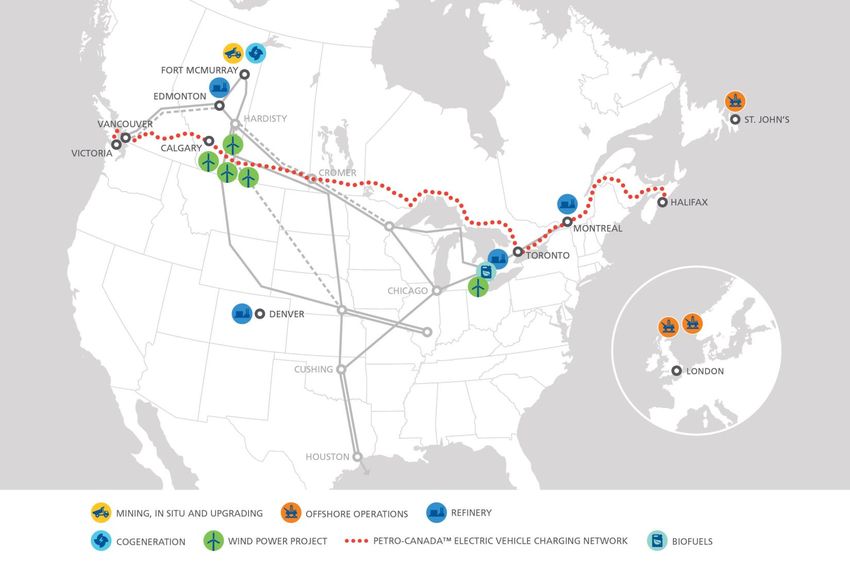
SUNCOR ENERGY 1, 2, 3, 4 See Slide Notes & Advisories 13Advancing Low Carbon Energy
~10% intensity
reduction
2014 BASELINE
achieved to date3
Investing in
Today low-carbon Fort Hills
power extraction
technology
Energy efficiency ~10% intensity
2030 TARGET Developing
& deploying
reduction
sanctioned4
new
technologies New
GHG cogeneration
~2.5Mt/y GHG
GOAL Running
emission reductions
operations on Forty Mile Wind
Reducing natural gas ~0.375Mt/y GHG
moving to emissions avoided Identified
emissions low-carbon reductions5
intensity by fuels
Biofuels technology
30% by investments
(Enerkem, Lanzatech)
20301 Enhanced extraction
1 Implementing
& improving technology
energy Wind energy
efficiency
Energy efficiency
TODAY 2025 2030
SUNCOR ENERGY 1, 2, 3, 4, 5 See Slide Notes & Advisories 142020 Capital & Production Guidance1
CAPITAL EXPENDITURES PRODUCTION & OPERATING COSTS
Capital2 Economic Production4 Cash Operating Costs5
($ millions) Investment3 (boepd) ($/bbl)
Oil Sands 2,500 – 2,650 25% Oil Sands Operations 410,000 – 435,000 $24.00 – $26.50
E&P 550 – 650 95% Fort Hills (54.11% WI) 55,000 – 65,000 $34.00 – $37.00
Downstream 450 – 550 20% Syncrude (58.74% WI) 165,000 – 180,000 $35.00 – $38.00
Corporate 100 – 150 80% E&P 100,000 – 115,000 -
Total 3,600 – 4,000 40% Total Upstream Production 740,000 – 780,000 -
Refinery throughput 390,000 – 420,000 -
Refinery utilization 84% – 91% -
BUSINESS ENVIRONMENT Refined product sales 500,000 – 530,000
Oil Prices ($US/bbl)
Brent (Sullom Voe) $42.00
WTI (Cushing) $39.00
PLANNED MAINTENANCE6 (Suncor operated assets & Syncrude6)
WCS (Hardisty) $25.00
Timing Impact on quarter
Refining Margin ($US/bbl) Upstream (mbpd)
NYH 2-1-1 $12.00 U1 Q3 / Q4 ~20 / 15
U2 Q3 ~15
Natural Gas Price ($/GJ)
Syncrude Q3 ~20
AECO – C Spot $2.00 Downstream
Exchange Rate (CAD/USD) $0.74 Edmonton Q3 ~35
2020 SENSITIVITIES7 +$1/bbl Brent +$1/bbl NYH 2-1-1 +$0.01 FX +$1/GJ AECO +$1L/H Diff +$1L/L Diff
(US$) (US$) (US$/C$) ($) (US$) (US$)
FFO ($ millions) ~280 ~125 ~(125) ~(235) ~(65) ~(50 – 70)
SUNCOR ENERGY 1, 2, 3, 4, 5, 6, 7 See Slide Notes & Advisories 15Advisories
Forward-Looking Statements – Forward-Looking Statements – This sources of debt and equity capital; the timing and the costs of well and Funds from operations (previously referred to as cash flow from
presentation contains certain “forward-looking statements” within the pipeline construction; Suncor’s dependence on pipeline capacity and operations) is defined in the Q2 MD&A, for the three months ended June
meaning of the United States Private Securities Litigation Reform Act of other logistical constraints, which may affect the company’s ability to 30, 2020 is reconciled to the GAAP measure in the Q2 MD&A, for 2016 to
1995 and “forward-looking information” within the meaning of applicable distribute products to market; mandatory production curtailments being 2019 is reconciled to GAAP measures in Suncor’s annual management’s
Canadian securities legislation (collectively, “forward-looking greater or imposed for longer than anticipated; the timely receipt of discussion and analysis (MD&A) for the respective year, and in Suncor's
statements”), including statements about: Suncor’s strategy and business regulatory and other approvals; the timing of sanction decisions and Investor Information Supplemental published July 22 2020. Oil Sands
plans; expectations for refinery feedstock mix and refined products mix, Board of Directors’ approval; the availability and cost of labour, services, cash operating costs, Fort Hills cash operating costs, Syncrude cash
including gasoline, diesel, jet fuel, distillates and asphalt; expectations and infrastructure; the satisfaction by third parties of their obligations to operating costs and free funds flow (previously referred to as free cash
about planned capital expenditures, FFO break-even on US$ WTI Suncor; the impact of royalty, tax, environmental and other laws or flow) are defined and reconciled, as applicable, in the Q2 MD&A.
pricing, balance sheet leverage metrics, cost reductions, FFO allocation, regulations or the interpretations of such laws or regulations; applicable
and operating and financial results; reserves estimates and reserve life political and economic conditions; risks associated with existing and Reserves – Unless noted otherwise, reserves information presented
indices; expected utilization of assets; expectations for dividends, share potential future lawsuits and regulatory actions; improvements in herein for Suncor is presented as Suncor’s working interest (operating
repurchases, production growth, funds from operations, free funds flow performance of assets; and the timing and impact of technology and non-operating) before deduction of royalties, and without including
growth and the basis for such expectations; statements about the $1 development. any royalty interests of Suncor, and is at December 31, 2019. For more
billion reduction in operating costs target and planned reductions from information on Suncor’s reserves, including definitions of proved and
changes to business, including the factors expected to contribute to the Although Suncor believes that the expectations represented by such probable reserves, Suncor’s interest, location of the reserves and the
reduction; Suncor's debt maturity profile; anticipated capital spending for forward-looking statements are reasonable, there can be no assurance product types reasonably expected please see Suncor’s most recent
the remainder on 2020; statements about Suncor's $2 billion free funds that such expectations will prove to be correct. Suncor’s Management's Annual Information Form dated February 26, 2020 available at
flow target, including the timing thereof and the projects which are Discussion and Analysis for the quarter ended June 30, 2020 and dated www.sedar.com or Form 40-F dated February 27, 2020 and available at
expected to achieve it; statements about Suncor’s GHG intensity July 22, 2020 (the Q2 MD&A), Annual Report for the year ended www.sec.gov. Reserves data is based upon evaluations conducted by
reduction goal including the expected impact of sanctioned projects; December 31, 2019 (the 2019 Annual Report) and its most recently filed independent qualified reserves evaluators as defined in NI 51-101.
nameplate capacities; expectations for and potential benefits of the Annual Information Form/Form 40-F and other documents it files from
cogeneration facility, value chain optimization, business process time to time with securities regulatory authorities describe the risks, BOE (Barrels of oil equivalent) – Certain natural gas volumes have
transformation, digital technology adoption, Forty Mile Wind Project, uncertainties, material assumptions and other factors that could influence been converted to barrels of oil on the basis of six thousand cubic feet to
Suncor/Syncrude interconnecting pipelines, biofuels technology actual results and such factors are incorporated herein by reference. one boe. This industry convention is not indicative of relative market
investments, hydro treated renewable diesel, AHS deployment and Copies of these documents are available without charge from Suncor at values, and thus may be misleading.
PASS; statements about Suncor’s investments in its lower-carbon 150 6th Avenue S.W., Calgary, Alberta T2P 3E3, by calling 1-800-558-
technology portfolio and in technologies, including the expected benefits 9071, or by email request to invest@suncor.com or by referring to the Impact of the COVID-19 Pandemic – The COVID-19 pandemic is an
therefrom; expectations about Fort Hills extraction technology; capital company’s profile on SEDAR at www.sedar.com or EDGAR at evolving situation that will continue to have widespread implications for
and production guidance; and planned maintenance and the timing www.sec.gov. Except as required by applicable securities laws, Suncor our business environment, operations and financial condition. Actions
thereof; that are based on Suncor’s current expectations, estimates, disclaims any intention or obligation to publicly update or revise any taken around the world to help mitigate the spread of COVID-19 have
projections and assumptions that were made by Suncor in light of its forward-looking statements, whether as a result of new information, and will continue to have significant disruption to business operations
experience and its perception of historical trends. Some of the forward- future events or otherwise. Suncor’s actual results may differ materially and a significant increase in economic uncertainty. Our operations and
looking statements may be identified by words such as “planned”, from those expressed or implied by its forward-looking statements, so business are particularly sensitive to a reduction in the demand for, and
“estimated”, “target”, “goal”, “illustrative”, “strategy”, “expected”, readers are cautioned not to place undue reliance on them. prices of, commodities that are closely linked to Suncor’s financial
“focused”, “opportunities”, “may”, “will”, “outlook”, “anticipated”, performance, including crude oil, refined petroleum products (such as jet
“potential”, “guidance”, “predicts”, “aims”, “proposed”, “seeking” and Suncor’s corporate guidance includes a planned production range, fuel and gasoline), natural gas and electricity. The timing of an economic
similar expressions. Forward-Looking statements are not guarantees of planned maintenance, capital expenditures and other information, based recovery is currently uncertain. This could result in reduced utilization
future performance and involve a number of risks and uncertainties, on our current expectations, estimates, projections and assumptions and/or the suspension of operations at certain of our facilities, buyers of
some that are similar to other oil and gas companies and some that are (collectively, the Factors), including those outlined in our 2020 Corporate our products declaring force majeure or bankruptcy, the unavailability of
unique to Suncor. Users of this information are cautioned that actual Guidance available on www.suncor.com/guidance, which Factors are storage, and disruptions of pipeline and other transportation systems for
results may differ materially as a result of, among other things, incorporated herein by reference. Suncor includes forward-looking our products, which would further negatively impact Suncor’s production
assumptions regarding: the current and potential adverse impacts of the statements to assist readers in understanding the company’s future plans or refined product volumes, and could adversely impact our business,
COVID-19 pandemic, including the status of the pandemic and future and expectations and the use of such information for other purposes may financial condition and results of operations. The company expects its
waves and any associated relaxations (or tightening) of current business not be appropriate. financial results for the year to experience a material decline relative to
restrictions, shelter-in-place orders or gatherings of individuals; the results in Suncor’s audited Consolidated Financial Statements for the
commodity prices and interest and foreign exchange rates; the Non-GAAP Measures – Certain financial measures in this presentation – year ended December 31, 2019. The recent resurgence of COVID-19
performance of assets and equipment; capital efficiencies and cost- namely funds from operations, free funds flow, Oil Sands operations cash cases in certain geographic areas, and the possibility that a resurgence
savings; applicable laws and government policies; future production operating costs, Fort Hills cash operating costs and Syncrude cash may occur in other areas, has resulted in the re-imposition of certain
rates; the development and execution of projects; assumptions operating costs – are not prescribed by GAAP. All non-GAAP measures restrictions by local authorities. This further increases the risk and
contained in or relevant to Suncor’s 2020 Corporate Guidance; product presented herein do not have any standardized meaning and therefore uncertainty as to the extent and duration of the COVID-19 pandemic and
supply and demand; market competition; future production rates; assets are unlikely to be comparable to similar measures presented by other the resultant impact on commodity demand and prices.
and facilities not performing as anticipated; expected debottlenecks, cost companies. Therefore, these non-GAAP measures should not be
reductions and margin improvements not being achieved to the extent considered in isolation or as a substitute for measures of performance
anticipated; dividends declared and share repurchases; the sufficiency of prepared in accordance with GAAP. All non-GAAP measures are
budgeted capital expenditures in carrying out planned activities; risks included because management uses the information to analyze business
inherent in marketing operations (including credit risks); imprecision of performance, leverage and liquidity and therefore may be considered
reserves estimates and estimates of recoverable quantities of oil, natural useful information by investors. See the “Non-GAAP Financial Measures
gas and liquids from Suncor’s properties; expected synergies and the Advisory” section of the Q2 MD&A
ability to sustain reductions in costs; the ability to access external
SUNCOR ENERGY 16Slide Notes
Slide 1------------------------------------------------------------- opportunities currently being evaluated and which may be
(1) See Forward-Looking Statements and Impact of the COVID- Slide 3------------------------------------------------------------- subject to Board of Directors, counterparty and regulatory
19 Pandemic in the Advisories. (1) Funds from operations (FFO) is a non-GAAP financial approval. There can be no assurances these initiatives will
Slide 2------------------------------------------------------------- measure. See Non-GAAP Measures in the Advisories. be pursued or if pursued that they will result in the expected
(1) Represents reduction in planned spend: $1 billion operating Funds from operations is calculated as cash flow provided benefits. See Forward-Looking Statements in the Advisories.
costs compared to 2019 levels, $1.9 billion capital spend by operating activities excluding changes in non-cash (7) Refers to estimated average WTI crude oil price for 2020 in
against original guidance midpoint of $5.7 billion and working capital. Refers to average annual calculated values US dollars required for funds from operations for 2020 to
annualized go-forward dividend reduction of 55%. as at December 31, 2018 and December 31, 2019. equal estimated 2020 total enterprise operating costs;
(2) Calculated using annualized reduction in spend: $1 billion (2) Refers to average annual calculated values as at December sustaining capital expenditures inclusive of associated
operating costs compared to 2019 levels and $1.9 billion 31, 2018 and December 31, 2019. Actual results going capitalized interest and dividends. Sustaining capital
capital spend against original guidance midpoint of $5.7 forward may differ materially. See Forward-Looking represents anticipated asset sustainment and maintenance
billion. Statements and Impact of the COVID-19 Pandemic in the capital expenditures plus well pad spend (inclusive of
(3) Funds from operations (FFO) is a non-GAAP financial Advisories. associated capitalized interest) based on the company’s
measure. See Non-GAAP Measures in the Advisories. FFO (3) Refers to E&P sales volumes and associated costs, sales current business plans. Assumes production, sustaining
(or the most similar non-GAAP measure as used by the and margin. capital and business environment at the midpoint of 2020
respective peer) is calculated as cash flow provided by (4) Refers to bitumen sales volumes to market and associated guidance released on July 22, 2020 and a $0.21/share
operating activities excluding changes in non-cash working costs and margin. Excludes internally transferred volumes. dividend for each quarter in 2020. All dividends are at the
capital. Non-GAAP measures do not have any standardized (5) Refers to Synthetic Crude Oil sales volumes to market and discretion of Suncor’s Board of Directors. Actual results may
meaning and therefore are unlikely to be comparable to associated costs and margin. Excludes internally transferred differ materially. FFO is a non-GAAP financial measure. See
similar measures presented by other companies, including volumes. Forward-Looking Statements and Impact of the COVID-19
Suncor’s own FFO. Therefore, these non-GAAP measures (6) Refers to refined product sales volumes to market and Pandemic in the Advisories
should not be considered in isolation or as a substitute for associated costs and margin. Excludes third party Slide 6 --------------------------------------------------------------
measures of performance prepared in accordance with purchased refined product and associated costs. (1) Funds from operations (FFO) is a non-GAAP financial
GAAP. Figures are converted to US dollars at the average Slide 4 -------------------------------------------------------------- measure. See Non-GAAP Measures in the Advisories. FFO
exchange rate for each period. (1) Values based on actual averages for 2018 and 2019. Actual (or the most similar non-GAAP measure as used by the
(4) Refers to estimated average WTI crude oil price for 2020 in results may differ materially. See Forward-Looking respective peer) is calculated as cash flow provided by
US dollars required for funds from operations for 2020 to Statements and Impact of the COVID-19 Pandemic in the operating activities excluding changes in non-cash working
equal estimated 2020 total enterprise operating costs; Advisories capital. Non-GAAP measures do not have any standardized
sustaining capital expenditures inclusive of associated (2) Refined product sales average of 470 kbpd excludes third meaning and therefore are unlikely to be comparable to
capitalized interest and dividends. Sustaining capital party purchased refined product. similar measures presented by other companies, including
represents anticipated asset sustainment and maintenance Slide 5 -------------------------------------------------------------- Suncor’s own FFO. Therefore, these non-GAAP measures
capital expenditures plus well pad spend (inclusive of (1) Based on current business plans, which are subject to should not be considered in isolation or as a substitute for
associated capitalized interest) based on the company’s change. See Forward-Looking Statements and Impact of the measures of performance prepared in accordance with
current business plans. Assumes production, sustaining COVID-19 Pandemic in the Advisories GAAP. Figures are converted to US dollars at the average
capital and business environment at the midpoint of 2020 (2) All values are annual and assumes a constant Brent-WTI exchange rate for each period.
guidance released on July 22, 2020 and a $0.465/share price differential of +US$5. (2) FFO/boe is calculated on a trailing twelve basis as at
dividend for the first quarter in 2020 and a $0.21/share (3) Baseline funds from operations (FFO) has been derived from December 31, 2019. FFO, and metrics derived from FFO,
dividend for the remaining quarters in 2020. All dividends are midpoint of 2020 guidance and the associated business are non-GAAP financial measures. See Non-GAAP
at the discretion of Suncor’s Board of Directors. Actual environment. Sensitivities are based on changing a single Measures in the Advisories.
results may differ materially. FFO is a non-GAAP financial factor by its indicated range while holding the rest constant. (3) Supermajors peers in alphabetical order: BP plc., Chevron
measure. See Non-GAAP Measures, Forward-Looking FFO is a non-GAAP financial measure and is calculated as Corporation, ExxonMobil Corporation, Royal Dutch Shell
Statements and Impact of the COVID-19 Pandemic in the cash flow provided by operating activities excluding changes plc., Total S.A. Source of information: Factset.
Advisories. in non-cash working capital. See Non-GAAP Measures in the (4) Oil Sands peers in alphabetical order: Canadian Natural
(5) Dividends are at the discretion of Suncor’s Board of Advisories. Resources Ltd., Cenovus Energy Inc., Husky Energy Inc.,
Directors. See Forward-Looking Statements in the (4) Sustaining capital represents anticipated asset sustainment Imperial Oil Limited, MEG Energy Corp. MEG Energy Corp.
Advisories. and maintenance capital expenditures (inclusive of has been excluded from shareholder returns. Source of
(6) Based on current business plans, which are subject to associated capitalized interest) based on the company’s information: Factset.
change. See Forward-Looking Statements and Impact of the current business plans. (5) Based on company’s current business plans and the current
COVID-19 Pandemic in the Advisories. (5) Dividends and future buybacks are at the discretion of business environment, which are subject to change. Actual
(7) Full guidance is available at suncor.com/guidance. See Suncor’s Board of Directors. Share buybacks are subject to results may differ materially. See Forward-Looking
Forward-Looking Statements and Impact of the COVID-19 maximum limits permitted by law and stock exchange rules. Statements and Impact of the COVID-19 Pandemic in the
Pandemic in the Advisories. See Forward-Looking Statements in the Advisories. Advisories
(8) Represents go-forward dividend of $0.21/share. (6) Based on company’s current business plans and the current
business environment, which are subject to change. Actual continued …
results may differ materially. Includes possible future
SUNCOR ENERGY 17Slide Notes
Slide 7 -------------------------------------------------------------- (4) Free funds flow, previously referred to as free cash flow, is there to be impacts to our GHG intensity due to government
(1) As at December 31, 2019 and assumes that approximately 7.04 calculated by taking funds from operations (FFO) and subtracting mandated production curtailment and COVID-19 impact on
billion barrels of oil equivalent (boe) of proved and probable capital expenditures, including capitalized interest. Free funds flow demand.
reserves (2P) are produced at a rate of 640.4 mboe/d, Suncor’s is a non-GAAP measure. See Non-GAAP Measures in the (4) See Suncor’s 2020 Report on Sustainability for further details on
average daily production rate in 2019. Reserves are working Advisories. the methodologies used to calculate GHG intensity There can be
interest before royalties. See Reserves in the Advisories. Slide 11 ------------------------------------------------------------- no assurance that these projects will result in the expected
(2) 1,856 retail and wholesale sites are operated under the Petro- (1) Free funds flow, previously referred to as free cash flow, is benefits. We expect there to be impacts to our GHG intensity due
Canada brand as of December 31, 2019. calculated by taking funds from operations (FFO) and subtracting to government mandated production curtailment and COVID-19
Slide 8 -------------------------------------------------------------- capital expenditures, including capitalized interest. Free funds flow impact on demand. See Forward-Looking Statements and Impact
(1) Based on company’s current business plans and the current is a non-GAAP measure. See Non-GAAP Measures in the of the COVID-19 Pandemic in the Advisories.
business environment, which are subject to change. Actual results Advisories. (5) There can be no assurance that these projects will result in the
may differ materially. See Forward-Looking Statements in the (2) Based on possible future opportunities, including examples shown expected benefits. See Forward-Looking Statements and Impact
Advisories. on the slide, currently being evaluated and which may be subject of the COVID-19 Pandemic in the Advisories
(2) Based on Kent (a Kalibrate company) survey data for year-end to Board of Directors’, counterparty and regulatory approval. There Slide 15 --------------------------------------------------------------
2019. can be no assurance these opportunities will be pursued or if (1) Full guidance is available at suncor.com/guidance. See Forward-
(3) 1,546 retail stations in Canada, 310 wholesale Petro-Canada pursued that they will result in the expected benefits. See Looking Statements and Impact of the COVID-19 Pandemic in the
locations, as of December 31, 2019. Excludes retail service Forward-Looking Statements and Impact of the COVID-19 Advisories
stations in Colorado and Wyoming (239, as of December 31, Pandemic in the Advisories. (2) Capital expenditures exclude capitalized interest of approximately
2019). (3) Based on company’s current business plans and the current $155 million.
(4) Nameplate capacities as at December 31, 2019. Nameplate business environment, which are subject to change. Actual results (3) Balance of capital expenditures represents Asset Sustainment and
capacities may not be reflective of actual utilization rates. See may differ materially. Maintenance capital expenditures. For a description of asset
Forward-Looking Statements and Impact of the COVID-19 (4) Refers to Permanent Aquatic Storage Structure (PASS). sustainment and maintenance capital expenditures see the
Pandemic in the Advisories (5) Refers to Autonomous Haulage Systems (AHS). Capital Investment Update section of the Q2 MD&A.
(5) Reflects the aggregated product mix from Suncor's refineries and Slide 12 -------------------------------------------------------------- (4) At the time of publication, production in Libya continues to be
may not be indicative of the product mix available at a single (1) 2018 and 2019 figures include digital technology spend. affected by political unrest and therefore no forward looking
refinery. Refinery product mix flexibility is based on historical (2) Capitalization percentage based on internal accounting treatment. production for Libya is factored into the Exploration and
results and may not be reflective of future performance. See (3) Capital refers to investment in Base Plant Cogeneration Facility Production and Suncor Total Production guidance. Production
Forward-Looking Statements and Impact of the COVID-19 Project spent in 2019. ranges for Oil Sands operations, Fort Hills, Syncrude and
Pandemic in the Advisories (4) Capital refers to investment in Forty Mile Wind Project spent in Exploration and Production are not intended to add to equal
Slide 9-------------------------------------------------------------- 2019. Suncor total production.
(1) All figures are in billions of CAD. U.S dollar facilities converted at (5) Total investment may not be inclusive of all investments across (5) Oil Sands operations cash operating costs, Fort Hills cash
a USD/CAD rate of $0.73, the exchange rate as at June 30, 2020. business. 14% calculated as $770 million divided by 2019 capital operating costs and Syncrude cash operating costs are non-GAAP
(2) FFO is a non-GAAP financial measure. See Non-GAAP Measures of $5,436 million. financial measures. See Non-GAAP Measures in the Advisories.
in the Advisories. FFO is calculated as cash flow provided by (6) Refers to Permanent Aquatic Storage Structure (PASS). (6) Subject to change. Estimated impacts have been factored into
operating activities excluding changes in non-cash working (7) Refers to Autonomous Haulage Systems (AHS). annual guidance.
capital. Slide 13 -------------------------------------------------------------- (7) Syncrude is operated by Syncrude Canada Limited.
(3) Oil Sands peers in alphabetical order: Canadian Natural (1) COSIA refers to Canadian Oil Sands Innovation Alliance. (8) Baseline funds from operations (FFO) has been derived from
Resources Ltd., Cenovus Energy Inc., Husky Energy Inc., Imperial (2) TCFD refers to Task Force on Climate-related Financial midpoint of 2020 guidance and the associated business
Oil Limited, MEG Energy Corp. Supermajors peers in alphabetical Disclosures. environment. Sensitivities are based on changing a single factor
order: BP plc., Chevron Corporation, ExxonMobil Corporation, (3) Based on company’s current business plans and the current by its indicated range while holding the rest constant. FFO is a
Royal Dutch Shell plc., Total S.A. Source of information: Factset. business environment, which are subject to change. Actual results non-GAAP financial measure and is calculated as cash flow
Slide 10 -------------------------------------------------------------- may differ materially. See Forward-Looking Statements in the provided by operating activities excluding changes in non-cash
(1) Balance of capital expenditures represents Asset Sustainment Advisories. working capital. See Non-GAAP Measures in the Advisories.
and Maintenance capital expenditures. For a description of asset (4) Actual results may differ materially. See Forward-Looking
sustainment and maintenance capital expenditures see the Statements in the Advisories. We expect there to be impacts to
Capital Investment Update section of the Q2 MD&A. Estimated our GHG intensity due to government mandated production
impacts have been factored into annual guidance. Capital curtailment and COVID-19 impact on demand.
expenditures exclude capitalized interest of approximately $120 Slide 14 --------------------------------------------------------------
million. (1) See Suncor’s 2020 Report on Sustainability for further details on
(2) Full guidance is available at suncor.com/guidance. See Forward- the methodologies used to calculate GHG intensity and our GHG
Looking Statements and Impact of the COVID-19 Pandemic in the goal. Actual results may differ materially. See Forward-Looking
Advisories. Statements in the Advisories.
(3) Based on company’s current business plans and the current (2) See Suncor’s 2020 Report on Sustainability for further details on
business environment, which are subject to change. Actual results the methodologies used to calculate GHG intensity.
may differ materially. See Forward-Looking Statements and (3) See Suncor’s 2020 Report on Sustainability for further details on
Impact of the COVID-19 Pandemic in the Advisories. the methodologies used to calculate GHG intensity. We expect
SUNCOR ENERGY 18Investor Relations Contacts
Trevor Kate Muhammad Kinga Stacey
Bell Charlton Usman Uto Hunter
Vice President IR Director IR Senior Analyst IR Senior ESG Analyst IR Coordinator IR
tgbell@suncor.com kcharlton@suncor.com muusman@suncor.com kuto@suncor.com sthunter@suncor.com
Visit us at the Investor Centre on suncor.com
1-800-558-9071
invest@suncor.com
SUNCOR ENERGY 19You can also read