Insulin-Related Liver Pathways and the Therapeutic Effects of Aerobic Training, Green Coffee, and Chlorogenic Acid Supplementation in Prediabetic ...
←
→
Page content transcription
If your browser does not render page correctly, please read the page content below

Hindawi
Oxidative Medicine and Cellular Longevity
Volume 2022, Article ID 5318245, 14 pages
https://doi.org/10.1155/2022/5318245

Research Article
Insulin-Related Liver Pathways and the Therapeutic Effects of
Aerobic Training, Green Coffee, and Chlorogenic Acid
Supplementation in Prediabetic Mice

 Milad Abdollahi ,1 Sayyed Mohammad Marandi ,1 Kamran Ghaedi ,2
 Zahra Safaeinejad ,3 Fatemeh Kazeminasab ,4 Samaneh Shirkhani ,1
 Mohammad Hossein Sanei ,5 Parsa Rezvanian ,3
 and Mohammad Hossein Nasr-Esfahani 3
 1
 Department of Exercise Physiology, Faculty of Sport Sciences, University of Isfahan, Iran
 2
 Department of Cell and Molecular Biology and Microbiology, Faculty of Biological science and Technology University of
 Isfahan, Iran
 3
 Department of Animal Biotechnology, Cell Science Research Center, Royan Institute for Biotechnology, ACECR, Iran
 4
 Department of Physical Education and Sport Sciences, Faculty of Human Sciences, University of Kashan, Kashan, Iran
 5
 Acquired Immunodeficiency Research Center, Isfahan University of Medical Sciences, Isfahan, Iran

 Correspondence should be addressed to Milad Abdollahi; miladabdollahir75@gmail.com,
 Sayyed Mohammad Marandi; s.m.marandi@spr.ui.ac.ir,
 and Mohammad Hossein Nasr-Esfahani; mh.nasr-esfahani@royaninstitute.org

 Received 19 November 2021; Revised 24 January 2022; Accepted 28 January 2022; Published 24 February 2022

 Academic Editor: Laura Bravo

 Copyright © 2022 Milad Abdollahi et al. This is an open access article distributed under the Creative Commons Attribution License,
 which permits unrestricted use, distribution, and reproduction in any medium, provided the original work is properly cited.

 Background. The liver controls blood glucose levels via regulation of anabolic (glycogen synthesis and gluconeogenesis) and catabolic
 (glycolysis and glycogenolysis) processes through activation of the PI3K-AKT signalling pathway. The aim of this study was to assess
 the effect of aerobic training, green coffee, and chlorogenic acid supplementation on glucose metabolism-regulating pathways in
 prediabetic mice. Methods. C57BL/6 mice were exposed to a high-fat diet and physical activity limitation to induce a state of
 prediabetes. After 12 weeks, mice were fed a high-fat diet compared to the control mice. The prediabetic mice were further treated
 with either green coffee, chlorogenic acid, or training or combinations of the same for 10 weeks. At the end of the experimental
 period, metabolic data (FBG, GTT, HOMA for IR, plasma level of insulinfrom systematic, AST, and ALT assessed into blood),
 histopathologic, and analysis of gene and protein expressions were obtained for target tissues. Results. Training along with green
 coffee and chlorogenic acid supplementation improved complications of prediabetes including weight gain and elevated fasting
 blood glucose and plasma insulin levels. These effects were associated with the changes in mRNA levels of genes important in
 hepatic glycogen synthesis (GYS2), glucogenesis (PCK and G6PC2), and glycolysis (GK, PK, and PFKL). Conclusion. The training
 in conjunction with green coffee or chlorogenic acid is effective in the prevention of prediabetes in mice. As these interventions are
 relatively inexpensive and safe application to individuals with prediabetes appears warranted.

1. Introduction prediabetic patients, normal levels of fasting blood glucose
 and glucose tolerance test are 100-125 mg/dl and 145-
Prediabetes (PD) is a metabolic disorder characterized by 199 mg/dl, respectively. Prediabetics have 3-10 times the risk
higher than normal and less than diabetic levels of blood of progressing to type 2 diabetes mellitus (T2DM) compared
glucose [1, 2]. Impaired fasting glucose (IFG) and glucose to nonprediabetics [5]. The primary cause of PD is insulin
tolerance (IGT) tests assist in making the diagnosis [3, 4]. In resistance in the muscle, liver, and adipose tissues. This pro-
2 Oxidative Medicine and Cellular Longevity

 Time Control groups PD groups
 N=5 N = 30
 Normal diet

 Adaptation
 1 week
 12 weeks diets
 High fat diet

 Induced-PD
 Prediabetes – induced
 N = 30 Verify diabetic status
 and
 dividing mice to group

 Pre-Diabetes (PD)
 PD
 N=5 PD - GC (p.o. – 3 D/W)
 GC
 N=5 PD - CA (p.o. – 3 D/W)
 Interventions

 Ex
 10 weeks diets

 N=5
 CA Endurance exercise (D/W)
 N=5
 Ex-GC Endurance exercise (5 D/W)
 N=5 GC (p.o. – 3 D/W)
 Ex-CA
 Endurance exercise (5 D/W)
 N=5
 CA (p.o. – 3 D/W)
 End

 35 mice were sacrificed

 (a)

 Glycolysis path
 PK Pyruvate
 GK PFKL
 Glucose
 F6P F1,6bP PEP

 Glycogen Gluconeogenesis
 path AKT path
 GSK3 FOX0
 PI3K
 GYS2 PEPCK G6PC2
 IRSI

 Insulin

 (b)

Figure 1: Research design. (a) Methodology. Induction of prediabetes has been shown during interventions (first intervention [12 weeks,
mice were divided into control (Ctrl) and prediabetic (PD) groups]) and treatment (second intervention [10 weeks, PD were randomly
divided into 6 groups: prediabetes group (PD), 2 prediabetes groups treated with green coffee (PD/GC), 3 prediabetes group treated with
chlorogenic acid (PD/CGA), 4 prediabetes groups treated with aerobic training (PD/EX), 5 prediabetes group treated with aerobic
training and green coffee (PD/EX.GC), and 6 prediabetes group treated with aerobic training and chlorogenic acid (PD/EX.CGA).]). All
mice were euthanized at the end of the 22nd week. (b)Measurement. Insulin-related and glycolysis pathways.IRS1/2, insulin receptor
substrate 1; PI3K, phosphoinositide-3 kinase; AKT, protein kinase B; GSK3, glycogen synthase kinase 3; GYS2, glycogen synthase 2;
FOXO1, forkhead box protein O1; G6PC2, glucose-6-phosphatase 2; PEPCK, phosphoenolpyruvate carboxykinase. GK, glucokinase; F6P,
fructose 6-phosphate; PFKL, phosphofructokinase, liver type; F16BP, fructose 1,6-bisphosphate; PK, pyruvatekinase.

gressive resistance to insulin leads to degradation in pancreatic times more insulin to suppress glycogenolysis and glucogen-
beta-cell function and decreased insulin secretion and T2DM. esis. The importance of insulin on whole-body glucose
Obesity is considered a primary factor accounting for insulin homeostasis in the liver is well documented [8, 9]. In
resistance. This is important, as current lifestyle factors such hepatocytes, insulin acts through the PI3K/AKT signalling
as sedentary routines and consumption of high-calorie diets pathway. In hepatocytes, insulin binds to its receptors result-
promote weight gain and obesity [6, 7]. ing in IRS1/2 phosphorylation activating the downstream
 Insulin is secreted from beta cells of the pancreas into the target PI3K/AKT. Glycogen synthase kinase-3 (GSK3), tran-
portal vein. Thus, unlike other organs that receive insulin scription factor forkhead box O1 (FOXO1), and glucokinase
from systemic blood circulation, the liver is exposed to 2-3 (GK) are AKT pathway substrates [10, 11]. On the one hand,
Oxidative Medicine and Cellular Longevity 3

 [mV]
 150

 100

 7.33 Chlorogenic acid
 Voltage

 8.22 Caffeine 2
 50

 0

 0 2 4 6 8 10
 [min.]
 Time

 (a)
 Compound Reten. time Start time End time Area Height Height Efficiency Resolution Symmetry/
 name [min] [min] [min] [mV.s] [mV] [%] [th.pl] [–] Tai ling
 [–]
 1 Chlorogenic acid 7.327 6.650 7.793 1904.729 129.943 85.2 6144 0.951
 2 Caffeien 8.223 7.793 8.890 331.505 22.500 14.8 8232 2.442 1.219
 Total 2236.234 152.442 100.0

 (b)

Figure 2: HPLC chromatogram of CGAs in green coffee bean extract (BSK). (a) the percentages of chlorogenic acid and caffeine in green
coffee. (b) the biochemical characteristics of chlorogenic acid and caffeine in green coffee.

insulin resistance and obesity, hepatic IRS1/2 undergoes ser- according to the Animal Ethics Committee of Royan Insti-
ine phosphorylation to limit AKT activation and disrupt tute’s recommendations.
glycogen synthesis, thus promoting glycogenolysis and glu- Four-week-old male C57BL6 mice, weighing 12–14 g, were
coneogenesis [12]. On the other hand, glycolysis is also used in this study. Mice were housed in pathogen-free barrier
disrupted by insulin resistance [12]. Glycogen synthase 2 facilities under controlled temperature (23° C ± 3° C) and
(GYS2), as the main enzyme in glycogen synthesis, is regu- humidity with a 12-h light/dark cycle. Access to food and water
lated by insulin through control of transcription and was ad libitum. After 1 week of adaptation, the mice were ran-
cytoplasmic to nucleus transit [9](Figure 1). domly divided into two groups: control (Ctrl; n = 5) and high-
 Lifestyle routines including diet, training, and mainte- fat diet (HFD; n = 30) mice. Mice in the Ctrl group received a
nance of an ideal body weight provide protection from PD standard diet (containing carbohydrates 47.7%, fat 12.5%, and
[1, 13, 14]. Coffee is widely consumed and has potential protein 20.5%) while mice in the HFD group received a diet
therapeutic properties. Green coffee (GC) is unroasted, containing 25% carbohydrates, 60% fat, and 15% protein for
increasing in use, is thought to have antioxidant and anti- 12 weeks. Particularly, the fat ingredients in HF diets are satu-
inflammatory properties, and has been propped as a rated. After ensuring the emergence of PD, the HFD group
treatment for certain diseases. Green coffee is rich in phyto- was divided into six subgroups (n = 5): prediabetic mice (PD
chemicals such as chlorogenic acid (CA) that is believed to group), prediabetic mice treated with green coffee (200 mg/kg,
be the main source of its beneficial properties [15–18]. PD/GC group), prediabetic mice treated with chlorogenic acid
 The American Diabetes Association recommends that (100 mg/kg, PD/CGA), prediabetic mice which underwent
adults with diabetes perform moderate to vigorous aerobic training (PD/EX), prediabetic mice treated with green coffee
training to reduce the prevalence of diabetes-related com- +training (PD/EX. GC), and prediabetic mice treated with
plications such as cardiovascular and renal disease [19, chlorogenic acid+training (PD/EX. CGA) [21–24].
20]. As such, training remains a cornerstone, albeit not Green coffee tablets were purchased from BSK (Zist
adhered to, in the prevention and treatment of T2DM. Takhmir, Tehran-Iran). These tablets are a natural product
There is an abundance of studies on the effect of green made from 400 mg of standardized green coffee bean extract
coffee and its active ingredient chlorogenic acid on diabe- powder containing 2% caffeine and 50% chlorogenic acid,
tes. However, no report has assessed these natural which these main substates analyzied by HPLC. Briefly,
products in combination with training on hepatic glycogen HPLC analysis of CGAs in green coffee bean extract (BSK)
storage in PD. In the current study, we evaluated the was performed using the HPLC-diode array detector gradi-
simultaneous effects of aerobic trainingwith green coffee ent system (Agilent 1090 series) (Figure 2). Green coffee
and chlorogenic acid on glycogen synthesis, glycolysis, and CGA were administered as a gavage supplement, three
and gluconeogenesis in the liver of PD mice. times per week for 10 weeks.
 During the experiment period, the mice were weighed
2. Material and Methods every 7 days. At the end of the experimental period, animals
 were euthanized after a 12-h overnight fast under xylazine
2.1. In Vivo Experiments. This study was approved by the and ketamine anaesthesia. Serum and liver tissues were
Ethics Committee of Royan Institute (ethics code: IR.A- immediately stored at −80°C for further analysis. Figure 1
CECR.ROYAN.REC.1399.075). All animals were treated demonstrates the flowchart of the study.
4 Oxidative Medicine and Cellular Longevity

 Table 1: PCR primers.

Gene Forward primer (5 ′ -3 ′ ) Reverse primer (5 ′ -3 ′ ) Annealing temperature (°C)
GYS2 ACCAAGGCCAAAACGACAG GGGCTCACATTGTTCTACTTGA 58
PCK AAGCATTCAACGCCAGGTTC GGGCGAGTCTGTCAGTTCAAT 56
G6PC2 CCTGATGGTGGTGGCTCTA TCTCTGTGCTGTGGCTCTATT 56
PK ATATCACCCAGGTCGTTGCA CGAAGCGCAGATCCAAAAGA 54
PFKL GTGGAAGGAGGCGAGAACATCAAG GCCGTGTTGGAGCAGATTGTAGG 60
GC CCCTGTAAGGCACGAAGACATA AGAAGTCCCACGATGTTGTT 56

2.2. Biochemical Analyses. Fasting blood glucose (FBG) (Thermo Fisher Scientific, Waltham, MA, USA). In order
and glucose tolerance tests (GTT) were performed at the to remove contaminating genomic DNA, samples were
end of the 12th and 22nd week of the intervention using treated with DNase I (TaKaRa, Japan). mRNA was reverse
a glucometer (Alpha TRAK glucometer, Zoetis, US) from transcribed with 1 μg of total RNA using the cDNA syn-
a tail prick. For GTT, mice were fasted for 6 hours and thesis kit (Biotechrabbit, Germany, Berlin) according to
then gavaged with 200 μl glucose solution. Blood glucose the manufacturer’s instruction. RT-qPCR was performed
was measured at 0, 30, 60, 90, and 120 min later. The with SYBR Green (TaKaRa, Japan) using an Applied Bio-
plasma level of insulin was determined with an Ultra- systems real-time PCR thermal cycler (Thermo Fisher
Sensitive Mouse Insulin ELISA Kit (ALPCO 80-INSMS- Scientific, Waltham, MA, USA). The evaluation of gene
E01, Keewaydin Drive, USA) according to the manufactur- expression was carried out according to the 2−ΔΔct method.
er’s instructions. Plasma aspartate aminotransferase (AST) Accordingly, the relative gene expression was calculated
and alanine aminotransferase (ALT) levels were measured according to 18 s rRNA as an internal control. Primer
using Mouse AST and ALT ELISA Kits (ELISA Kit- pairs were designed by the Beacon designer (Version 7.2,
CSB-E12649m, UK and ELISA Kit- MBS016898, respec- USA) and purchased from Micro-gene (Korea). The
tively, Abcam, USA, San Diego) according to the primer sequences are shown in Table 1.
manufacturer’s protocol.
 2.5. Western Blot Analysis. Proteins were extracted from the
2.3. Training Intervention. Aerobic training was carried out tissue samples using the TRI reagent, according to the
for 10 weeks (5 days/week). Briefly, all mice were accli- manufacturer’s protocol. Equal amounts of each protein
mated to running on a treadmill (10 min, using different sample (30 μg) were subjected to SDS PAGE and trans-
speeds) for 1 week. On day 1, an electric shock is applied ferred to PVDF membranes. Membranes were blocked
to make the mice start running, after which they will run with a blocking buffer containing 10% skim milk (Milli-
spontaneously. In other words, this method provides the pore, USA) and 5% TBST. The membranes were probed
sole external motivator through grid and mice quickly with primary antibodies including anti-Akt antibody (1:
acquire that make maintain some distance from the grid 2000, ab30471, Elabscience, USA), anti-p-Akt (Thr 308)
when running [25]. Aerobic training was performed on a antibody (1 : 1000, sc271966, Santa Cruz, USA), anti-β
treadmill at low to moderate intensity (50%-60% MAV), actin antibody (1 : 1000, sc47778, Santa Cruz, USA), anti-
45 minutes per day for 5 days per week for 10 weeks, glycogen synthase 2 antibody (1 : 1000, sc390391, Santa
the exact time for training was between 10 p.m. and Cruz, USA), and anti-phospho-glycogen synthase
11 p.m. The experiment was carried out in a quiet, well- (Ser641) antibody (1 : 1000, Cell Signaling, USA) for 1.5
ventilated room with low humidity at a temperature of hours at room temperature. Subsequently, the membranes
18 ± 2° C. The sedentary mice in the control group were were incubated for 1 hour at room temperature with an
treated similar to the training mice except they were not appropriate secondary antibody: horseradish peroxidase-
engaged in regular running. Each training session included (HRP-) conjugated goat antimouse IgG (1 : 5000, Dako,
3 minutes of warm-up, 40 minutes of training, and 2 P0447) or HRP-conjugated goat antirabbit IgG (1 : 16000,
minutes of recovery. The initial training intensity was Santa Cruz, SC2301). Bands were visualized by an Amer-
15 m/min. The intensity was increased 2 m/minute every sham ECL Advance Western Blotting Detection Kit (GE
2 weeks until it reached 23 m/min on the final week. Thus, healthcare). The activity of AKT protein was measured
the first and second week used an intensity of 15 m/min, by comparing the level of phosphorylated AKT with the
the third and fourth week an intensity of 17 m/min, the level of nonphosphorylated AKT. The ImageJ software
fifth and sixth week an intensity of 19 m/min, the seventh (National Institutes of Health, Bethesda, MD, USA) was
and eighth week an intensity of 21 m/min, and the ninth utilized for quantification of the intensity band.
and tenth week an intensity 23 m/min [26].
 2.6. Histological Studies. Immediately after the human eutha-
2.4. RT-qPCR Analysis. The total RNA isolation from the nasia of the mice, the livers were removed, selected at
liver tissue was performed using the TRIzol reagent random, sliced into small pieces, and were fixed in 10%
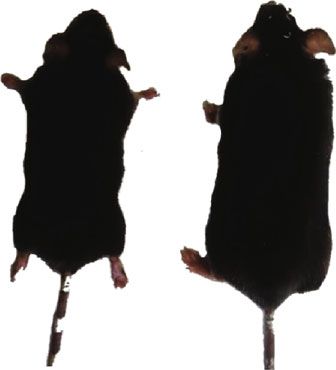
Oxidative Medicine and Cellular Longevity 5

 Ctrl HFD 34
 35 ⁎⁎⁎

 Weight gain percentile (%)
 30 ⁎ 32

 Body weight (g)
 25
 30
 20
 28
 15
 2 cm 2 cm
 10 26
 0 2 4 6 8 10 12 Ctrl HFD
 Weeks
 Ctrl
 HFD

 (a) (b) (c)
 160 ⁎⁎⁎ 3.0 ⁎⁎⁎
 200 2.5×10⁴
 ⁎⁎⁎ 2.5

 Plasma insulin (ng/mL)
 140

 AUC (mg/dL × 120 min)
 Blood glucose (mg/dL)
 FBG (mg/dL)

 150 2.0
 2×10⁴
 120 ⁎ 1.5
 100 ⁎
 ⁎
 1.5×10⁴ 1.0
 100 50
 0.5

 80 0 1×10⁴ 0.0
 Ctrl HFD 0 30 60 90 120 Ctrl HFD Ctrl HFD
 Time (min)
 Ctrl
 HFD

 (d) (e) (f)
 p-AKT 60 kDa
 AKT 60 kDa
 -Actin 43 kDa
 0.8 1.5
 ⁎⁎⁎

 0.6
 HOMA-IR (mmol/L)

 1.0
 p-AKT/AKT

 0.4

 0.5
 ⁎
 0.2

 0.0 0.0
 Ctrl HFD Ctrl HFD

 (g) (h)

Figure 3: HFP promotes PD in mice. (a) Ctrl and HFD mice, (b and c) the percentage changes of bodyweight (12 weeks), and weight gain
([the final body weight (23 weeks) - the primary bodyweight (12 weeks)]). (d-g) Plasma Biochemical Analysis including (d and e) fasting
blood glucose (FBG) concentration, glucose tolerance test (GTT), and the area under the curve (AUC) in Ctrl and HFD groups. (f)
Plasma insulin concentration and (g) HOMA index in Ctrl and HFD groups. (h) Immunoblot analyses of liver lysates for protein level
evaluations such as p-AKT and total AKT in Ctrl and HFD groups. All values are presented as mean ± SD. ∗ = p < 0:05 and ∗∗∗ = p <
0:001 indicate significant statistical differences in HFD compared to Ctrl mice.

buffered formalin and embedded in paraffin. Fixed tissues 2.7. Statistical Analysis. The statistical analyses were carried
were then cut into 5-μm thickness tissue sections. After out using GraphPad Prism 8.4.3 software (GraphPad Soft-
deparaffinization and hydration, sections were stained with ware, San Diego, CA, USA).The paired sample t-test was
hematoxylin and eosin (H&E). The periodic acid-Shiff performed to evaluate the prediabetic group compared to
(PAS) was used to stain glycogen in the liver sections. Slides the control group. One-way analysis of variance (ANOVA)
were observed using a light microscope. and Tukey’s post-hoc test were used to determine statistical
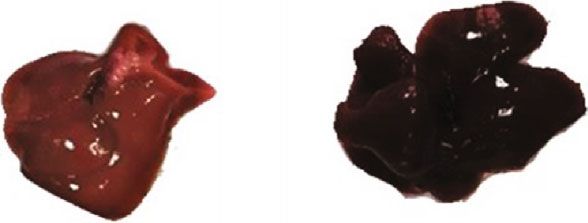
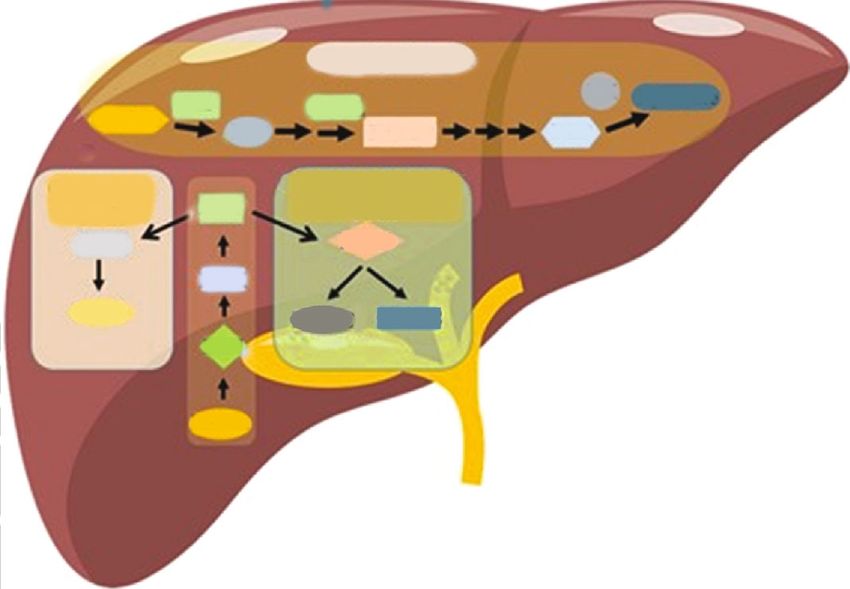
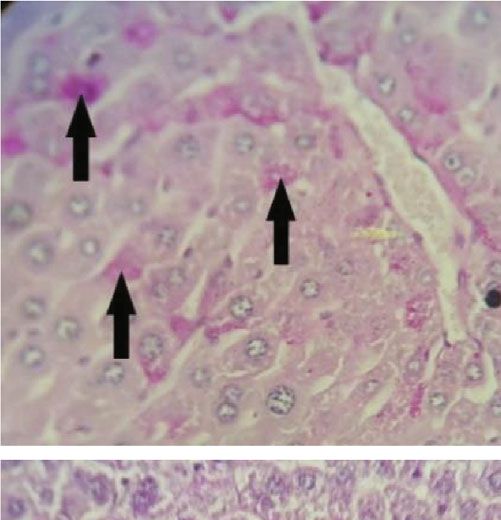
6 Oxidative Medicine and Cellular Longevity

 Ctrl

 5.5

 ⁎⁎⁎
 5.0

 Liver weight (%)
 HFD

 4.5

 Ctrl HFD
 4.0

 3.5
 Ctrl HFD
 (a) (b) (c)
 75
 500 100
 ⁎⁎ ⁎⁎⁎
 400 80
 Liver glycogen (mg/g)

 50 ALT (U/L)
 AST (U/L)

 300 60
 ⁎
 200 40
 25

 100 20

 0 0 0
 Ctrl HFD Ctrl HFD Ctrl HFD
 (d) (e)

Figure 4: HFD promotes liver damage in mice. (a) Liver morphology of Ctrl and HFD mice. (b) The percentage change of liver weight (The
ratio of liver to total body weight for Ctrl and HFD mice). (c) Histopathology of liver sections (PAS staining) from Ctrl and HFD mice
(arrows indicate glycogen accumulations). (d) Quantitative assessment of hepatic glycogen (mg/g). (e) Systematic plasma levels of
specific liver enzymes (AST and ALT ) in Ctrl and HFD mice. All values are presented as mean ± SD. ∗ = p < 0:05, ∗∗ = p < 0:01, and
∗∗∗
 = p < 0:001 indicate significant statistical differences in HFD compared to Ctrl mice.

significance between all treatment groups. p − value < 0:05 morphology and histopathology were comparable among
depicts significant difference between samples. All experi- groups and not grossly abnormal (data not shown). How-
mental results are presented as mean ± SD. ever, the ratio of liver weight to total bodyweight was greater
 for the HFD-fed mice (Figures 4(a) and 4(b)). As expected,
3. Results PAS staining was less in liver samples from the HDF-fed
 mice (Figures 4(c) and 4(d)). Finally, the analysis of plasma
3.1. HFD Promotes Prediabetes in Mice. The animals given levels of AST and ALT found that the enzymes were signif-
the HFD showed a significant increase in body weight and icantly higher in mice receiving the HFD compared to the
the percentage of weight gain (Figures 3(b) and 3(c)). Addi- ND-fed animals (Figure 4(e)).
tionally, the animals demonstrated increases in FBS, GTT
(Figures 3(d) and 3(e)), and plasma insulin levels compared 3.2. HFD Is Associated with Changes in mRNA Levels of Genes
to the mice receiving the ND (Figure 3(f)). Consistent with Involved in Hepatic Glycogen Synthesis, Gluconeogenesis, and
these changes, the HOMA-IR index was significantly ele- Glycolysis. In order to investigate the possible causes of
vated in the HFD-fed mice (Figure 3(g)). The Western hyperglycemia and reduced liver glycogen content, hepatic
analysis of hepatic protein expression demonstrated less mRNA levels of genes associated with glycogen synthesis,
AKT protein phosphorylation in organs from the HFD glycolysis, and gluconeogenesis were examined. The livers
versus the ND group (Figure 3(h)). Interestingly, the liver from HFD-fed mice showed reduced expression of Gys2
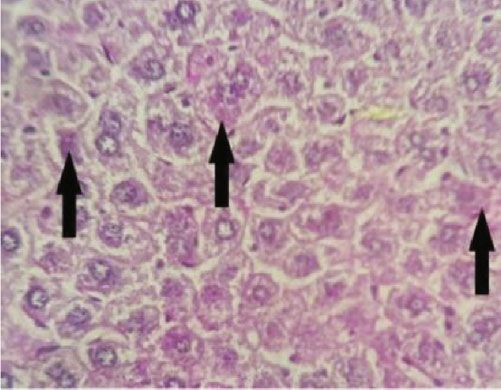
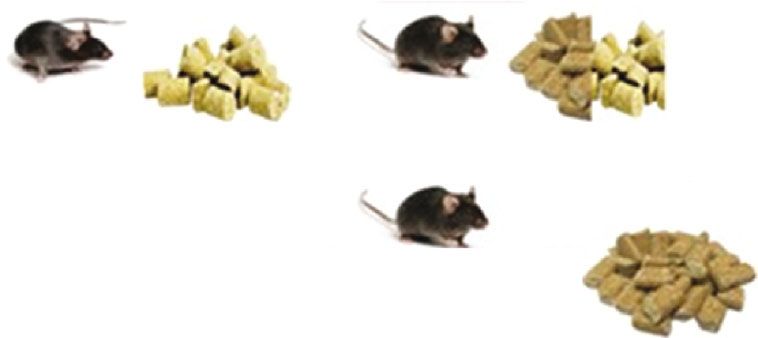
Oxidative Medicine and Cellular Longevity 7

 p-GYS2 90 kDa
 GYS2 90 kDa
 -Actin 43 kDa
 1.5 1.1 1.4

 1.0
 1.3

 1.0 0.9

 p-GYS2/GYS2
 GYS2/18srna

 Pck/18sRNA
 1.2
 0.8
 1.1
 ⁎
 0.5 0.7
 ⁎⁎
 1.0
 0.6

 0.0 0.5 0.9
 Ctrl HFD Ctrl HFD Ctrl HFD

 (a) (b) (c)
 1.8 ⁎
 1.5 1.5 1.5

 1.6

 ⁎⁎
 G6pc2/18sRNA

 1.0 1.0 1.0

 GCK/18sRNA
 Pfkl/18sRNA

 1.4
 Pk/18sRNA

 1.2 ⁎⁎
 0.5 0.5 0.5 ⁎⁎⁎
 1.0

 0.8 0.0 0.0 0.0
 Ctrl HFD Ctrl HFD Ctrl HFD Ctrl HFD
 (d) (e) (f) (g)

Figure 5: HFD is associated with changes in hepatic metabolic enzyme mRNA levels. (a) RT-qPCR analysis of Gys2 in the livers from the
Ctrl and HFD mice. (b) Immunoblotting analyses of p-GYS2 and total GYS2 protein in the livers from the Ctrl and HFD groups, (c) RT-
qPCR analysis of G6pc2, and (d) Peck mRNA in the livers from the Ctrl and HFD mice. (e–g) RT-qPCR analysis of Pk, Pfkl, and Gk mRNA
in the livers from the Ctrl and HFD mice. All values are presented as mean ± SD. ∗ = p < 0:05, ∗∗ = p < 0:01, and ∗∗∗ = p < 0:001 indicate
significant statistical differences in the HFD compared to Ctrl mice.

mRNA (Figure 5(a)). The Western analysis of hepatic protein by HPLC (Figure 2). In the groups receiving GC and CGA,
expression demonstrated less GYS2 protein phosphorylation no weight loss was observed compared to the control PD
in organs from the HFD versus the ND group (Figure 5(b)). group. In contrast, the mice that underwent EX regardless
The mRNA levels of two gluconeogenesis enzymes, phospho- of other treatments showed significant weight loss compared
enolpyruvate carboxykinase (Pck1 = Peck and glucose-6- to the control PD group (Figures 6(a) and 6(b)). All treat-
phosphatase catalytic subunit 2 (G6pc2), were increased in ments improved blood glucose levels (Figure 6(c)) and glu-
mice on the HFD compared to the mice on the ND, although cose tolerance in the PD mice (Figure 6(d)). Moreover, all
in the case of Pck1was unchanged. (Figures 5(c) and 5(d)). treatments resulted in decreased plasma insulin levels com-
Additionally, in the livers from the HFD mice, mRNA levels pared to the controls (Figure 6(e)). Importantly, EX was
of glucokinase (Gk), pyruvate kinase (Pk), and (Pfkl) phos- found to have the greatest effect on insulin levels. In keeping
phofructokinase were decreased compared to the controls with these findings, the HOMA-IR index was lower in the
(Figures 5(e), 5(f), and 5(g)). treated PD mice compared to the untreated (Figure 6(f)).
 The accumulated protein level of hepatic AKT phos-
3.3. Training, Green Coffee, and Chlorogenic Acid Mitigated phorylation was higher in samples from all the intervention
PD-Associated Changes in HFD-Fed Mice. After induction groups compared to the PD group (Figure 6(g)). This corre-
of PD, the mice were treated with training (EX), green coffee sponded to the decreased liver to total body weight ratios in
(GC), chlorogenic acid (CGA), or a combination of these the treated compared to untreated PD mice. However, this
factors (EX+GC and EX+CGA). The GC used in this study trend was statically significant in the whole group-treated
contained 50% CGA and less than 2% caffeine, as revealed animals (Figure 7(a)). PAS staining in liver sections from
8 Oxidative Medicine and Cellular Longevity

 36

 34

 Body weight (g)
 32

 30

 28

 26

 12 16 20 23
 Weeks
 PreD Ex
 GC GC-E
 CA CA-E
 (a)
 175

 10
 150
 Weight gain percentile (g)

 5 ⁎⁎⁎ ⁎⁎⁎
 FBG (mg/dL)

 125
 ⁎⁎⁎
 ⁎⁎⁎ ⁎⁎⁎
 0 100
 ⁎
 –5 ⁎⁎
 ⁎ 75

 –10 50
 PD

 GC

 CA

 Ex.GC

 Ex.CA
 PD

 GC

 CA

 Ex.GC

 Ex.CA

 Ex
 Ex

 (b) (c)
 200
 Blood glucose (mg/dL)

 150

 100

 50

 0
 0 30 60 90 120 0 30 60 90 120 0 30 60 90 120
 Time (min) Time (min) Time (min)

 PD PD PD
 GC CA EX

 3×10⁴
 200
 AUC (mg/dL × 120 min)
 Blood glucose (mg/dL)

 150
 2×10⁴ ⁎
 ⁎ ⁎
 ⁎ ⁎
 100

 1×10⁴
 50

 0 0
 0 30 60 90 120 0 30 60 90 120
 PD

 GC

 CA

 Ex

 Ex.CA

 Ex.GC

 Time (min) Time (min)
 PD PD
 Ex.GC Ex.CA

 (d)

 Figure 6: Continued.
Oxidative Medicine and Cellular Longevity 9

 3.0
 1.0
 2.5 ⁎⁎
 0.8

 Plasma insulin (ng/mL)
 ⁎⁎⁎ ⁎⁎⁎

 HOMA-IR (mmol/L)
 2.0 ⁎⁎⁎
 ⁎
 0.6 ⁎
 1.5 ⁎⁎⁎ ⁎⁎
 ⁎⁎
 0.4
 1.0 ⁎⁎

 0.5 0.2

 0.0 0.0
 PD

 GC

 CA

 Ex.GC

 Ex.CA
 Ex

 PD

 GC

 CA

 Ex.CA

 Ex.GC
 Ex
 (e) (f)

 p-AKT 60 kDa
 AKT 60 kDa
 -Actin 43 kDa
 5
 ⁎⁎

 4 ⁎⁎ ⁎⁎
 ⁎⁎
 ⁎⁎
 p-AKT/AKT

 3

 2

 1

 0
 PD

 GC

 CA

 Ex.GC

 Ex.CA
 Ex

 (g)

Figure 6: Several treatments mitigated HDF-associated metabolic changes. (a) Weight of mice in the PD, GC, CGA, EX, EX. GC, and
EX.CGA groups. (b) The final weight of mice in the PD, GC, CGA, EX, EX. GC, and EX.CGA groups compared to weights at week 12.
(c) Measurement of fasting blood glucose (FBG), (d) glucose tolerance test (GTT), and the area under the curve (AUC) in PD and all
treated groups at the end of the 22nd week. (e) Measurement of plasma insulin concentration and (f) HOMA index in PD and all treated
groups at the end of the 22nd week. (g) Immunoblot analysis of protein levels of p-AKT and total AKT in livers from PD and all treated
group mice. All values are presented as mean ± SD. ∗ = p < 0:05, ∗∗ = p < 0:01, and ∗∗∗ = p < 0:001 indicate significant statistical
differences in the treated compared to PD mice.

treated PD mice was also judged less compared to the GC or EX+CGA groups mRNA levels were decreased
controls (Figures 7(b) and 7(c)). Similarly, serum levels of (Figure 8(d)). Hepatic mRNA levels Pfkl, Gk, and Pk were
AST and ALT were decreased in all intervention groups found to trend up in PD mice regardless of the intervention
(Figures 7(d) and 7(e)). compared to the controls. However, the difference was only
 significant in the EX-treated animals (Figures 8(e) and
3.4. Training, Green Coffee, and Chlorogenic Acid Treatment 8(g)). mRNA levels of Pfkl were significantly increased in
Alter Hepatic mRNA Levels of Genes Associated with the CGA-, EX-, and EX+GC-treated groups (Figure 8(f)).
Glycogen Synthesis, Gluconeogenesis, and Glycolysis. In all
treatment groups, hepatic mRNA levels of Gys2 and levels 4. Discussion
of phosphorylated Gys2 were increased (Figures 8(a) and
8(b)) were decreased (Figure 8(b)) compared to the In the current study, the effects of training in combination
untreated PD group. mRNA levels of Pck were increased in with green coffee and chlorogenic acid in the HFD-fed PD
the EX and EX+GC-treated PD mice versus the controls mice were evaluated. To the best of our knowledge, this is
(Figure 8(c)). As well, EX was associated with increased the first published study to address this. Consistent with
hepatic G6pc2 mRNA, whereas in animals treated with the findings in people, the HFD-fed mice displayed
10 Oxidative Medicine and Cellular Longevity

 100
 5.5
 ⁎⁎⁎ ⁎⁎⁎
 80 ⁎⁎⁎
 5.0

 Liver glycogen (mg/g)
 Liver weight (%)
 ⁎⁎ ⁎ ⁎ 60 ⁎⁎
 4.5 ⁎ ⁎
 ⁎⁎⁎

 4.0 40

 3.5 20

 3.0 0
 PD

 GC

 CA

 Ex

 Ex.GC

 Ex.CA

 PD

 GC

 CA

 Ex

 Ex.GC

 Ex.CA
 (a) (b)

 PreD. GC

 500 100
 CA Ex
 400 80

 ⁎⁎⁎
 ⁎⁎
 ALT (U/L)
 300
 AST (U/L)

 60
 ⁎⁎⁎
 ⁎⁎⁎ ⁎⁎⁎ ⁎⁎⁎ ⁎⁎⁎
 200 ⁎⁎⁎ ⁎⁎⁎ 40
 Ex-GC Ex-CA ⁎⁎⁎

 100 20

 0 0
 PD

 GC

 CA

 Ex

 Ex.GC

 Ex.CA
 PD

 GC

 CA

 Ex

 Ex.GC

 Ex.CA

 (c) (d) (e)

Figure 7: GC, CGA, EX, EX. GC, and EX.CGA treatment limited HFD-associated changes in murine livers. (a) The ratio of liver to total
body weight in PD and all treated animal groups at the end of the 22nd week. (b) Quantitative assessment of hepatic glycogen in the
livers from the PD and all treated groups. (c) PAS staining of liver from PD and all treated animal groups (arrows indicate hepatic
glycogen). (d and e) Plasma levels of AST and ALT in PD and all treated groups. All values are presented as mean ± SD. ∗ = p < 0:05,
∗∗
 = p < 0:01, and ∗∗∗ = p < 0:001 indicate significant statistical differences in the treated compared to PD mice.

metabolic dysregulation including elevated FBG, insulin and ing glucose balance, glycogen accumulation, and body and
AST/ALT levels, abnormal glucose tolerance, and increased liver weight changes. This is consistent with clinical data
HOMA index. Additionally, increased liver weight, decreased that identified constant training as having an impact on
glycogen levels, and AKT phosphorylation were observed. metabolic syndrome and diabetes [27].
Furthermore, the HFD-fed mice showed disruption in In mice, HFD is an accepted means of inducing meta-
hepatic glycogen synthesis as evinced by reduced expression bolic imbalance (Xu, D., Jiang et al. in 2019, Asare-Bediako
of Gys2, increased gluconeogenesis via increased Pck and et al. in 2020 and Mu, H. N) [28–30]. EX, GC, and CGA
G6pc2, and increased glycolysis via decreased expression of independently reduce FBS and improved insulin resistance.
Gk and Pk. We found that while EX caused weight loss in the PD mice,
 Therapeutic intervention with training, green coffee, or GC and CGA alone had no effect, as we found, others
chlorogenic acid found that training was most efficacious reported that EX promoted weight loss and improvement
at resisting HDF-mediated metabolic dysregulation includ- in body composition. However, there effects of GC and
Oxidative Medicine and Cellular Longevity 11

 p-GYS2 90 kDa
 GYS2 90 kDa
 -Actin 43 kDa
 3 2.5 6
 ⁎⁎⁎ ⁎⁎⁎
 ⁎⁎ ⁎⁎ 5
 2.0 ⁎⁎ ⁎⁎
 2 ⁎⁎⁎ 4
 ⁎
 GYS2/18sRNA

 p-GYS2/GYS2

 Pck/18sRNA
 1.5 ⁎⁎
 ⁎⁎⁎ 3
 ⁎ ⁎⁎ 1.0
 1 2

 0.5 1

 0 0.0 0
 PD

 GC

 CA

 Ex.GC

 Ex.CA

 PD

 GC

 CA

 Ex.GC

 Ex.CA
 Ex

 Ex
 PD
 GC
 CA

 Ex.GC
 Ex.CA
 Ex
 (a) (b) (c)
 5
 ⁎⁎⁎ 1.5
 ⁎⁎⁎
 4
 G6pc2/18sRNA

 3 1.0
 Pk/18sRNA

 2
 0.5
 1 ⁎⁎⁎
 ⁎⁎⁎

 0 0.0
 PD

 GC

 CA

 Ex.GC

 Ex.CA
 Ex

 PD

 GC

 CA

 Ex.GC

 Ex.CA
 Ex

 (d) (e)

 8 ⁎⁎⁎ 10 ⁎⁎

 7
 8 ⁎⁎
 6
 ⁎⁎
 Gck/18sRNA
 Pfkl/18sRNA

 5 6
 4 ⁎⁎ ⁎
 ⁎
 3 4
 ⁎
 2
 2
 1

 0 0
 PD

 GC

 CA

 Ex.GC

 Ex.CA
 Ex

 PD

 GC

 CA

 Ex.GC

 Ex.CA
 Ex

 (f) (g)

Figure 8: GC, CGA, EX, EX. GC, and EX.CGA treatment alters mRNA expression of multiple metabolic genes in livers from PD mice. (a)
RT-qPCR analysis of Gys2 mRNA levels in the liver from PD and all treated animal groups. (b) Immunoblot of protein levels of p-GYS2 and
total GYS2 in the liver from PD and all treated groups. (c) RT-qPCR analysis of G6pc2 and (d) Peck mRNA in the livers from PD and all
treated animal groups. (e–g) RT-qPCR analysis for Pk, Pfkl, and Gk mRNA levels in the livers from PD and all treated groups. All values are
presented as mean ± SD. ∗ = p < 0:05,∗∗ = p < 0:01, and ∗∗∗ = p < 0:001 indicate significant statistical differences in the treated compared to
PD mice.
12 Oxidative Medicine and Cellular Longevity

CGA on weight loss are controversial [17, 20, 31–33]. It is In summary, the results of this study demonstrated that aer-
possible that variation in study design and dosages explain obic training in conjunction with green coffee lowered blood
variation in reported outcomes. glucose and mitigated metabolic changes associated with PD
 The liver controls blood glucose levels via the regulation of in mice. These data support further study looking at long-
anabolic (glycogen synthesis and gluconeogenesis) and cata- term effects with a goal of possible translational applications.
bolic (glycolysis and glycogenolysis) pathways. By activation
of PI3K-AKT signalling pathway, insulin causes progression Abbreviations
of glycogen synthesis and gluconeogenesis and inhibits glycol-
ysis and glycogenolysis. In PD and T2D, liver glycogen storage ADA: American Diabetes Association
is dysregulated. Conversion of glucose to glycogen is per- AKT: Protein kinase B
formed by GYS2. In a feedback manner, GYS2 is activated ALT: Alanine aminotransferase
by the deactivation of GSK-3 through the PI3K-AKT pathway. AST: Aspartate aminotransferase
Based on our results, the HFD feeding reduced hepatic AKT BSK: Bonyan Salamat Kasra
phosphorylation and decreased Gys2 expression. In contrast, CHA: Chlorogenic acid
several treatments were associated with increased hepatic EX: Training training
PI3K-AKT-GYS2 expression. These data were confirmed FBG: Fasting blood glucose
[34, 35]. We believe that our interventions were effective in FOXO1: Forkhead box protein O1
glycogen synthesis, which can cause glycogen to store blood G6PC2: Glucose-6-phosphatase 2
glucose in the liver (Figures 8(a) and 8(b)). Inhibition of liver GC: Green coffee
glucose production by insulin occurs, in part, via PI3K-AKT- GK: Glucokinase
mediated suppression of PCK1and G6PC2. We found that in GSK3: Glycogen synthase kinase 3
the PD group, subsequent to changes in insulin levels, the GTT: Glucose tolerance test
expressions of the gluconeogenesis-regulating factors, Pck GYS2: Glycogen synthase 2
and G6pc2, were decreased. The interactions between training H&E: Hematoxylin and eosin
and gluconeogenesis are also controversial. Some data suggest HFD: High-fat diet
increased hepatic gluconeogenesis, while others suggest HOMA: Homeostatic model assessment of insulin
decreased hepatic gluconeogenesis after training. We noted resistance
increased Pck expression after training verifying other reports. IFG: Impaired fasting glucose
[36, 37]. In the path of gluconeogenesis in training interven- IGT: Impaired glucose tolerance
tions genes involved such as G6pc2, Pck increase due to the IRS1/2: Insulin receptor substrate 1
body physiological conditions and the body’s need for energy MAV: Micro aerial vehicle
during the endurance activity with high intensity. But this PAS: Periodic acid-Schiff
increase has been enough to meet the body’s need for energy PD: Prediabetes
not to increase glucose in the blood. Decreased activity of PK PEPCK: Phosphoenolpyruvate carboxykinase
and PFK, which occurs in diabetes, may decrease glycolysis PFKL: Phosphofructokinase, liver type
and glucose consumption. Herein, we found all three enzymes PI3K: Phosphoinositide-3 kinase
were decreased in the livers from the PD mice compared to the PK: Pyruvatekinase
controls, in keeping with other reports [38–40]. Additionally, T2DM: Diabetes mellitus type 2.
all interventions led to increased expression of Gk and Pk,
although changes Pfk1 expression were found only in PD mice Data Availability
treated with the EX, EX+GC, and CGA groups. However,
there may be other potentially unknown mechanisms by Data are available on request.
which these interventions improve metabolic status in predia-
betic individuals, which requires further research. Additional Points
 The current study has a number of limitations. First, the
animal cohorts were young and PD and metabolic syndrome New & Noteworthy. (i) Training, green coffee, chlorogenic
and diabetes are largely found in mid and older age adults. acid, and the combination of training with green coffee
Second, the study tested interventions on of PD-related and chlorogenic acid can improve the symptoms and com-
changes but was not blinded in its design. While training plications of prediabetes by regulating the glycogen synthesis
would not be blinded, the other agents could have been mechanism by activating the signalling pathway of IRS1,
administered in a blinded manner. Third, the data is associa- PI3K, AKT, GSK3, and GYS2. The results were somewhat
tive and does not demonstrate a necessary link between effective. The results were so effective that blood sugar,
intervention and outcome. Fourth, the study design did not plasma insulin, and liver enzymes were in the normal range.
consider the effect of sex upon the outcomes. Additionally, (ii) Training, green coffee, and chlorogenic acid can improve
changes in tissue mRNA levels from whole organs are nei- prediabetic conditions by activating genes involved in gly-
ther cell specific nor do they show cell signalling or colysis mechanisms, such as PK, PFKL, and GK, and prevent
metabolite variation. Finally, the overall length of the study the disease from progressing to type 2 diabetes. (iii) Green
interval was brief. PD, metabolic syndrome, and diabetes coffee and a combination of training and chlorogenic acid,
are chronic conditions. by controlling the genes involved in the mechanism of
Oxidative Medicine and Cellular Longevity 13

gluconeogenesis, interfere with the activity of this signalling cise on inflammatory markers in type 2 diabetes patients: a
pathway and thus can prevent the production of glucose and systematic review of randomized controlled trials,” Oxidative
glucose accumulation in the blood. Medicine And Cellular Longevity, vol. 2017, Article ID
 8523728, 10 pages, 2017.
Ethical Approval [8] J. M. Gaitan, A. Weltman, and S. K. Malin, “Enhancing exer-
 cise responsiveness across prediabetes phenotypes by targeting
The approval of mouse usage in this study was obtained by insulin sensitivity with nutrition,” Journal of Diabetes
the Ethics Committee of Royan Institute. Research, vol. 2017, Article ID 8314852, 8 pages, 2017.
 [9] M. C. Petersen and G. I. Shulman, “Mechanisms of insulin
Conflicts of Interest action and insulin resistance,” Physiological Reviews, vol. 98,
 no. 4, pp. 2133–2223, 2018.
The authors declare that they have no conflicts of interest to [10] T. Jafari, L. Mahmoodnia, P. Tahmasebi et al., “Effect of cumin
declare. (Cuminum cyminum) essential oil supplementation on meta-
 bolic profile and serum leptin in pre-diabetic subjects: a ran-
Authors’ Contributions domized double-blind placebo-controlled clinical trial,”
 Journal of Functional Foods, vol. 47, pp. 416–422, 2018.
M.A. contributed to the study design, data collection, analy- [11] H. Kreft and W. Jetz, “Global patterns and determinants of
ses, data mining, data interpretation, and manuscript vascular plant diversity,” Proceedings of the National Academy
writing. SM.M. contributed to the study design, data collec- of Sciences, vol. 104, no. 14, pp. 5925–5930, 2007.
tion, data analysis, data interpretation, and manuscript writ- [12] A. K. Rines, K. Sharabi, C. D. J. Tavares, and P. Puigserver,
ing. K.GH. contributed to the data interpretation. Z. S. “Targeting hepatic glucose metabolism in the treatment of
contributed to the data interpretation, technical assistance, type 2 diabetes,” Nature Reviews Drug Discovery, vol. 15,
manuscript writing, and final approval of the manuscript. no. 11, pp. 786–804, 2016.
F.K. contributed to the study design and data collection. [13] M. D. Hordern, D. W. Dunstan, J. B. Prins, M. K. Baker, M. A.
S.SH. contributed to the data collection. MH.S. is the liver F. Singh, and J. S. Coombes, “Exercise prescription for patients
pathologist. P. R. contributed to the manuscript writing. with type 2 diabetes and pre-diabetes: a position statement
MH.NE. contributed to the data analysis and data interpre- from Exercise and Sport Science Australia,” Journal of Science
tation. All authors read and approved the final manuscript. and Medicine in Sport, vol. 15, no. 1, pp. 25–31, 2012.
 [14] M. C. Venables and A. E. Jeukendrup, “Endurance training
Acknowledgments and obesity: effect on substrate metabolism and insulin sensi-
 tivity,” Medicine and Science in Sports and Exercise, vol. 40,
We are highly grateful to Jeffrey Isenberg for the time dedi- no. 3, pp. 495–502, 2008.
cated for critical reading of the manuscript and to Behrouz [15] O. Nikpayam, M. Najafi, S. Ghaffari, M. A. Jafarabadi,
Salehian and Mohammad Mehrtash for general advice. G. Sohrab, and N. Roshanravan, “Effects of green coffee
 extract on fasting blood glucose, insulin concentration and
 homeostatic model assessment of insulin resistance
References (HOMA-IR): a systematic review and meta-analysis of
 [1] R. M. M. Khan, Z. Chua, J. Tan, Y. Yang, Z. Liao, and Y. Zhao, interventional studies,” Diabetology & Metabolic Syndrome,
 “From pre-diabetes to diabetes: diagnosis, treatments and vol. 11, no. 1, pp. 1–8, 2019.
 translational research,” Medicina, vol. 55, no. 9, p. 546, 2019. [16] B. Han, A. Nazary-Vannani, S. Talaei et al., “The effect of green
 [2] S. Parveen, A. A. Khan, and Q. A. Khan, “An insight of predi- coffee extract supplementation on blood pressure: a systematic
 abetes,” Journal of Pharmaceutical Research, vol. 1, no. 1, review and meta-analysis of randomized controlled trials,”
 pp. 2–8, 2020. Phytotherapy Research, vol. 33, no. 11, pp. 2918–2926, 2019.
 [3] C. P. Earnest, “Exercise interval training: an improved stimu- [17] Y. Chen, Y. Zhao, Y. Wang et al., “The influence of green coffee
 lus for improving the physiology of pre-diabetes,” Medical bean extract supplementation on blood glucose levels: a sys-
 Hypotheses, vol. 71, no. 5, pp. 752–761, 2008. tematic review and dose–response meta-analysis of random-
 [4] A. G. Tabák, C. Herder, W. Rathmann, E. J. Brunner, and ized controlled trials,” Phytotherapy Research, vol. 34, no. 9,
 M. Kivimäki, “Prediabetes: a high-risk state for diabetes devel- pp. 2159–2169, 2020.
 opment,” The Lancet, vol. 379, no. 9833, pp. 2279–2290, 2012. [18] K. Bothiraj and V. Vanitha, “Green coffee bean seed and their
 [5] A. J. Garber, Y. Handelsman, G. Grunberger et al., “Consensus role in antioxidant—a review,” International Journal of Research
 statement by the American Association of Clinical Endocri- in Pharmaceutical Sciences, vol. 11, no. 1, pp. 233–240, 2020.
 nologists and American College of Endocrinology on the com- [19] A. S. Kumar, A. G. Maiya, B. A. Shastry et al., “Exercise and
 prehensive type 2 diabetes management algorithm - _2020 insulin resistance in type 2 diabetes mellitus: a systematic
 executive summary_,” Endocrine Practice, vol. 26, no. 1, review and meta-analysis,” Annals of Physical and Rehabilita-
 pp. 107–139, 2020. tion Medicine, vol. 62, no. 2, pp. 98–103, 2019.
 [6] S. Wang, W. Ma, Z. Yuan et al., “Association between obesity [20] R. S. Delevatti, C. G. Bracht, S. D. C. Lisboa et al., “The role of
 indices and type 2 diabetes mellitus among middle-aged and aerobic training variables progression on glycemic control of
 elderly people in Jinan, China: a cross-sectional study,” BMJ patients with type 2 diabetes: a systematic review with meta-
 Open, vol. 6, no. 11, article e012742, 2016. analysis,” Sports medicine-open, vol. 5, no. 1, pp. 1–17, 2019.
 [7] L. C. Melo, J. Dativo-Medeiros, C. E. Menezes-Silva, F. T. Bar- [21] B.-K. Choi, S. B. Park, D. R. Lee et al., “Green coffee bean
 bosa, C. F. Sousa-Rodrigues, and L. A. Rabelo, “Physical exer- extract improves obesity by decreasing body fat in high-fat
14 Oxidative Medicine and Cellular Longevity

 diet-induced obese mice,” Asian Pacific Journal of Tropical [36] T. Yuan, D. Wu, K. Sun et al., “Anti-fatigue activity of aqueous
 Medicine, vol. 9, no. 7, pp. 635–643, 2016. extracts of Sonchus arvensis L. in exercise trained mice,” Mol-
[22] H. Shimoda, E. Seki, and M. Aitani, “Inhibitory effect of green ecules, vol. 24, no. 6, p. 1168, 2019.
 coffee bean extract on fat accumulation and body weight gain [37] J. G. Knudsen, R. S. Biensø, H. A. Hassing, A. H. Jakobsen, and
 in mice,” BMC Complementary and Alternative Medicine, H. Pilegaard, “Exercise-induced regulation of key factors in
 vol. 6, no. 1, pp. 1–9, 2006. substrate choice and gluconeogenesis in mouse liver,” Molecu-
[23] J.-W. Shin, I.-C. Seol, and C.-G. Son, “Interpretation of animal lar and Cellular Biochemistry, vol. 403, no. 1-2, pp. 209–217,
 dose and human equivalent dose for drug development,” The 2015.
 Journal of Korean Medicine, vol. 31, no. 3, pp. 1–7, 2010. [38] T. Jiang, X. Shuai, J. Li et al., “Protein-bound anthocyanin
[24] F. Akbarian, M. Rahmani, M. Tavalaee et al., “Effect of differ- compounds of purple sweet potato ameliorate hyperglycemia
 ent high-fat and advanced glycation end-products diets in obe- by regulating hepatic glucose metabolism in high-fat diet/
 sity and diabetes-prone C57BL/6 mice on sperm function,” streptozotocin-induced diabetic mice,” Journal of Agricultural
 International Journal of Fertility and Sterility, vol. 15, no. 3, and Food Chemistry, vol. 68, no. 6, pp. 1596–1608, 2020.
 pp. 226–233, 2021. [39] P. Ausina, D. da Silva, D. Majerowicz, P. Zancan, and M. Sola-
[25] J. P. Dougherty, D. A. Springer, and M. C. Gershengorn, “The Penna, “Insulin specifically regulates expression of liver and
 treadmill fatigue test: a simple, high-throughput assay of muscle phosphofructokinase isoforms,” Biomedicine & Phar-
 fatigue-like behavior for the mouse,” Journal of visualized macotherapy, vol. 103, pp. 228–233, 2018.
 experiments: JoVE, no. 111, 2016. [40] X. Cui, D. W. Qian, S. Jiang, E. X. Shang, Z. H. Zhu, and J. A.
[26] F. Kazeminasab, S. M. Marandi, K. Ghaedi, Z. Safaeinejad, Duan, “Scutellariae radix and coptidis rhizoma improve glu-
 F. Esfarjani, and M. H. Nasr-Esfahani, “A comparative study cose and lipid metabolism in T2DM rats via regulation of the
 on the effects of high-fat diet and endurance training on the metabolic profiling and MAPK/PI3K/Akt signaling pathway,”
 PGC-1α-FNDC5/irisin pathway in obese and nonobese male International Journal of Molecular Sciences, vol. 19, no. 11,
 C57BL/6 mice,” Applied Physiology, Nutrition, and Metabo- p. 3634, 2018.
 lism, vol. 43, no. 7, pp. 651–662, 2018.
[27] A. Meza Prambs, R. Vergara Cabezas, G. Encalada Campos,
 J. Estay Sepúlveda, J. Crespo, and C. Cabezas Caceres, “Ideal
 treatment for insulin resistance and prediabetes;? metformin
 or exercise?,” Journal of Sport and Health Research, vol. 11,
 pp. 139–154, 2019.
[28] D. Xu, Z. Jiang, Z. Sun et al., “Mitochondrial dysfunction and
 inhibition of myoblast differentiation in mice with high-fat-
 diet-induced pre-diabetes,” Journal of Cellular Physiology,
 vol. 234, no. 5, pp. 7510–7523, 2019.
[29] H.-N. Mu, Q. Zhou, R. Y. Yang et al., “Caffeic acid prevents
 non-alcoholic fatty liver disease induced by a high-fat diet
 through gut microbiota modulation in mice,” Food Research
 International, vol. 143, article 110240, 2021.
[30] B. Asare-Bediako, S. Noothi, S. Li Calzi et al., “Characterizing
 the retinal phenotype in the high-fat diet and western diet
 mouse models of prediabetes,” Cell, vol. 9, no. 2, p. 464, 2020.
[31] Z. Gorji, H. K. Varkaneh, S. talaei et al., “The effect of green-
 coffee extract supplementation on obesity: a systematic review
 and dose-response meta-analysis of randomized controlled tri-
 als,” Phytomedicine, vol. 63, article 153018, 2019.
[32] F. Nasiri-Amiri, M. Sepidarkish, M. A. Shirvani,
 P. Habibipour, and N. S. M. Tabari, “The effect of exercise
 on the prevention of gestational diabetes in obese and over-
 weight pregnant women: a systematic review and meta-analy-
 sis,” Diabetology & Metabolic Syndrome, vol. 11, no. 1, pp. 1–
 14, 2019.
[33] L. Huang, Y. Fang, and L. Tang, “Comparisons of different
 exercise interventions on glycemic control and insulin resis-
 tance in prediabetes: a network meta-analysis,” BMC Endo-
 crine Disorders, vol. 21, no. 181, pp. 1–13, 2021.
[34] J. T. Gonzalez and J. A. Betts, “Dietary sugars, exercise and
 hepatic carbohydrate metabolism,” Proceedings of the Nutri-
 tion Society, vol. 78, no. 2, pp. 246–256, 2019.
[35] J. M. Irimia, C. M. Meyer, C. L. Peper et al., “Impaired glucose
 tolerance and predisposition to the fasted state in liver glyco-
 gen synthase knock-out mice,” Journal of Biological Chemistry,
 vol. 285, no. 17, pp. 12851–12861, 2010.
You can also read