Integrated Monitoring in Bird Conservation Regions (IMBCR) for Playa Lakes Joint Venture (PLJV): 2016 - 2020 Conservation Reserve Program Report ...
←
→
Page content transcription
If your browser does not render page correctly, please read the page content below

Integrated Monitoring in Bird Conservation
 Regions (IMBCR) for Playa Lakes Joint Venture
(PLJV): 2016 - 2020 Conservation Reserve Program
 Report

 April 2021

 Bird Conservancy of the Rockies
 14500 Lark Bunting Lane
 Brighton, CO 80603
 303-659-4348
 www.birdconservancy.org

Bird Conservancy of the Rockies
 Connecting people, birds and land

Mission: Conserving birds and their habitats through science, education and land stewardship

Vision: Native bird populations are sustained in healthy ecosystems

Bird Conservancy of the Rockies conserves birds and their habitats through an integrated approach of
science, education, and land stewardship. Our work radiates from the Rockies to the Great Plains,
Mexico and beyond. Our mission is advanced through sound science, achieved through empowering
people, realized through stewardship, and sustained through partnerships. Together, we are improving
native bird populations, the land, and the lives of people.

Core Values:

 1. Science provides the foundation for effective bird conservation.
 2. Education is critical to the success of bird conservation.
 3. Stewardship of birds and their habitats is a shared responsibility.

Goals:

 1. Guide conservation action where it is needed most by conducting scientifically rigorous
 monitoring and research on birds and their habitats within the context of their full annual cycle.
 2. Inspire conservation action in people by developing relationships through community outreach
 and science-based, experiential education programs.
 3. Contribute to bird population viability and help sustain working lands by partnering with
 landowners and managers to enhance wildlife habitat.
 4. Promote conservation and inform land management decisions by disseminating scientific
 knowledge and developing tools and recommendations.

Suggested Citation:
Pavlacky, D. C., Jr., J. M. Timmer, M. F. McLaren, C. M. White, E. Chabot, and R. A. Sparks. 2021.
Integrated Monitoring in Bird Conservation Regions (IMBCR) for Playa Lakes Joint Venture (PLJV): 2016 -
2020 Conservation Reserve Program report. Bird Conservancy of the Rockies. Brighton, Colorado, USA.

Cover Photo:
Grasshopper sparrow by Alan Schmierer

Contact Information:
David Pavlacky
david.pavlacky@birdconservancy.org
Bird Conservancy of the Rockies
14500 Lark Bunting Lane
Brighton, CO 80603
970-482-1707 x11

IMBCR for PLJV: 2016 - 2020 Conservation Reserve Program Report

 Executive Summary
Bird Conservancy of the Rockies (Bird Conservancy), in conjunction with its partners, conducted landbird
monitoring for the tenth year in a row for the Integrated Monitoring in Bird Conservation Regions
(IMBCR) program. The IMBCR for Playa Lakes Joint Venture (PLJV) program is a collaborative partnership
for evaluating and implementing wildlife conservation in the Shortgrass Prairie and Central Mixed grass
Prairie Bird Conservation Regions. The partnership was designed to address management and
conservation needs of a wide range of stakeholders including private landowners, conservation
initiatives, federal agencies and state wildlife agencies. IMBCR uses a spatially balanced sampling design
which allows inferences to avian species occurrence and population sizes at various scales, from local
management units to entire Bird Conservation Regions (BCR) or states, facilitating conservation at local
and national levels. The design of the IMBCR program is based on a stratified random sample obtained
by separating the region into non-overlapping groups called strata, and then selecting a random sample
from each stratum. The sampling design allows analysts to estimate species densities, population sizes,
and occupancy rates for individual strata or biologically meaningful combinations of strata. The IMBCR
design provides a spatially consistent and flexible framework for understanding the status and annual
changes of bird populations. Collaboration across organizations and spatial scales increases sample sizes
and improves the accuracy and precision of population estimates. Analyzing the data collectively allows
us to estimate detection probabilities for species that would otherwise have insufficient numbers of
detections at local scales.

The IMBCR program is well-positioned to address the conservation and management needs of a wide
range of stakeholders due to the hierarchical design and IMBCR partnership. Population monitoring
within BCRs can be implemented with a flexible hierarchical framework of nested units, where
information on status of bird populations can be partitioned into smaller units for small-scale
conservation planning, or aggregated to support large-scale conservation efforts throughout a species’
geographic range. By focusing on scales relevant to management and conservation, information
obtained from monitoring in BCRs can be integrated into research and management at various scales
applicable to land managers. Post-stratification provides a way to stratify or group point-count plots by
a factor of interest after data collection, and estimate density for different groups, such as vegetation
types. Post-stratifying IMBCR point-count data by vegetation types and conservation practices provides
a framework for effectiveness monitoring to learn about the success of management actions. The
Conservation Reserve Program (CRP) is a voluntary program for agricultural producers administered by
Farm Service Agency providing incentives to landowners to take cropland out of production and plant it
back into grassland. The objectives of this report are to 1) evaluate avian population density on CRP
lands relative to agricultural lands and native grasslands, and 2) estimate the contributions of CRP lands
to bird populations in the PLJV region.

This report summarizes IMBCR results from 2016 through 2020 for 13 grassland priority species
identified in the PLJV Landbird Team Report (2007), including a post-stratification analysis to estimate
avian population density on CRP lands, agricultural lands and native grassland. To view interactive maps
illustrating survey and detection locations, species counts and density, population and occupancy
results, please visit Bird Conservancy’s Rocky Mountain Avian Data Center (Rocky Mountain Avian Data
Center, www.rmbo.org/v3/avian/ExploretheData.aspx, accessed 6 Jun 2018). Instructions for using the
Avian Data Center are included in Appendix A of this report and are available on the Avian Data Center
itself. Each stratum or combination of strata presented in this report's Results section contains a web
Bird Conservancy of the Rockies
Connecting people, birds and land i

IMBCR for PLJV: 2016 - 2020 Conservation Reserve Program Report

link that leads directly to the Avian Data Center with the appropriate queries already populated. Please
note that not every stratum or conceivable combination of strata are summarized in this report. All
individual strata and all biologically meaningful combinations of strata, or “superstrata”, can be found
on the Avian Data Center.

The impact-reference comparison of population density on CRP lands relative to agricultural lands
indicated large positive treatment effects for the Cassin’s sparrow (Peucaea cassinii) and grasshopper
sparrow (Ammodramus savannarum). None of the priority species showed negative treatment effects
for CRP plantings relative to agricultural land. The comparison of population density on CRP lands
relative to native grassland suggested CRP plantings provided high habitat suitability for the northern
bobwhite (Colinus virginianus), Cassin’s sparrow and grasshopper sparrow. Population densities were
similar in CRP plantings and native grassland for the scaled quail (Callipepla squamata), ring-necked
pheasant (Phasianus colchicus), common nighthawk (Chordeiles minor), long-billed curlew (Numenius
americanus), Swainson’s hawk (Buteo swainsoni), lark sparrow (Chondestes grammacus), lark bunting
(Calamospiza melanocorys), eastern meadowlark (Sturnella magna), dickcissel (Spiza americana),
suggesting habitat suitability for CRP plantings and native grassland were similar. There was some
indication of lower habitat suitability for CRP plantings relative to native grassland for the western
meadowlark (S. neglecta). Population density was greater on native grassland than agricultural land for
scaled quail, Cassin’s sparrow, grasshopper sparrow, lark sparrow, lark bunting and western
meadowlark, suggesting these species were negatively impacted by the conversion of native grassland
to agricultural land. Densities on native grassland were lower than or equal to agricultural land for the
northern bobwhite, ring-necked pheasant, common nighthawk, long-billed curlew, Swainson’s hawk
eastern meadowlark and dickcissel, suggesting these species were doing well in agricultural landscapes.
Overall, restoring grassland by planting CRP is expected to be an effective conservation strategy to
provide suitable habitat and increase the abundance of several priority grassland bird species in the
PLJV.

Avian population sizes on CRP plantings suggested large contributions to regional populations of the
grasshopper sparrow and Cassin’s sparrow. Land enrolled in the CRP grassland from 2016 through 2020
conserved breeding habitat for 1.2 million Cassin’s sparrows, 2.2 million grasshopper sparrows and
253,651 eastern meadowlarks per year. In addition, percentage population change from CRP plantings
relative to agricultural land for the Cassin’s sparrow and grasshopper sparrow exceeded the population
targets for the PLJV. Enrolling agricultural land into CRP grassland at the extent of the past 5 years is
expected to increase the populations of the Cassin’s sparrow by 1.0 M and grasshopper sparrow by 1.4
M per year. The percentage of population change relative to agricultural land met PLJV population
targets and increased populations of the northern bobwhite by 66,408, scaled quail by 23,690, lark
bunting by 242,554 and eastern meadowlark by 88,582 per year. However, the small sample size of grid
cells containing CRP plantings (n = 27) and high annual variation in abundance on CRP suggested more
years of study may needed to adequately estimate the population change for these species. Overall, the
population estimates suggested changes to land enrolled in CRP over time may have important
population consequences for declining grassland bird species in the PLJV region.

Bird Conservancy of the Rockies
Connecting people, birds and land ii
IMBCR for PLJV: 2016 - 2020 Conservation Reserve Program Report

 Acknowledgements
We thank Playa Lakes Joint Venture for building a collaborative partnership and acquiring funding across
the states within their boundary to allow for the addition of IMBCR for PLJV. Funding for surveys in the
PLJV region was provided by Colorado Parks & Wildlife; Kansas Department of Wildlife, Parks & Tourism;
Nebraska Game & Parks Commission; New Mexico Department of Game & Fish; Oklahoma Department
of Wildlife Conservation; Texas Parks & Wildlife Department; US Department of Agriculture, Farm
Service Agency (grant # AG-3151-C-16-0017); US Forest Service; Great Plains Landscape Conservation
Cooperative; and US Fish and Wildlife Service, Region 2 - Southwest Region, Migratory Bird Office. Thank
you to Rich Iovanna from the Farm Service for advice, collaboration and the development of research
questions. Bird Conservancy of the Rockies’ landowner liaison, Jenny Berven, with help from Tiffany
Peeken, contacted county assessors to determine land ownership of survey locations. We thank Paul
Lukacs of the University of Montana who wrote code in program R to automate data analysis for density
estimation. The report benefited from thoughtful reviews by Anne Bartuszevige and Rich Iovanna. We
also thank the many field technicians who collected avian and vegetation point count data and
contacted private landowners to obtain access to survey locations and establish working relationships
for the future. Without the efforts of these technicians and the cooperation of numerous private
landowners, IMBCR partners would have been unable to conduct avian monitoring on private lands.
Finally, this report benefited greatly from review by Bird Conservancy staff and IMBCR partners.

Bird Conservancy of the Rockies
Connecting people, birds and land iii
IMBCR for PLJV: 2016 - 2020 Conservation Reserve Program Report

 Table of Contents
Executive Summary............................................................................................................................ i
Acknowledgements...........................................................................................................................iii
Table of Contents ..............................................................................................................................iv
Table of Figures .................................................................................................................................v
Table of Tables................................................................................................................................. vii
Introduction ......................................................................................................................................1
Methods ............................................................................................................................................5

 Study Area ................................................................................................................................................. 5
 BCR 18: Shortgrass Prairie .................................................................................................................... 5
 BCR 19: Central Mixed-grass Prairie ..................................................................................................... 5
 Sampling Design ........................................................................................................................................ 6
 Sampling Frame and Stratification........................................................................................................ 6
 Sampling Units ...................................................................................................................................... 7
 Sample Selection................................................................................................................................... 7
 Sampling Methods .................................................................................................................................... 8
 Data Analysis ........................................................................................................................................... 10
 Distance Sampling Analysis Assumptions ........................................................................................... 10
 Distance Sampling Analysis ................................................................................................................. 11
 Automated Analysis ............................................................................................................................ 13
Results.............................................................................................................................................14

 Playa Lakes Joint Venture ....................................................................................................................... 14
 Playa Lakes Joint Venture Survey Effort 2016 - 2020 ..................................................................... 14
 Avian Density in CRP relative to Agricultural Lands and Native Grassland ........................................ 16
 Contributions to Regional Population Sizes ........................................................................................ 17
Discussion........................................................................................................................................27

 Management Implications ...................................................................................................................... 29
Literature Cited ................................................................................................................................31
Appendix A: Data Analysis................................................................................................................35

 Distance Sampling Analysis ................................................................................................................. 35
 Automated Analysis ............................................................................................................................ 37

Bird Conservancy of the Rockies
Connecting people, birds and land iv
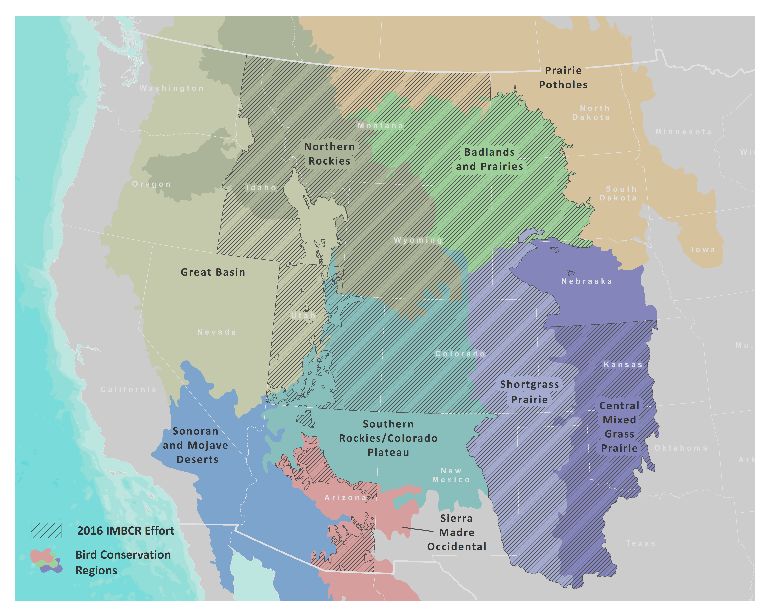
IMBCR for PLJV: 2016 - 2020 Conservation Reserve Program Report

 Table of Figures
Figure 1. Bird Conservation Regions in North America, excluding Hawaii and Mexico (US North American
Bird Conservation Initiative, www.nabci-us.org/resources/bird-conservation-regions-map, accessed 5
Jun 2018). ...................................................................................................................................................... 3
Figure 2. The spatial extent of sampled Bird Conservation Regions (BCR) using the Integrated Monitoring
in Bird Conservation Regions (IMBCR) design, 2016 - 2020. The colored regions represent the BCRs and
the hatched regions represent the area of inference for the IMBCR program. ........................................... 6
Figure 3. Example 1 km² sampling unit using the Integrated Monitoring in Bird Conservation Regions
design. ........................................................................................................................................................... 7
Figure 4. Distance sampling from the Integrated Monitoring in Bird Conservation Regions program, with
grid cells nested within strata, point count plots nested within grid cells and distances nested within
point count plots. The detection probability on the y-axis of the graph corresponds to the red-colored
line for the detection function and birds detected on the z-axis corresponds to the histogram of the
frequency of detections represented by the filled bars. ............................................................................ 11
Figure 5. Survey locations and strata in the Playa Lakes Joint Venture (PLJV) region during 2016 and
2020. The black square symbols represent the survey locations and the color coded regions represent
the strata. .................................................................................................................................................... 14
Figure 6. Annual precipitation time series in the Great Plains, 2015 - 2020. Annual precipitation is
shown in green, binomial smoothed time series is depicted by the red trend line, and the historical mean
is shown by the gray horizontal line. .......................................................................................................... 15
Figure 7. The northern bobwhite population size (million, M) in the Playa Lakes Joint Venture (PLJV)
region (A), density (km-2) on Conservation Reserve Program (CRP) plantings (B), and percentage (%) of
breeding population conserved by CRP (C), 2016 – 2020. The error bars are 90% Credible Intervals and
the blue line represents the percentage of CRP land in the PLJV region (C). ............................................. 18
Figure 8. The scaled quail population size (million, M) in the Playa Lakes Joint Venture (PLJV) region (A),
density (km-2) on Conservation Reserve Program (CRP) plantings (B), and percentage (%) of breeding
population conserved by CRP (C), 2016 – 2020. The error bars are 90% Credible Intervals and the blue
line represents the percentage of CRP land in the PLJV region (C). ........................................................... 19
Figure 9. The ring-necked pheasant population size (million, M) in the Playa Lakes Joint Venture (PLJV)
region (A), density (km-2) on Conservation Reserve Program (CRP) plantings (B), and percentage (%) of
breeding population conserved by CRP (C), 2016 – 2020. The error bars are 90% Credible Intervals and
the blue line represents the percentage of CRP land in the PLJV region (C). ............................................. 19
Figure 10. The common nighthawk population size (million, M) in the Playa Lakes Joint Venture (PLJV)
region (A), density (km-2) on Conservation Reserve Program (CRP) plantings (B), and percentage (%) of
breeding population conserved by CRP (C), 2016 – 2020. The error bars are 90% Credible Intervals and
the blue line represents the percentage of CRP land in the PLJV region (C). ............................................. 20
Figure 11. The long-billed curlew population size (thousand, K) in the Playa Lakes Joint Venture (PLJV)
region (A), density (km-2) on Conservation Reserve Program (CRP) plantings (B), and percentage (%) of
breeding population conserved by CRP (C), 2016 – 2020. The error bars are 90% Credible Intervals and
the blue line represents the percentage of CRP land in the PLJV region (C). ............................................. 21

Bird Conservancy of the Rockies
Connecting people, birds and land v
IMBCR for PLJV: 2016 - 2020 Conservation Reserve Program Report

Figure 12. The Swainson’s hawk population size (thousand, K) in the Playa Lakes Joint Venture (PLJV)
region (A), density (km-2) on Conservation Reserve Program (CRP) plantings (B), and percentage (%) of
breeding population conserved by CRP (C), 2016 – 2020. The error bars are 90% Credible Intervals and
the blue line represents the percentage of CRP land in the PLJV region (C). ............................................. 22
Figure 13. The Cassin’s sparrow population size (million, M) in the Playa Lakes Joint Venture (PLJV)
region (A), density (km-2) on Conservation Reserve Program (CRP) plantings (B), and percentage (%) of
breeding population conserved by CRP (C), 2016 – 2020. The error bars are 90% Credible Intervals and
the blue line represents the percentage of CRP land in the PLJV region (C). ............................................. 22
Figure 14. The grasshopper sparrow population size (million, M) in the Playa Lakes Joint Venture (PLJV)
region (A), density (km-2) on Conservation Reserve Program (CRP) plantings (B), and percentage (%) of
breeding population conserved by (C), 2016 – 2020. The error bars are 90% Credible Intervals and the
blue line represents the percentage of CRP land in the PLJV region (C). ................................................... 23
Figure 15. The lark sparrow population size (million, M) in the Playa Lakes Joint Venture (PLJV) region
(A), density (km-2) on Conservation Reserve Program (CRP) plantings (B), and percentage (%) of breeding
population conserved by CRP (C), 2016 – 2020. The error bars are 90% Credible Intervals and the blue
line represents the percentage of CRP land in the PLJV region (C). ........................................................... 24
Figure 16. The lark bunting population size (million, M) in the Playa Lakes Joint Venture (PLJV) region
(A), density (km-2) on Conservation Reserve Program (CRP) plantings (B), and percentage (%) of breeding
population conserved by CRP (C), 2016 – 2020. The error bars are 90% Credible Intervals and the blue
line represents the percentage of CRP land in the PLJV region (C). ........................................................... 24
Figure 17. The eastern meadowlark population size (million, M) in the Playa Lakes Joint Venture (PLJV)
region (A), density (km-2) on Conservation Reserve Program (CRP) plantings (B), and percentage (%) of
breeding population conserved by (C), 2016 – 2020. The error bars are 90% Credible Intervals and the
blue line represents the percentage of CRP land in the PLJV region (C). ................................................... 25
Figure 18. The western meadowlark population size (M) in the Playa Lakes Joint Venture (PLJV) region
(A), density (km-2) on Conservation Reserve Program (CRP) plantings (B), and percentage (%) of breeding
population conserved by CRP (C), 2016 – 2020. The error bars are 90% Credible Intervals and the blue
line represents the percentage of CRP land in the PLJV region (C). ........................................................... 26
Figure 19. The dickcissel population size (million, M) in the Playa Lakes Joint Venture (PLJV) region (A),
density (km-2) on Conservation Reserve Program (CRP) plantings (B), and percentage (%) of breeding
population conserved by (C), 2016 – 2020. The error bars are 90% Credible Intervals and the blue line
represents the percentage of CRP land in the PLJV region (C). .................................................................. 26

Bird Conservancy of the Rockies
Connecting people, birds and land vi
IMBCR for PLJV: 2016 - 2020 Conservation Reserve Program Report

 Table of Tables
Table 1. The sample sizes for the numbers of grid cells and point count plots for the post-stratification of
the Playa Lakes Joint Venture region, 2016 - 2020. ...................................................................................... 9
Table 2. The means and Standard Errors (SE) of ground and shrub cover variables for point-count plots
classified as Conservation Reserve Program (CRP) lands, native grasslands and agricultural lands, Playa
Lakes Joint Venture (PLJV) region, 2016 - 2020. ......................................................................................... 10

Bird Conservancy of the Rockies
Connecting people, birds and land vii
IMBCR for PLJV: 2016 - 2020 Conservation Reserve Program Report

 Introduction
Monitoring is an essential component of wildlife management and conservation science (Witmer 2005,
Marsh and Trenham 2008). Common goals of population monitoring are to estimate the population status
of target species and to detect changes in populations over time (Thompson et al. 1998, Sauer and Knutson
2008). In addition to providing basic information on species distributions, effective monitoring programs
can identify species that are at-risk due to small or declining populations (Dreitz et al. 2006); provide an
understanding of how management actions affect populations (Lyons et al. 2008, Schwartz et al. 2018); and
evaluate population responses to landscape alteration and climate change (Baron et al. 2008, Lindenmayer
and Likens 2009).

While monitoring at local scales remains critical, there is an increasing need to monitor the consequences
of environmental change over large spatial and temporal scales and address questions much larger than
those that can be answered within individual management units (Jones 2011, Pavlacky et al. 2017).
Reconciling disparities between the geographic scale of management actions and the scale of ecological
and species-specific responses is a persistent challenge for natural resource management agencies (Conroy
et al. 2012). Population monitoring of eco-regional landscapes provides an important context for evaluating
population change at local and regional scales, with the potential to identify causal factors and
management actions for species recovery (Manley et al. 2005, Sauer and Knutson 2008).

Before monitoring can be used by land managers to guide conservation efforts, sound program designs and
analytic methods are necessary to produce unbiased population estimates (Sauer and Knutson 2008,
Lindenmayer and Likens 2010). At the most fundamental level, reliable knowledge about the status of avian
populations requires accounting for spatial variation and incomplete detection of the target species
(Pollock et al. 2002, Rosenstock et al. 2002, Thompson 2002). Addressing spatial variation entails the use of
probabilistic sampling designs, which allow population estimates to be extended over the entire area of
interest (Thompson et al. 1998). Accounting for incomplete detection involves the use of appropriate
sampling and analytic methods to address the fact that few, if any, species are so conspicuous that they are
detected with certainty when present during a survey. Accounting for these two sources of variation
ensures observed trends reflect true population changes rather than artifacts of the sampling and
observation processes (Pollock et al. 2002, Thompson 2002).

The apparent large-scale declines of avian populations and the loss, fragmentation and degradation of
native habitats highlight the need for extensive and rigorous landbird monitoring programs (Rich et al.
2004, US NABCI Monitoring Subcommittee 2007). The US North American Bird Conservation Initiative’s
(NABCI) “Opportunities for Improving Avian Monitoring” (US NABCI Monitoring Subcommittee 2007)
provided goals for avian monitoring programs, including:

 Goal 1: Fully integrate monitoring into bird management and conservation practices and ensure
 that monitoring is aligned with management and conservation priorities.
 Goal 2: Coordinate monitoring programs among organizations and integrate them across
 spatial scales to solve conservation or management problems effectively.
 Goal 3: Increase the value of monitoring information by improving statistical design.
 Goal 4: Maintain bird population monitoring data in modern data management systems. Recognize

Bird Conservancy of the Rockies
Conserving birds and their habitats 1
IMBCR for PLJV: 2016 - 2020 Conservation Reserve Program Report

 legal, institutional, proprietary, and other constraints while still providing greater availability of
 raw data, associated metadata, and summary data for bird monitoring programs.

With the US NABCI Monitoring Subcommittee (2007) guidelines in mind, Bird Conservancy of the Rockies
and its partners initiated a broad-scale bird monitoring program in 2008, entitled “Integrated Monitoring in
Bird Conservation Regions” (IMBCR, Blakesley and Hanni 2009, Pavlacky et al. 2017). See Appendix B:
IMBCR Program and Stratification History for a complete history of this program. The monitoring objectives
of the IMBCR partnership are to:

 1. Provide robust density, population and occupancy estimates that account for incomplete detection
 and are comparable at different geographic extents;
 2. Provide long-term status and trend data for all regularly occurring breeding landbird species
 throughout the study area;
 3. Provide a design framework to spatially integrate existing bird monitoring efforts in the region to
 provide better information on distribution and abundance of breeding landbirds, especially for high
 priority species;
 4. Provide basic habitat association data for most bird species to address habitat management issues;
 5. Maintain a high-quality database that is accessible to all of our collaborators as well as to the public
 over the internet, in the form of raw and summarized data; and
 6. Generate decision support tools that help guide conservation efforts and provide a better measure
 of conservation success.

The IMBCR design uses Bird Conservation Regions (BCRs) as sampling frames (Fig. 1), stratified by land
ownership inside each BCR (US NABCI Monitoring Subcommittee 2007). BCRs provide a spatially consistent
framework for bird conservation in North America. Each BCR represents a distinct ecological region with
similar bird communities, vegetation types and resource management interests (Bird Studies Canada and
NABCI 2014). Population monitoring within BCRs can be implemented with a flexible hierarchical
framework of nested units, where information on status of bird populations can be partitioned into smaller
units for small-scale conservation planning, or aggregated to support large-scale conservation efforts
throughout a species’ geographic range. By focusing on scales relevant to management and conservation,
information obtained from monitoring in BCRs can be integrated into research and management at various
scales applicable to land managers (Conroy et al. 2012, Pavlacky et al. 2017). Post-stratification provides a
way to stratify or group point-count plots by a factor of interest after data collection, and estimate density
for different groups, such as vegetation types. The spatially balanced design of the IMBCR program
samples vegetation types in proportion to their availability within strata, and post-stratification can be used
to estimate population density for specific vegetation types (Thomas et al. 2010, Pavlacky et al. 2017).
Post-stratification often increases the precision of the density estimates (Fewster et al. 2009), and
population estimates for specific vegetation types may play a role in informing vegetation management
activities. In addition, post-stratifying by specific conservation practices provides a framework for
effectiveness monitoring to learn about the success of management actions (Lyons et al. 2008).

Important properties of the IMBCR design are:
 • All areas are available for sampling including all vegetation types;
 • Strata are based on fixed attributes, which allows us to relate changes in bird populations to
 changes on the landscape through time;
Bird Conservancy of the Rockies
Conserving birds and their habitats 2
IMBCR for PLJV: 2016 - 2020 Conservation Reserve Program Report

 • Each state’s portion of a BCR can be stratified differently, depending upon local needs and areas to
 which one wants to make inferences;
 • Aggregation of strata-wide estimates to BCR- or state-wide estimates is built into the design;
 • Local population trends are directly comparable to regional trends; and
 • Coordination among partners reduces the costs and/or increases efficiencies of monitoring per
 partner.

Figure 1. Bird Conservation Regions in North America, excluding Hawaii and Mexico (US North American
Bird Conservation Initiative, www.nabci-us.org/resources/bird-conservation-regions-map, accessed 5 Jun
2018).

Bird Conservancy of the Rockies
Conserving birds and their habitats 3
IMBCR for PLJV: 2016 - 2020 Conservation Reserve Program Report

The Playa Lakes Joint Venture (PLJV) is a collaborative partnership for evaluating and implementing wildlife
conservation in the Shortgrass Prairie and Central Mixed Grass Prairie BCRs (Bird Studies Canada and NABCI
2014). The partnership was designed to address management and conservation needs of a wide range of
stakeholders including private landowners, initiatives such as Partner’s in Flight (Carter et al. 2000), federal
agencies such as the Bureau of Land Management, Farm Service Agency, Natural Resources Conservation
Service, Forest Service, Department of Defense, and the state wildlife agencies of Colorado, Nebraska, New
Mexico, Oklahoma and Texas. Because a large percentage of the Great Plains are privately owned, the
recovery of grassland bird species depends on conservation initiatives with strong partnerships between
private landowners and resource professionals (Brennan and Kuvlesky 2005). The Conservation Reserve
Program (CRP) is a voluntary program for agricultural producers administered by Farm Service Agency
providing incentives to landowners to take cropland out of production and plant it back into grassland
(Vandever and Allen 2015). The program was designed to address a number of economic and
environmental issues affiliated with agricultural land, and although the recovery of wildlife populations
associated with agro-ecosystems was not a primary goal of the CRP, the program has become an important
tool for managing grassland birds (Vandever and Allen 2015), including species of conservation concern
such as the lesser prairie-chicken (Tympanuchus pallidicinctus, Van Pelt et al. 2013). Effectiveness
monitoring (Lyons et al. 2008) to determine the ability of the CRP for increasing populations of grassland
birds may ultimately be useful for evaluating the success of Farm Bill practices toward a program of
evidence-based conservation (Briske et al. 2017). Understanding the contribution of CRP to regional bird
populations provides the information to evaluate the success of the program for meeting conservation
objectives in the PLJV region.

We evaluated population responses of 13 priority grassland species identified in the PLJV Landbird Team
Report (2007). The objectives were to 1) evaluate avian population density on CRP grassland relative to
agricultural lands and native grasslands, and 2) estimate the contributions of CRP to bird populations in the
PLJV region. If habitat losses resulting from the conversion of grassland to cultivated land affected the
population size of grassland birds, as reported by Stanton et al. (2018), then we predicted population
densities would be greater on native grassland than agricultural land. Next, we hypothesized that CRP
plantings would show increased abundance and population density of grassland birds relative to
agricultural landscapes (Pavlacky et al. 2021). We also hypothesized that recent emphasis on planting
native CRP seed mixes would produce high habitat suitability for grassland birds (Thompson et al. 2009) and
that population densities in CRP lands would be comparable to densities on native grassland. Finally, we
hypothesized that if population densities on CRP plantings were in proportion to regional population sizes
over time, this would indicate high habitat suitability according to the ideal free distribution (Fretwell and
Lucas 1969). According to the ideal free distribution of territorial species (Fretwell and Lucas 1969),
individuals establish territories in high quality habitat first, then after high quality habitat reaches carrying
capacity, individuals establish territories in low quality habitat. When population sizes of species decline
over time, density of species are expected to decline in the low quality habitat first. Alternately, when
population sizes increase over time, density of species increase in low quality after high quality habitat
reaches carrying capacity. If CRP plantings provide high habitat suitability according to the ideal free
distribution, we predicted the percentage contribution of CRP to regional population size would be
relatively stable over the five years of study. Alternatively, we hypothesized changes in population
densities on CRP plantings disproportionate to changes in regional population size may be indicative of low
habitat suitability according to the ideal free distribution (Fretwell and Lucas 1969). If CRP plantings
provide low habitat suitability under the ideal free distribution, then we predict population densities on
Bird Conservancy of the Rockies
Conserving birds and their habitats 4
IMBCR for PLJV: 2016 - 2020 Conservation Reserve Program Report

CRP plantings will be lower than expected when population sizes are low, and high population densities on
CRP plantings are only possible when regional population sizes are high.

 Methods

Study Area
In 2016, IMBCR encompassed three entire states (Colorado, Montana and Wyoming) and portions of 10
additional states (Arizona, Idaho, Kansas, North Dakota, Nebraska, New Mexico, Oklahoma, South Dakota,
Texas and Utah); two entire USFS Regions (Regions 1 and 2) and portions of Regions 3 and 4; all of the
Badlands and Prairies BCR and almost all of the Shortgrass Prairie BCR and portions of seven additional
BCRs (Great Basin, Northern Rockies, Prairie Potholes, Southern Rockies/Colorado Plateau, Central Mixed-
grass Prairie, Sonoran and Mohave Deserts, and Sierra Madre Occidental; Fig. 2).

In 2020, the IMBCR program’s area of inference encompassed four entire states (Colorado, Montana, Utah,
and Wyoming) and portions of 12 additional states (Arizona, California, Idaho, Kansas, Nebraska, Nevada,
New Mexico, North Dakota, Oklahoma, Oregon, South Dakota, and Texas). We surveyed across US Forest
Service (USFS) Regions 1, 2, and 4 and in portions of Region 3; all of the Badlands and Prairies Bird
Conservation Region (BCR 17), all of the Shortgrass Prairie Bird Conservation Region (BCR 18), and portions
of seven other BCRs: Great Basin (9), Northern Rockies (10), Prairie Potholes (11), Sierra Nevada (15),
Southern Rockies/Colorado Plateau (16), Central Mixed Grass Prairie (19), and Sonoran and Mojave Deserts
(33) (Fig. 2).

For a map and complete descriptions of the Bird Conservation Regions, see the NABCI website (US North
American Bird Conservation Initiative, www.nabci-us.org/resources/bird-conservation-regions-map,
accessed 5 Jun 2018).

BCR 18: Shortgrass Prairie
The Shortgrass Prairie Bird Conservation Region is characterized by unique shortgrass prairie. What was
once contiguous prairie is now fragmented by agriculture and the remnant grasslands are now exposed to
new grazing regimes (PLJV 2007). Numerous playa lakes dot the region and wetlands occur along major
river corridors that drain the Rocky Mountains. Because of a change in the hydrology of these rivers, more
shrubs and trees have encroached upon the wetlands (US NABCI Committee 2000b;a). BCR 18 stretches
north-south in the rain shadow of the Rocky Mountains and covers portions of Colorado, Kansas, Nebraska,
New Mexico, Oklahoma, South Dakota, Texas, and Wyoming.

This was the ninth year we implemented IMBCR within BCR 18. In BCR 18, Bird Conservancy conducted
surveys throughout Colorado, Kansas, Nebraska, New Mexico, Oklahoma, Texas, and Wyoming. The only
portion of BCR 18 not surveyed in 2016 was the small area within South Dakota. The effort in BCR 18
comprised 37 strata covering 381,286 km².

BCR 19: Central Mixed-grass Prairie
The Central Mixed-grass Prairie Bird Conservation Region lies between shortgrass prairie to the west and
tallgrass prairie to the east (US NABCI Committee 2000b;a). This region consists of a mixture of shortgrass
and tallgrass prairie habitats, with some native and hand-planted Ponderosa Pine forests in northwestern
Bird Conservancy of the Rockies
Conserving birds and their habitats 5
IMBCR for PLJV: 2016 - 2020 Conservation Reserve Program Report

Nebraska. BCR 19 runs north-south from the southern border of South Dakota through Nebraska, Kansas,
Oklahoma, and north-central Texas.

This was the sixth year we implemented IMBCR within BCR 19. In BCR 19, Bird Conservancy conducted
surveys throughout Kansas, Oklahoma, and Texas; and within USFS lands in BCR 19 in Nebraska. The effort
in BCR 19 comprised 11 strata covering 274,583 km².

 2016

 2020

Figure 2. The spatial extent of sampled Bird Conservation Regions (BCR) using the Integrated Monitoring in
Bird Conservation Regions (IMBCR) design, 2016 - 2020. The colored regions represent the BCRs and the
hatched regions represent the area of inference for the IMBCR program.

Sampling Design
Sampling Frame and Stratification
A key component of the IMBCR design is the ability to infer across spatial scales, from small management
units, such as individual national forests or BLM field offices, to entire states and BCRs (Pavlacky et al.
2017). This is accomplished through hierarchical (nested) stratification, which allows data from smaller-
Bird Conservancy of the Rockies
Conserving birds and their habitats 6
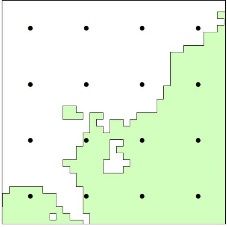
IMBCR for PLJV: 2016 - 2020 Conservation Reserve Program Report

order strata to be combined to make inferences about higher-order collections of strata. For example, data
from each individual national forest stratum in USFS Region 2 are combined to produce Region-wide avian
population estimates; data from each individual stratum in Montana are combined to produce state-wide
estimates; data from each individual stratum in BCR 17 are combined to produce BCR-wide estimates.

We defined strata based on areas to which IMBCR partners wanted to make inferences. We defined the
largest sampling frame by the intersection of state and BCR boundaries (e.g., Wyoming BCR 10). We based
the strata within the state-BCRs frame on fixed attributes such as land ownership boundaries, elevation
zones, major river systems and wilderness/roadless designations.

Sampling Units
The IMBCR design defines sampling units as 1 km² grid cells, each containing 16 evenly spaced sample
points, 250 meters apart (Fig. 3). We define potential sampling units by superimposing a uniform grid of
cells over each state in the study area. We then assign each grid cell to a stratum using ArcGIS version 10.X
and higher (ArcGIS Version 10, Environmental Systems Research Institute, Redlands, CA). For all
stratifications developed after 2012, we used the United States National Grid, a nonproprietary
alphanumeric referencing system derived from the Military Grid Reference System that was created by the
Federal Geographic Data Committee.

Figure 3. Example 1 km² sampling unit using the Integrated Monitoring in Bird Conservation Regions design.

Sample Selection
Within each stratum, the IMBCR design used generalized random-tessellation stratification (GRTS), a
spatially balanced sampling algorithm, to select sample units (Stevens and Olsen 2004). The GRTS design
has some appealing properties with respect to long-term monitoring of birds at large spatial scales:

Bird Conservancy of the Rockies
Conserving birds and their habitats 7
IMBCR for PLJV: 2016 - 2020 Conservation Reserve Program Report

 • Spatially balanced sampling is generally more efficient than simple random sampling of natural
 resources (Stevens and Olsen 2004). Incorporating information about spatial autocorrelation in the
 data can increase precision in density estimates; and
 • All sample units in the sampling frame are ordered, such that any set of consecutively numbered
 units is a spatially well-balanced sample (Stevens and Olsen 2004). In the case of fluctuating
 budgets, IMBCR partners can adjust the sampling effort among years within each stratum while still
 preserving a random, spatially balanced sampling design. In addition, the spatially-balanced
 property of the sample is maintained when access to sampling units are not possible, such as when
 private landowners deny access permission or dangerous terrain exists.

A minimum of two sampling units within each stratum are required to estimate the variances of population
parameters. However, reliable stratum-level occupancy estimates require larger samples sizes, with a
minimum of approximately 10 samples per stratum. Furthermore, additional samples may be required for
strata comprising large geographic areas. Because we estimate regional density and occupancy using an
area-weighted mean, adding more samples to a particular stratum does not bias the overall estimate, it
simply increases the precision. After the initial two sampling units were selected, the remaining allocation
of sampling effort among strata was based on the priorities of the funding partners.

Sampling Methods
IMBCR surveyors (also referred to as field technician, technician or observer in this report), with excellent
aural and visual bird identification skills, conducted field work. Prior to conducting surveys, technicians
completed an intensive training program to ensure full understanding of the field protocol; review bird and
plant identification; and practice distance estimation in a variety of habitats.

Field technicians conducted point counts (Buckland 2006) following protocols established by IMBCR
partners (Hanni et al. 2018). Observers conducted surveys in the morning, beginning one-half hour before
sunrise and concluding no later than five hours after sunrise. Technicians recorded the start time for every
point count conducted. For every bird detected during the six-minute period, observers recorded species;
sex; horizontal distance from the observer; minute; type of detection (e.g., call, song, visual); whether the
bird was thought to be a migrant; and whether the observer was able to visually identify each record.

Observers measured distances to each bird using laser rangefinders, when possible. When it was not
possible, observers estimated the distance by measuring to some object near the bird using a laser
rangefinder. In addition to recording all bird species detected in the area during point counts, observers
recorded birds flying over but not using the immediate surrounding landscape. Technicians considered all
non-independent detections of birds (i.e., flocks or pairs of conspecific birds together in close proximity) as
part of a “cluster” rather than as independent observations. Observers recorded the number of birds
detected within each cluster along with a letter code to distinguish between multiple clusters.

At the start and end of each survey, observers recorded time, ambient temperature, cloud cover,
precipitation, and wind speed. Technicians navigated to each point using hand-held Global Positioning
System units. Before beginning each six-minute count, surveyors recorded vegetation data within a 50 m
radius of the point via ocular estimation. Vegetation data included the dominant vegetation type and
relative abundance, percent cover and mean height of trees and shrubs by species, as well as grass height
and ground cover types. Technicians recorded vegetation data quietly to allow birds time to return to their
Bird Conservancy of the Rockies
Conserving birds and their habitats 8
IMBCR for PLJV: 2016 - 2020 Conservation Reserve Program Report

normal habits prior to beginning each count.

The comparison of avian population density on CRP lands relative to agricultural lands represents an impact
design-reference (Morrison et al. 2008) for estimating the effect of restoring agricultural lands to CRP lands.
The impact-reference design for the comparison of avian population density on CRP lands and native
grassland provides a way to evaluate habitat suitability of the CRP for various bird species. To evaluate the
influence of CRP lands on bird populations in the PLJV region, we post-stratified (Thomas et al. 2010) the
point count plots by three vegetation types: agricultural lands, native grassland and CRP grassland (Table 1).
The impact-reference question may be better addressed with a covariate analysis of the IMBCR data, but
comes at higher cost above and beyond the annual IMBCR analysis. Post-stratification provides a low-cost
analysis method that extends the base IMBCR program to address partner management questions related
to vegetation type. We used the primary vegetation type collected in the field through the IMBCR program
to classify the majority land cover of each point-count plot according to agricultural land and native
grassland. We defined agricultural lands as agricultural or rural land planted for food production or
ornamental purposes in sparsely developed areas (Hanni et al. 2016). We defined native grassland as
grassland vegetation types with 50% of the plots were
covered by grassland CRP types within a Geographic Information System environment (ArcGIS Version 10.1,
Environmental Systems Research Institute, Redlands, CA). We classified the IMBCR point-count plots
according to the previous year of CRP data to account for situations when CRP plantings were established
after the bird surveys were conducted in a given year.

For all years, we calculated the area of grassland CRP types (km2) within the 43 strata in the PLJV region
(Fig. 5). Overall, the area of the PLJV region was 642,782 km2. Using the CLU data from 2016 through 2020,
active contacts for grassland CRP types comprised 4.8% of the PLJV Region in 2016 (31,078 km2), 4.6% in
2017 (29,407 km2), 4.6% in 2018 (29,868 km2), 4.0% in 2019 (25,736 km2) and 4.1% of the Region in 2020
(26,191 km2).

Table 1. The sample sizes for the numbers of grid cells and point count plots for the post-stratification of
the Playa Lakes Joint Venture region, 2016 - 2020.
 CRP Grassland Agricultural land
 Year
 Grid Point Grid Point Grid Point
 2016 24 142 202 1,332 105 570
 2017 26 132 222 1,469 105 538
 2018 29 157 217 1,374 129 668
 2019 39 123 136 906 95 508
 2020 18 111 122 942 74 455

We calculated weighted means and Standard Errors (SE) of ground and shrub cover variables for the
vegetation types across years according to the area of the vegetation types in each of the PLJV strata (Table
2). We tested for differences between the vegetation variable means i by calculating effect sizes (θ� i ) using
the difference θ� i = x�CRPi − x�Refi , where x�CRPi is the mean of vegetation variable i for CRP lands and x�Refi is the
mean of vegetation variable i for the reference category. We calculated the SE and 95% Confidence
Intervals (CI) for the effect size using the delta method (Powell 2007) to evaluate statistical support for the
Bird Conservancy of the Rockies
Conserving birds and their habitats 9
IMBCR for PLJV: 2016 - 2020 Conservation Reserve Program Report

effect sizes. We found that live grass ground cover [θ� = -5.93; SE = 0.82; CI = -7.54, -4.32], shrub canopy
cover [θ� = -0.96; SE = 0.12; CI = -1.19, -0.73] and shrub height [θ� = -0.21; SE = 0.01; CI = -0.23, -0.18] were
lower on CRP lands than native grasslands. In contrast, live grass height [θ� = 7.23; SE = 0.65; CI = 5.95,
8.51], residual grass height [θ� = 7.61; SE = 0.92; CI = 5.79, 9.42], herbaceous ground cover [θ� = 3.42; SE =
0.39; CI = 2.65, 4.20] and bare-litter ground cover [θ� = 3.19; SE = 0.86; CI = 1.50, 4.89] were greater on CRP
lands than native grasslands (Table 2). There was no difference between residual grass ground cover for
CRP and native grassland (Table 2). Live grass height [θ� = -5.45; SE = 1.19; CI = -7.80, -3.11], bare-litter
ground cover [θ� = -10.27; SE = 1.04; CI = -12.31, -8.24] and shrub height [θ� = -0.50; SE = 0.02; CI = -0.54, -
0.46] were lower on CRP lands than agricultural lands. Conversely, residual grass ground cover [θ� = 5.64; SE
= 0.53; CI = 4.60, 6.68], residual grass height [θ� = 7.40; SE = 1.08; CI = 5.28, 9.53], herbaceous ground cover
[θ� = 3.02; SE = 0.53; CI = 1.98, 4.06] and shrub canopy cover [θ� = 0.82; SE = 0.10; CI = 0.62, 1.02] were
greater on CRP lands than agricultural reference lands (Table 2). Live grass ground cover on CRP and
agricultural lands were not considerably different (Table 2).

For more detailed information about survey methods and vegetation data collection protocols, refer to Bird
Conservancy’s Field Protocol for Spatially Balanced Sampling of Landbird Populations on our Avian Data
Center (Rocky Mountain Avian Data Center, www.rmbo.org/v3/avian/ExploretheData.aspx, accessed 5 June
2018). There you will find links to past and current protocols and data sheets.

Table 2. The means and Standard Errors (SE) of ground and shrub cover variables for point-count plots
classified as Conservation Reserve Program (CRP) lands, native grasslands and agricultural lands, Playa
Lakes Joint Venture (PLJV) region, 2016 - 2020.
 CRP lands Native grasslands Agricultural lands
 Vegetation variables
 Mean SE Mean SE Mean SE
 Live grass ground cover (%) 14.79 0.73 20.72 0.37 13.58 0.66
 Live grass height (cm) 27.35 0.53 20.12 0.37 32.80 1.07
 Residual grass ground cover (%) 8.98 0.42 8.44 0.18 3.34 0.32
 Residual grass height (cm) 40.30 0.66 32.70 0.64 32.90 0.86
 Herbaceous ground cover (%) 8.18 0.36 4.76 0.16 5.16 0.39
 Bare-litter ground cover (%) 67.33 0.75 64.14 0.42 77.61 0.71
 Shrub canopy cover (%) 1.09 0.09 2.05 0.07 0.27 0.04
 Shrub height (m) 0.54 0.01 0.75 0.01 1.04 0.02

Data Analysis
Distance Sampling Analysis Assumptions
Distance sampling theory was developed to account for the decreasing probability of detecting an object of
interest (e.g., a bird) with increasing distance from the observer to the object (Buckland et al. 2001). The
detection probability is used to adjust the count of birds to account for birds that were present but
undetected. Application of distance sampling theory requires that five critical assumptions be met: 1) all
birds at and near the sampling location (distance = 0) are detected; 2) distances to birds are measured
accurately; 3) birds do not move in response to the observer’s presence (Buckland et al. 2001, Thomas et al.
2010); 4) cluster sizes are recorded without error; and 5) the sampling units are representative of the entire
survey region (Buckland et al. 2008).

Bird Conservancy of the Rockies
Conserving birds and their habitats 10
IMBCR for PLJV: 2016 - 2020 Conservation Reserve Program Report

Distance Sampling Analysis
We developed a Bayesian, zero-inflated N-mixture model (Royle 2004, Sillett et al. 2011) to estimate
density and abundance for all strata and biologically meaningful combinations of strata (superstrata) across
all species with sufficient data. We used distance sampling to estimate detection probabilities and adjust
counts accordingly. For a detailed description of statistical analyses performed, see (Appendix A).

Bayesian approaches to density estimation provide several benefits over traditional distance sampling
analyses, while providing similar and unbiased estimates of density and abundance. First, with the nested
design of IMBCR, point count locations within a 1-km2 grid cell are not independent (Fig. 4). Therefore, with
traditional methods, it is necessary to treat each point as a spatial replicate within the grid cell (i.e., average
counts across points). However, it is unlikely that bird densities are uniform within a grid cell, and a better
solution would be to estimate density at the point count location. Bayesian models provide the flexibility to
do this, while correctly accounting for the lack of independence among points. The second benefit, also
provided by this flexibility, is the ability to include covariates to explain changes in density. This allows us to
explicitly estimate the response of bird density to variables, such as habitat variables, management actions,
or time (i.e., trend). Finally, Bayesian approaches allow for sharing of information across parameters. This
can assist in obtaining estimates at sites with little data or provide measures of uncertainty when no birds
were detected, such as at low densities and/or small sample sizes.

 5 km
 1.00 20

 0.80
 Detection Probability

 16

 Birds Detected
 0.60 12

 0.40 8

 0.20 4
 1 km
 0.00 0
 0 10 20 30 40 50 60 70 80 90 100
 Distance from Observer (m)

Figure 4. Distance sampling from the Integrated Monitoring in Bird Conservation Regions program, with
grid cells nested within strata, point count plots nested within grid cells and distances nested within point
count plots. The detection probability on the y-axis of the graph corresponds to the red-colored line for the
detection function and birds detected on the z-axis corresponds to the histogram of the frequency of
detections represented by the filled bars.

We fit a series of models to the data from each species that had the same model structure describing
density estimation but varied in detection structure (see Observation process section below). We used zero-
inflation to account for excess zeros in the data, where abundance at a point count location (N) is
conditional on the point’s true occupancy state (z) of a species at the point count location, and the mean
abundance within a 1-km2 grid cell was modeled as a function of year to estimate stratum-specific trends.
All points within a grid cell shared a mean abundance to account for the lack of independence of those
Bird Conservancy of the Rockies
Conserving birds and their habitats 11
You can also read