INTEGRATION AND TRANSMISSION OF LOCAL GRANULATED SUGAR PRICES BETWEEN SURPLUS AND DEFICIT AREAS
←
→
Page content transcription
If your browser does not render page correctly, please read the page content below

Journal of Legal, Ethical and Regulatory Issues Volume 24, Special Issue 1, 2021

 INTEGRATION AND TRANSMISSION OF LOCAL
 GRANULATED SUGAR PRICES BETWEEN SURPLUS
 AND DEFICIT AREAS
 Doppy Roy Nendissa, Nusa Cendana University
 Worakamol Wisetsri, King Mongkut’s University of Technology North
 Bangkok (KMUTNB)
 Noor rizkiyah, Antakusuma University
 Jeky Melkianus Sui, Morotai Pacific University
 Marthen r. Pellokila, Nusa Cendana University
 Evi Feronika Elbaar, University of Palangka Raya
 ABSTRACT

 The imbalance of supply and demand for sugar can be a threat to regions that only rely
on supplies of outside their region such as East Nusa Tenggara (NTT), Indonesia. Study
examines the market integration and transmission speed of local sugar prices spatially between
prices in East Java and prices in NTT. Using time series monthly price for the period of July
2016 until January 2020. Using the integration analysis from Granger and Johansen and the
VECM approach for the price transmission rate test. The result shows that the relationship
between the price of sugar in East Java and NTT only has a unidirectional relationship. The
price of sugar in East Java affects the price of sugar in NTT, but not the other way around. Price
changes that occur are not transmitted immediately. Price response occurs very slowly to
change. The condition of marketing infrastructure, transportation and asymmetric price
information becomes an obstacle to price integration and transmission. It is necessary to
improve infrastructure and openness of markets and prices in a transparent manner among
market players.

Keywords: Local granulated sugar, market integration, price transmission, VECM

 INTRODUCTION
 Sugar is the most strategic food commodity in Indonesia after rice, as one of the
determinants of inflation. The need for granulated sugar for industrial raw materials as well as
for household consumption will continue to increase in line with population growth and on-going
develop industrial. The balance of sugar demand in Indonesia and sugar production according to
the International Sugar Organization (ISO) is still experiencing a deficit of 2.7 million tons, as
reported by Wiyono (2020), which mean that more than half of the need for sugar that must be
imported.
 In 2020, it is estimated that Indonesia will experience a shortage of granulated sugar
production because in 2018 and 2019 there was a decrease in sugarcane production due to
drought. Sugarcane is the main raw material for local granulated sugar production. As, it
predicted by the Ministry of Agriculture, it is estimated that in 2020 Indonesia will experience a
decrease in sugar production by 10%. If this prediction happens, at 2020, Indonesia will

Business Ethics and Regulatory Compliance 1 1544-0044-24-S1-20
Journal of Legal, Ethical and Regulatory Issues Volume 24, Special Issue 1, 2021

experience scarcity of local sugar availability, so that there is an opportunity for an increase in
prices due to an imbalance in supply and demand.
 The availability of local sugar also physically and economically the ease of access in each
region and at any time from consumers in obtaining local sugar. Physical access means
convenience access to local sugar, while economic access is related to people's purchasing
power. Meanwhile, the inadequate structure of trade flows due to infrastructure and distances
between regions as well as the oligopolistic local sugar market structure causes disparity and
price fluctuation between large regions. Ideally, if there are two markets, or spatially, the price
that changes in one market are responded quickly by the other markets efficiently so that the Law
of One Price (LOP) can be applied. This is in line with the point of views from Ravallion (1986),
Goodwin and Schroeder (1991), McNew (1996), Gitau & Meyer (2018), Fuje (2029), Salazar, et
al., (2019).
 The sugar trade in Indonesia involves several marketing agencies. Generally, the
distribution chain for sugar trading in Indonesia is relatively long. Each region or province has a
different food commodity distribution chain length. It depends on the number of institutions that
involved. Each marketing agency in each region has an opportunity and strategy in a competition
to seize profits by taking a large Margin of Trade and Transportation (MTT). An efficient market
for each marketing institution receives a proportional, fair and well-integrated MTT. An efficient
market is an integrated market, which means that any price changes that occur in a market are
transmitted quickly to the next market. The spatially symmetrical flow of information on price
changes between the two market players is the main trigger for integration and price transmission
between them.
 Several factors that influence market integration are border policies, price support
mechanisms, transfer costs, exchange rates and market structure (Zorya et al., 2014; Ozturk 2020;
Zalzar et al., 2020, Özdemir et al., 2020; Guo et al. ., 2020; Gutema., 2020; Zhang et al., 2020).
The price support policy by the government by applying the Highest Retail Price (HRP) and the
lowest price will provide certainty in pricing by market players. Transfer costs that are large
enough due to the distance between the distribution locations that are far away, also the trading
infrastructure is not sufficient. Large transfer fees and MTTs can hinder price transmission.
Indonesia, as an archipelagic country, one of the main obstacles is the distribution of goods and
has weak port infrastructure as a result of high transfer costs. As happened between the local
sugar trade between the provinces of East Java and East Nusa Tenggara. The exchange rate is one
of important factor in market integration, because in the event of an import of granulated sugar
due to a shortage of supplies, at the same time when there is a depreciation of the local currency
against the dollar, it can hinders integration and price transmission. Market structures that are not
perfectly competitive and concentrated on oligopolists will hinder integration and price
transmission. The focus of this research is to observe the spatial integration of the market and the
transmission of local granulated sugar prices between the East Java market as a surplus area and
the NTT market as a deficit area (not a sugar producing area).
 Research about market integration and price transmission for several food commodities are
using various methods of approach has been widely carried out. Research conducted by
Koutroumanidis, et al. (2009) was using the co-graded approach, Granger causality and ECM, the
LSE - Henry general to specific model (GETS model), found that there is a long-term
relationship between producers and consumers in the roundwood market in Greece. Granger
causality analysis finds that consumer prices lead to producer prices. No causal relationship was
found. The application of the GETS model found asymmetry in the price transmission
Business Ethics and Regulatory Compliance 2 1544-0044-24-S1-20
Journal of Legal, Ethical and Regulatory Issues Volume 24, Special Issue 1, 2021

mechanism in the roundwood market in Greece. Chen & Saghaian's (2016) investigation of
market integration and asymmetric price transmission by testing the monthly prices of export rice
for Thailand, Vietnam, and the United States, using the Johansen cointegration test and the
VECM test. To sum up, the world rice export market is integrated and the policies that need to be
taken by the government. Other studies by Meyer & Von Cramon-Taubadel (2004), Chaudhary,
et al. (2019), Zungo, et al. (2019), Zanin, et al. (2020), Ozturk, (2020), Huang & Xiong, (2020),
Guo & Tanaka (2020), Zavale & da Cruz Macamo (2020), Roman (2020), Hao & Nye (2020),
Bouchard (2020), Mulyana & Lastinawati (2020), Ahmed & Huo (2020) measure the integration
of various markets and price transmission, using a cointegration approach , causality and VECM
to measure whether there are price transmissions between markets. The research yields varying
results depending on the commodity and the determinants of price integration and transmission.
Research on market integration and spatial price transmission between two regions as a producer
area (surplus) and a region as a consumer (deficit), namely East Java and NTT, is found not much
in the literature. Another thing that is interesting from this research is that NTT as an archipelago,
constraints on transportation and trade infrastructure, which cannot be ignored in terms of market
integration and price transmission. With the result that there is an asymmetric price and
information in the market sugar marketing system between the surplus and deficit areas.
 The purpose of this study is to measure whether there is an integration of the local
granulated sugar market between markets in East Java and NTT and the form of transmission of
local sugar prices in East Java and NTT. The results contribute to market players and
government in determining the right strategy in order to avoid risk and achieve marketing
efficiency.
 RESEARCH METHODS
 This study uses monthly price data for local granulated sugar for the period of July 2016 till
January 2020 in the East Java and in NTT province, from strategic food price information
published in collaboration between BI and the Indonesian government. This study uses an
integration analysis approach and a VAR-VECM approach. The process that is followed in the
analysis of integration and price transmission goes through several stages, namely:

Data Stationarity Test

 Data stationarity is tested to avoid spurious regression, because time series data are often not
stationary. Makridakis, et al., (1999) stated that a series of data observations is called stationary
if the process does not change with changing time. Data are not stationary if the mean, variance
and covariance of the data are constant over time (Thomas, 1998). The data stationarity test is at
a level or different by observing the ADF value, namely the variance is small, tends to be close
to the average value (Nendissa et al, 2018; Enders, 1995)
 The ADF test is used to observe whether there is a trend in sugar price movements, and is
formulated as follows:

 ∆Pt = 0 + 1Pt−1 + I ∑I=1
 m ∆P
 t−1 + it

Which:
Pt = Sugar prices in both markets in period (RP/Kg)
Pt−1 = Price of sugar in both markets in the previous period (Rp/Kg)
∆Pt = Pt − Pt−1

Business Ethics and Regulatory Compliance 3 1544-0044-24-S1-20
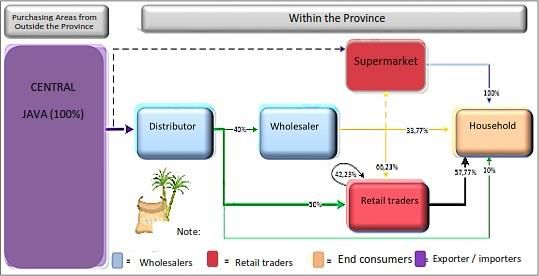
Journal of Legal, Ethical and Regulatory Issues Volume 24, Special Issue 1, 2021

 FIGURE 5
 SUGAR OF TRADE DISTRIBUTION PATTERN IN EAST JAVA, (BPS '2020)
 The local granulated sugar traded distribution pattern in NTT involves several marketing
agencies, which are distributors and retailers to the final consumer, as shown in Figure 6.
Distributors sell most of their local granulated sugar to retailers and the rest of it to households.
Afterwards, the retailer sells most of the sugar back to the household.

 FIGURE 6
 SUGAR TRADE DISTRIBUTION PATTERN IN NTT, (BPS '2020)

Market Integration and Local Quality Sugar Prices Transmission
 Analysing the integration of the local sugar market among East Java and NTT by using
time series data requires several test stages. The stationarity test uses the Augmented Dickey-
Fuller (ADF) test, since generally time series data are not stationary. Hereinafter, the
cointegration test and the Granger causality test. Followed by the VECM test to see the price
transmission level that occurs among the two markets spatially.
 Data Stationarity Test
 The stationarity test result that based on ADF test showed that stationary data at 1st
 difference level, that shown in table 1
Source: Monthly analysis price data result for local sugar in East Java and NTT for the period
 July 2016 till February 2020).

Business Ethics and Regulatory Compliance 7 1544-0044-24-S1-20
Journal of Legal, Ethical and Regulatory Issues Volume 24, Special Issue 1, 2021

 Table 1
 DATA STATIONARITY TEST
 Unit Root Test
 Variable Level 1st Difference Status
 ADF Prob ADF Prob
 East Java -1.52752 0.5096 -6.47724 0.0000** Stationary
 NTT -3.5569 0.0112* -4.73985 0.0004** Stationary

Source: Monthly analysis price data result for local sugar in East Java and NTT for the period
 July 2016 till February 2020).
 The stationarity test result in table 1 that based on the ADF test value shows that the
local sugar price variable in NTT is stationary at the level, while the East Java variable is
stationary in the first difference condition. An existence of non-stationarity variable indicates a
long-term cointegration between price variables. A cointegration test is necesary to ensure the
existence of long-term relationship between the existing price variables.

Cointegeration Test
 Prior to the cointegration test, lag length which has to be done, was determined for
estimating the VAR or Vector Autoregression mode (Gujarati & Porter, 2012; Basuki &
Prawoto, 2017). Estimating by using VAR requires data to be stationary. The variable data is at
stationary status in the 1st Difference level, so the estimation is expected to produce a valid
model output. VAR model estimation begins with determining the appropriate lag length.
Determination of the optimal lag is done by determining the smallest AIC value.

 Table 2
 RESULTS OF THE OPTIMAL LAG DETERMINATION TEST
 Lag LogL LR FPE AIC SC HQ
 -
 0 NA 1.76e+09 26.96593 27.05390 26.99663
 483.3867
 -
 1 22.94426 1.10e+09 26.49287 26.75679* 26.58498
 470.8717
 -
 2 7.940404 1.07e+09 26.45895 26.89882 26.61248
 466.2611
 -
 3 11.91840* 8.88e+08* 26.27019* 26.88601 26.48513*
 458.8635
 4 -456.961 2.853709 1.01e+09 26.38672 27.17848 26.66307
 -
 5 1.980264 1.19e+09 26.52973 27.49744 26.86749
 455.5352

 The result of the lag length test in VAR by adding AIC shows that the optimal lag length
is lag 3 with an AIC value of 26.27019 *.

 Based on the lag length above, by using the Johansen's Cointegration Test method for the
cointegration test. The results of the cointegration test are presented in

Business Ethics and Regulatory Compliance 8 1544-0044-24-S1-20
Journal of Legal, Ethical and Regulatory Issues Volume 24, Special Issue 1, 2021

 Table 3
 JOHANSEN COINTEGRATION TEST AMONG MARKETS IN EAST
 JAVA AND EAST NUSA TENGGARA

 Hypothesized Trace 0.05 Critical
 Eigenvalue Prob.**
 No. of CE(s) Statistic Value

 None * 0.473011 30.24468 15.49471 0.0002
 At most 1 * 0.162093 6.543361 3.841466 0.0105
 Source: Data Sekunder Diolah, 2020 Error rate (α)=0,05

 Table 3 shows that the market price of local granulated sugar in East Java and NTT has
cointegration in the long-term, showed by the value of Trace Statistic >> Critical Value with a
significance level of
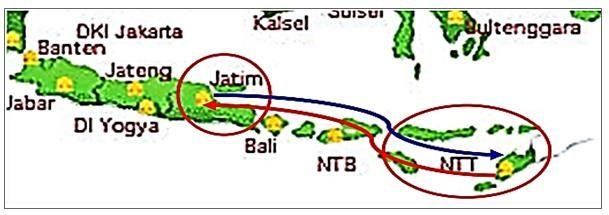
Journal of Legal, Ethical and Regulatory Issues Volume 24, Special Issue 1, 2021

 FIGURE 7
 LOCAL SUGAR TRADE DISTRIBUTION MAP BETWEEN EAST JAVA AND NTT
NTT province as a deficit area of sugar is more sensitive against price changes if there is a
disruption in supply and demand that compared to East Java as a supply and surplus area.

Vector Autoregression Test (VAR-VECM)
 The VAR test is intended because the non-stationary data has been derived based on the
optimal lag, namely the optimal lag 3. The cointegration test variable data shows that there is no
cointegration between all sugar price variables in both markets, this indicates that there is no
relationship or there is no balance in the market East Java and East Nusa Tenggara for the long
term. However, in the short term there is a possibility of integration, so it is necessary to apply a
VAR / VARD test approach. The VAR / VARD test results are shown in Table 5.

 Table 5
 VAR TEST THROUGH VARD TEST, TOOK LOCATION AT EAST JAVA
 AND EAST NUSA TENGGARA MARKETS
 D(JAWA_TIMUR) D(NTT)
 D(JAWA_TIMUR(-
 0.508937** 0.579902**
 1))
 (0.15935) (0.11235)
 ( 3.19380) ( 5.16152)
 D(JAWA_TIMUR(-
 -0.24649 -0.147464
 2))
 (0.20312) (0.14321)
 (-1.21353) (-1.02972)
 D(JAWA_TIMUR(-
 -0.341267 0.228060
 3))
 (0.17095) (0.12053)
 (-1.99626) ( 1.89213)
 D(NTT(-1)) 0.057257 0.143766
 (0.24280) (0.17119)
 ( 0.23582) ( 0.83983)
 D(NTT(-2)) 0.667241** -0.336208
 (0.23031) (0.16238)
 ( 2.89719) (-2.07054)
 D(NTT(-3)) -0.059576 -0.137241
 (0.14269) (0.10061)
 (-0.41751) (-1.36415)

 Source: Data Sekunder Diolah 2020.
 T-table error rate 5%=2.02809
Business Ethics and Regulatory Compliance 10 1544-0044-24-S1-20
Journal of Legal, Ethical and Regulatory Issues Volume 24, Special Issue 1, 2021

 The estimation results based on the VARD model in Table 5 show that in the short term,
there are some changes in local sugar prices in East Java that are significantly influenced by the
sugar price in the East Java market one month earlier, amounting to 0.5089 and also by the local
sugar price in NTT for one month previously amounted to 0.5799. This value indicates that, each
1% increase in the price of local granulated sugar in East Java in the previous month, it will
increase the price of sugar in the East Java market itself and the NTT market in the current
period by 0.5089% and 0.5799%, respectively. Meanwhile, the local sugar price in the NTT
market was significantly influenced by the local sugar price in the East Java market two months
earlier, which was 0.667. This value indicates that every 1% increase in the price of granulated
sugar in NTT in the previous two months, there will be an increase in the price of local sugar in
East Java by 0.667%.
Vector Error Correction Model Test (VECM)
 The VECM test results in Table 6, show that the ECT on the local sugar price in NTT is
significant at the 5% error level, which is 1.1792 (4.20309>2.03011). while the ECT value for
the East Java market was not significant at the 5% error level, namely -0.402522 (-0.91179
Journal of Legal, Ethical and Regulatory Issues Volume 24, Special Issue 1, 2021

 (0.41417) (0.26320)
 ( 0.83100) ( 1.96220)
 D(NTT(-3),2) -0.170053 0.066260
 (0.16028) (0.10186)
 (-1.06095) ( 0.65050)
 C 8.604741 10.88641
 (35.6636) (22.6642)
 ( 0.24128) ( 0.48034)
 R-squared 0.428278 0.684300
 Adj. R-squared 0.290276 0.608097
 Sum sq. resids 1298273. 524317.2
 S.E. equation 211.5846 134.4615
 F-statistic 3.103419 8.979929
 Log likelihood -246.1148 -229.341
 Akaike AIC 13.73594 12.82924
 Schwarz SC 14.08424 13.17755
 Mean dependent 6.756757 6.756757
 S.D. dependent 251.1535 214.7874
 Determinant resid covariance
 6.73E+08
 (dof adj.)
 Determinant resid covariance 4.13E+08
 Log likelihood -472.0421
 Akaike information criterion 26.48876
 Schwarz criterion 27.27245
Source: Data Sekunder Diolah 2020. T-table error rate5%=2.03011

 Table 6 shows that changes in the granulated sugar price are influenced by the long-term
relationship between the East Java market and the NTT market. The local sugar prices formation
in NTT was significantly affected at the 5% level by the price in East Java in the previous month.
The effect is 0.5156. This indicates that the previous price in East Java was used as a reference in
determining or forming local sugar prices in NTT. If there is an increase of 1% in the sugar price
in East Java in the previous two months, NTT will respond negatively by reducing the sugar price
by 0.5156% in the current period. This indicates that the local granulated sugar price is very
much determined by the price at the consumer level where if there is a price change at the
consumer level, the producer will respond (price changes from downstream to upstream).
Meanwhile, the local sugar price in NTT was influenced by the price in NTT itself one month
earlier, which was 0.7607. If there is an increase of 1% in the local sugar price in NTT in the
previous month, the local sugar price in NTT will respond positively by increasing the price by
0.7607% in the current period.
 Price transmission analysis using the ECM method. A positive ECT indicates a condition
of deviation above its long-term balance line, while a negative ECT indicates a deviation
condition below its long-term balance line. Nonetheless, Meyer & von Cramon-Taubadel (2004),
Ahmed & Hueo (2020), Alam & Jha (2020), Ben Abdallah, et al., (2020), Bittmann, et al.,

Business Ethics and Regulatory Compliance 12 1544-0044-24-S1-20
Journal of Legal, Ethical and Regulatory Issues Volume 24, Special Issue 1, 2021

(2020), states that price transmission analysis using ECM can only describe asymmetric patterns
in terms of adjustment time because the analysis of cointegration and ECM is a form of long-
term balance, so that if asymmetric price transmission occurs in terms of the amount of
adjustment, the data will not be co-integrated. Zanin, et al., (2020), used the ECM approach to
measure the asymmetric price rice commodities transmission in Brazil, for 3 relationships,
namely producer-retail, industry-producer and industry-retail. The ECM results occur
contemporary asymmetry between industry-retail, asymmetric effects of being left behind and
occur asymmetric contemporary and lagging producer-industry. Zungo & Kilima (2019) used
ECM to see the causal relation among maize and rice prices in Tanzania. The result was found
that there is a two-way causality in the long run between the two commodities (corn and rice).
Furthermore, he stated that the effect of infrastructure and transportation improvements in
reducing price transmission. The Ozturk study (2020) measures price transmission in the grain
market in Turkey using the ECM of the Turkish rice market which is not cointegrated with the
world rice market, while other commodity markets are weakly cointegrated. The results also
show that the transmission of world price changes to domestic prices is relatively low in both the
short and long run, and that adjustment to new equilibrium aftershocks is slow. Government
intervention policies both at the border and due to domestic price support appear to be the cause
of weak cointegration.
 CONCLUSION
 Sugar prices in East Java and NTT are moving unidirectional, but their movements are
asymmetric. Prices in East Java affect prices in NTT but not the other way around. Price changes
in East Java were not responded to immediately by the market in NTT but the changes took
several weeks, possibly due to asymmetries of information and prices. The constraints of limited
trade infrastructure and an inadequate goods transportation system are possible causes of
asymmetry. Infrastructure improvements, transportation and price transparency policies are the
most important parts to do.
 REFERENCES
Ahmed, A.D., & Huo, R. (2020). Volatility transmissions across international oil market, commodity futures and
 stock markets: Empirical evidence from China. Energy Economics, (93), 104741.
Alam, M.J., & Jha, R. (2020). Vertical price transmission in wheat and flour markets in Bangladesh: An application
 of asymmetric threshold model. Journal of the Asia Pacific Economy, 1-23.
Abdallah, M.B, Farkas, M.F, & Lakner, Z. (2020). Analysis of dairy product price transmission in hungary: A
 nonlinear ARDL model. Agriculture, 10(6), 217.
Basuki, A.T., dan Prawoto, N. (2017). Analisisi regresi, dalam Penelitian Ekonomi dan Bisnis (Dilengkapi Aplikasi
 SPSS & EVIEWS). Cetakan ke-2. Penerbit Rajawali Pers, Jakarta.
Bittmann, T., Bronnmann, J., & Gordon, D.V. (2020). Product differentiation and dynamics of cost pass-through in
 the German fish market: An error-correction-distance measure approach. Journal of Commodity Markets, 19,
 100105.
BPS. (2020). Margin Perdagangan dan Pengangkutan (MPP) Komoditas Gula Pasir Menurut Provinsi 2017-2018.
 Diakses 16 Agustur 2020.
Bouchard, D.D. (2020). Essays in agricultural economics: Crop insurance, vertical price Transmission, and Spatial
 Market Integration.
Chaudhary, B., Morales, L.E., & Villano, R. (2019). Rice price transmission between wholesalers and retailers in the
 philippines. Are Prices Integrated in Local Markets?
Chen, B., & Saghaian, S. (2016). Market integration and price transmission in the world rice export markets.
 Journal of Agricultural and Resource Economics, 444-457.
Fuje, H. (2019). Fossil fuel subsidy reforms, spatial market integration, and welfare: Evidence from a natural
 experiment in ethiopia. American Journal of Agricultural Economics, 101(1), 270-290.

Business Ethics and Regulatory Compliance 13 1544-0044-24-S1-20
Journal of Legal, Ethical and Regulatory Issues Volume 24, Special Issue 1, 2021

Gijarati D.N., & dan Porter, D.C. (2012). Dasar-Dasar Ekonomtrika, EDISIS 5, BUKU 2, Penterjemah Raden carlos
 Mangunson. Penerbit Salemba Empat, Jakarta.
Gitau, R., & Meyer, F. (2018). Spatial market integration in the era of high food prices. A case of surplus and deficit
 maize markets in Kenya. Agrekon, 57(3-4), 251-265.
Goodwin, B.K., & Schroeder, T.C. 1991. Cointegration tests and spatial price linkages in regional cattle
 market. American Journal of Agricultural Economics, 73: 1264-1273.
Guo, J., & Johnston, C.M. (2020). Do protectionist trade policies integrate domestic markets? Evidence from the
 Canada-US. Staff Working Paper 2020-10, 2020, 1-20.
Guo, J., & Tanaka, T. (2020). Dynamic transmissions and volatility spillovers between global price and us producer
 price in agricultural markets. Journal of Risk and Financial Management, 13(4), 83.
Gutema, G. (2020). Spatial integration of livestock markets in ethiopia. In A Multidimensional Economic
 Assessment of Africa (pp. 41-66).
Hao, Y., Li, Y., & Nye, J.V. (2020). Information transmission and market integration: The impact of telegraph
 construction on the grain markets in late imperial China.
Huang, H., & Xiong, T. (2020). Price bubbles and market integration in global sugar futures markets. Journal of
 Applied Economics, 23(1), 1-20.
Koutroumanidis, T., Zafeiriou, E., & Arabatzis, G. (2009). Asymmetry in price transmission between the producer
 and the consumer prices in the wood sector and the role of imports: The case of Greece. Forest Policy and
 Economics, 11(1), 56-64.
Mulyana, A., Lastinawati, E., Lifianthi, L., Riswani, R., & Aryani, D. (2020, April). Price transmission after the
 determination of rice ceiling price in South Sumatra Province: analysis of secondary and empirical data.
 In IOP Conference Series: Earth and Environmental Science 497(1), 012042.
McNew, K. 1996. Spatial market integration: Definition, theory and evidence. Agricultural and Resource
 Economics Review, 25: 1-11.
Meyer, J., & Von Cramon‐ Taubadel, S. (2004). Asymmetric price transmission: A survey. Journal of agricultural
 economics, 55(3), 581-611.a.
Özdemir, Ö., Hobbs, B.F., van Hout, M., & Koutstaal, P.R. (2020). Capacity vs energy subsidies for promoting
 renewable investment: Benefits and costs for the EU power market. Energy Policy, 137, 111166.
Ozturk, O. (2020). Market integration and spatial price transmission in grain markets of Turkey. Applied
 Economics, 52(18), 1936-1948.
Ravallion, M. 1986. Testing market integration. American Journal of Agricultural Economics, 88(1): 102-109.
Roman, M. (2020). Spatial integration of the milk market in Poland. Sustainability, 12(4), 1471.
Salazar, C., Ayalew, H., & Fisker, P. (2019). Weather shocks and spatial market efficiency: evidence from
 Mozambique. The Journal of Development Studies, 55(9), 1967-1982.
Wiyono, B. (2020). Gula, Masalah yang Tak Pernah Sudah. Dalam Media online: Gatra.com.
Zanin, V., Tonin, J.M., & Halmenschlager, V. (2020). Asymmetric price transmission in the commercialization of
 rice in Brazil. Italian Review of Agricultural Economics, 75(1), 19-35.
Zalzar, S., Bompard, E., Purvins, A., & Masera, M. (2020). The impacts of an integrated European adjustment
 market for electricity under high share of renewables. Energy Policy, 136, 111055.
Zavale, H., & da Cruz Macamo, R. (2020). Spatial price transmission between white maize grain markets in
 Mozambique and Malawi. Journal of Development and Agricultural Economics, 12(1), 37-49.
Zungo, M., & Kilima, F.T. (2019). Intercommodity price transmission between maize and rice prices in tanzania:
 Evidence from co-integration analysis and error correction model. Journal of Co-operative and Business
 Studies (JCBS), 4(1).
Zhang, K., Shao, S., & Fan, S. (2020). Market integration and environmental quality: Evidence from the Yangtze
 river delta region of China. Journal of Environmental Management, 261, 110208.
Zorya, S., von Cramon-taubadel, S., Greb, F . , Jamora, N., Mengel, C., & Würriehausen, N. ( 2014). “Price
 transmission from world to local grain markets in developing countries. Why it matters, how it works, and
 how it should be enhanced”.
Gillson, I . , & Fouad, A. In trade policy and food security: Improving access to food in developing countries in the
 wake of high world prices. World Bank, Washington, D.C. (Chapter 3), 65–86.

Business Ethics and Regulatory Compliance 14 1544-0044-24-S1-20
You can also read