Special Climate Statement 76 - Extreme rainfall and flooding in south-eastern Queensland and eastern New South Wales - 25 May 2022
←
→
Page content transcription
If your browser does not render page correctly, please read the page content below
Special Climate Statement 76 – Extreme rainfall and
flooding in south-eastern Queensland and eastern New
South Wales
25 May 2022

Contents
    Summary .................................................................................................................................................. 3
    1     Overview of meteorological conditions ................................................................................................ 7
    2     Antecedent conditions and outlooks .................................................................................................... 8
    3     Record breaking rainfall in south-eastern Queensland and north-east New South Wales................... 11
    4     Persistent intense rainfall in Sydney and along the central New South Wales coast........................... 14
    5     Rapid filling of South East Queensland major water storages ............................................................ 14
    6     Major local and widespread riverine flooding ..................................................................................... 16
             6.1        South-eastern Queensland................................................................................................ 16
             6.2        North-east New South Wales ............................................................................................ 16
             6.3        Sydney and New South Wales central and southern coastal regions ................................. 18
    7     An increasing trend in extreme rainfall............................................................................................... 18
    Tables of highest daily rainfall totals ........................................................................................................ 20
    Tables of highest weekly rainfall totals .................................................................................................... 22
    Tables of new rainfall records ................................................................................................................. 24
    Table of multi-day catchment-average records ........................................................................................ 26
    Tables of river heights............................................................................................................................. 28
    Further information ................................................................................................................................. 29

    Version number              Date of issue

    1.0                         25 May 2022

                     Unless otherwise noted, all images in this document except the cover photo are licensed
    under the Creative Commons Attribution Australia Licence.

    © Commonwealth of Australia 2022

    Published by the Bureau of Meteorology

    Cover image: Flooding around Yeronga in Brisbane, photo by Nelson Vermeer

2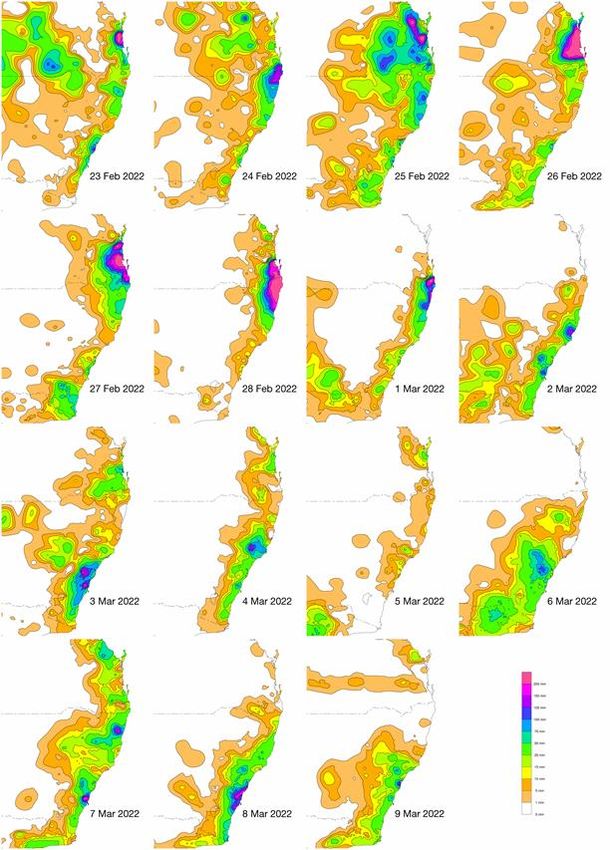
Summary
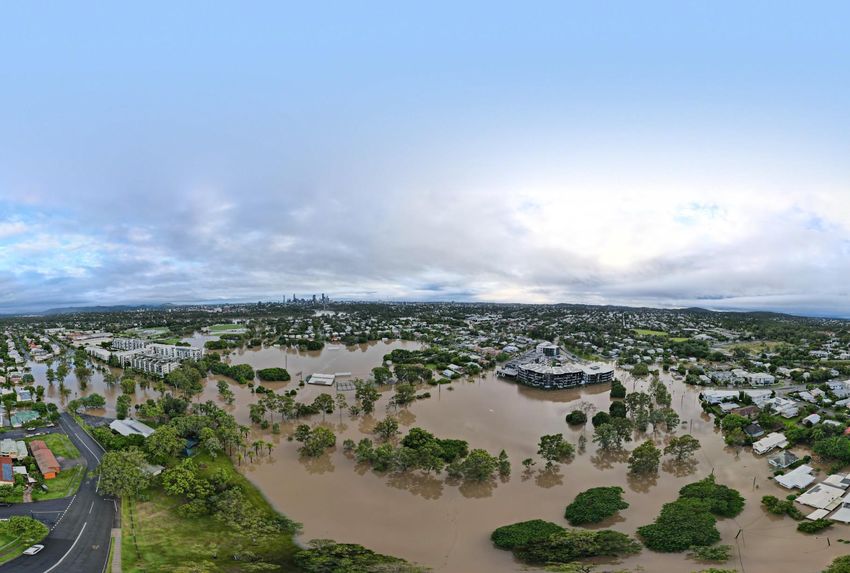
Extreme multi-day rainfall and significant flooding affected south-eastern Queensland and eastern New South
Wales from 22 February to 9 March 2022. The heavy rainfall began in south-east Queensland and north-east New
South Wales during the last week of February, and continued further south into eastern New South Wales in March
(Figure 1).
Multi-day rainfall records were broken across south-eastern Queensland and north-east New South Wales, with
multiple sites recording over 1 metre of rainfall (Figure 2). For the last week of February, rainfalls across parts of
the region were at least 2.5 times the February average (based on the 1961–1990 period), with some parts more
than 5 times the average. For north-east New South Wales and large areas of south-eastern Queensland, this was
the wettest week since at least 1900. The intense and sustained rainfall across the region led to flash flooding and
riverine flooding extending from Maryborough in Queensland to Grafton in New South Wales. Some areas of
south-eastern Queensland, such as the Mary River at Gympie, recorded their highest flood peaks since 1893.
Widespread major riverine flooding also occurred in the Sunshine Coast region, and in the Brisbane, Logan and
Albert River catchments. In parts of north-east New South Wales, peak flood levels broke previous observed
records (reliable since at least 1974 and for some locations dating back more than 100 years) by considerable
margins. Devastating flooding occurred through Lismore (Wilsons River) and other nearby towns, including Coraki
and Woodburn (Richmond River) and Murwillumbah and Tumbulgum (Tweed River).
In the first week of March, the rainfall system shifted south along the New South Wales coast, bringing further
heavy rainfall to eastern parts of the state (Figure 3). As a result, the Hawkesbury-Nepean catchment recorded its
wettest 9-day period on record (since 1900) to 9 March (Table 11). With rain falling on already saturated soils and
swollen rivers, flood levels in the Hawkesbury-Nepean river system exceeded those reached in March 2021 and
were comparable to those of 1978 (Table 12).
The 2022 rainfall and flooding were the result of a blocking high pressure system over New Zealand, that assisted
the formation of a series of slow-moving low pressure systems within a trough that fed a large volume of warm
moist air from the Coral and Tasman seas into eastern Australia. The subsequent development of a series of deep
low pressure systems delivered intense rain to east and south-east New South Wales. Following two years of La
Niña conditions, the rain fell on catchments that were already wet so water storages and river levels were high and
catchments quickly became saturated.
Key points:
• Extreme multi-day rainfall and significant flooding affected south-eastern Queensland and eastern New
South Wales from 22 February to 9 March 2022.
• The rainfall was the result of a series of low pressure systems combining with a blocking high pressure
system over New Zealand and a coastal trough which fed a large volume of moist tropical air into eastern
Australia.
• Across south-eastern Queensland and north-east New South Wales, rainfall in the last week of February
was between 2.5 to more than 5 times the monthly average (based on the 1961–1990 period).
• More than 50 sites in south-eastern Queensland and north-east New South Wales recorded more than 1
metre (1,000 mm) of rain in the week ending 1 March.
• The intense and sustained rainfall, coupled with saturated soils in catchments, caused major flooding
across many catchments in south-eastern Queensland and eastern New South Wales.
• The Mary River at Gympie, which has flood reports back to 1870, exceeded all previous recorded flood
peaks except the major flood in February 1893.The lower Logan River saw the worst flooding since
January 1974 (worse than those caused by ex-Tropical Cyclone Debbie in March 2017).
3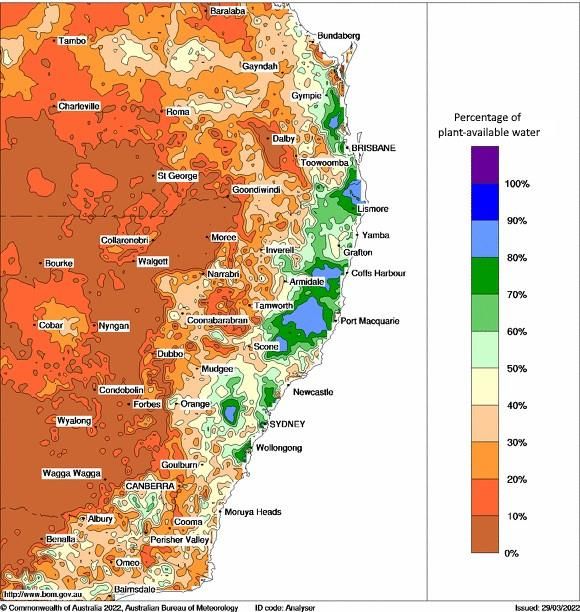
•   Widespread major flooding occurred in Brisbane and Ipswich along the Brisbane River and many smaller
        creeks and rivers. River levels along the lower Brisbane River, Bremer River and Lockyer Creek peaked
        below the floods of January 2011 and January 1974.

    •   Rivers in north-east New South Wales reached record levels, causing devastating flooding through
        Lismore (Wilsons River) and other nearby towns, including Coraki and Woodburn (Richmond River) and
        Murwillumbah and Tumbulgum (Tweed River).

    •   The Hawkesbury-Nepean catchment recorded its wettest 9- and 14-day periods on record (since 1900) to
        9 March, with major flooding recorded at locations along the Nepean and Hawkesbury Rivers. Major
        flooding was also recorded in the New South Wales Hunter Valley.

    •   In recent decades, there has been a trend towards a greater proportion of high-intensity, short-duration
        rainfall events, especially across northern Australia.

4
Figure 1: Maps of south-eastern Queensland and eastern New South Wales showing daily rainfall totals to 9am from
23 February to 9 March 2022.

5
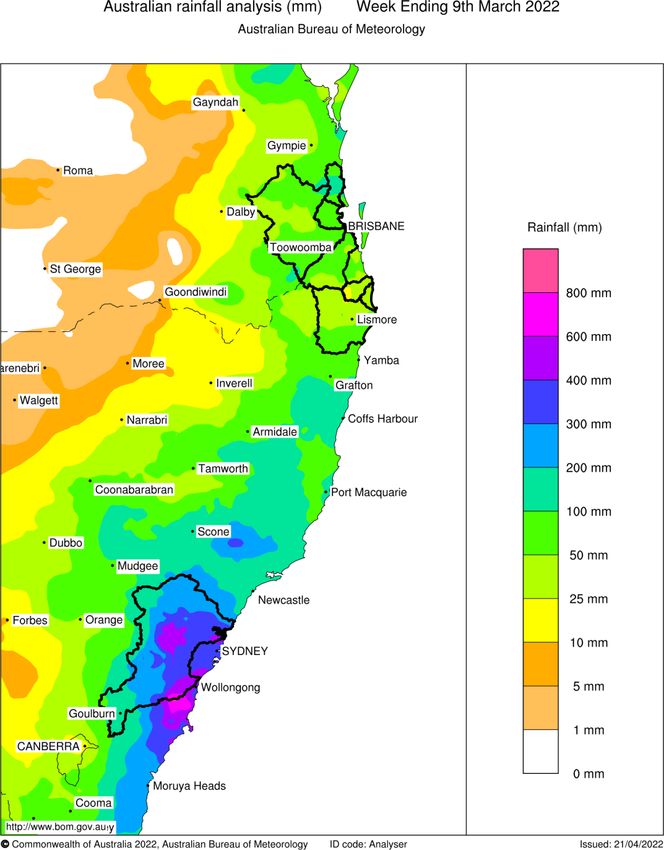
Figure 2: Map of 7-day rainfall totals for south-eastern Queensland and eastern New South Wales for the week ending
2 March 2022. Black outlines show river catchments where 7-day catchment-average records were exceeded during the 22
February – 9 March period (Table 11). More details of river catchment regions are available at
http://www.bom.gov.au/water/about/riverBasinAuxNav.shtml.

6
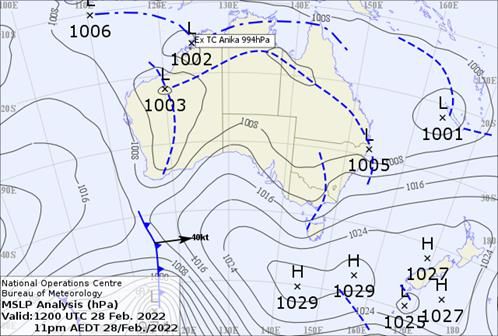
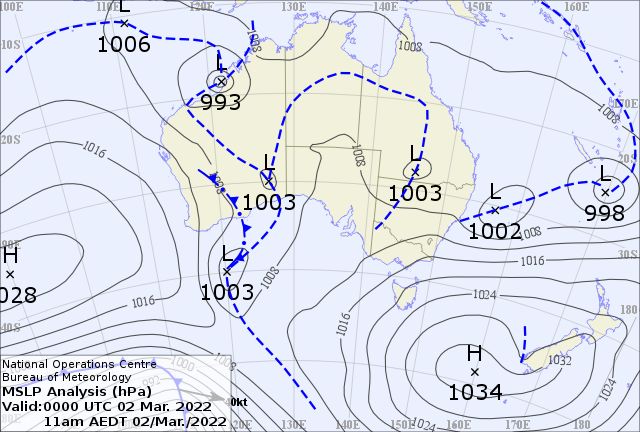
Figure 3: Map of 7-day rainfall totals for south-eastern Queensland and eastern New South Wales for the week ending
9 March 2022. Black outlines show river catchments where 7-day catchment-average records were exceeded during the 22
February – 9 March period (Table 11). More details of river catchment regions are available at
http://www.bom.gov.au/water/about/riverBasinAuxNav.shtml.

1 Overview of meteorological conditions
The significant rainfall that affected the coastal regions east of the Great Dividing Range in south-eastern
Queensland and eastern New South Wales, between 22 February and 9 March 2022, resulted from a combination
of weather systems. A blocking high pressure system near New Zealand, combined with a series of low pressure
systems, fed a large volume of tropical air over eastern Australia (Figure 4). Heavy rainfall developed in south-
eastern Queensland and north-east New South Wales during late February and was drawn southwards at the start
of March in response to a deepening east coast low. A second low pressure system and associated trough also
developed into an east coast low over 7 and 8 March resulting in further significant rainfall for the Hawkesbury-
Nepean Valley in New South Wales and surrounding catchments.

7

A low pressure trough developed along Australia’s east coast and deepened on 24 February (Figure 4). The
presence of the blocking high pressure system caused the trough to stall near the coast and persist until 28
February. At the same time, an upper-level low pressure system moved over the region from the west. This upper-
atmospheric system acted to intensify the surface trough and associated rain and thunderstorms. A low pressure
system then deepened from 2 March into an east coast low and moved towards the central New South Wales
coast. This low dissipated on 5 March and rain temporarily eased, before a second low deepened from 6 March.
This second low combined with the trough moving southward to deliver persistent southeasterly flow onto the NSW
coast from the Mid North Coast to the South Coast, including Sydney and the Hawkesbury-Nepean Valley.

The evolution and slow movement of the troughs and subsequent development of the east coast lows caused
significant and prolonged impacts across south-east Queensland and eastern New South Wales from 22 February
through to 9 March. These systems produced widespread heavy rainfall, with areas of locally intense rainfall
associated with embedded thunderstorms.

Figure 4. Mean Sea Level Pressure (MSLP) chart from. Top Left; 23:00 AEDT Wednesday 23 February 2022, Top Right; 23:00
AEDT Monday 28 February 2022. Bottom Left; 11:00 AEDT Wednesday 2 March 2022, Bottom Right; 11:00 AEDT Sunday 6
March 2022.

2 Antecedent conditions and outlooks
In 2021, rainfall for much of New South Wales and southern and central Queensland was above average (in the
wettest 30% of years since 1900). For Australia, nationally-averaged annual rainfall was 9% above the 1961–1990
average, including the wettest November on record.

Long-range forecasts for summer 2021–2022 issued on 2 December 2021 pointed to wetter than average
conditions along the east coast of Australia. The highest chance of above median rainfall was in the coastal strip of
New South Wales and on the Cape York Peninsula in Queensland (Figure 5). This outlook for a wet summer over
eastern Australia was consistent with long-range forecasts from other national meteorological agencies accredited

8
by the World Meteorological Organization as Global Producing Centres of Long Range Forecasts, including those
from the United Kingdom (UK), United States of America (US), Japan, and the European Union (Figure 6).

Therefore, the 2021–2022 summer started with an already wet landscape. By 22 February, much of the
subsequently affected areas around south-eastern Queensland, north-east New South Wales, Sydney and the
central New South Wales coast already had wet soils (Figure 7), sustained levels of sub-surface soil baseflow
runoff into rivers and full water storages leaving the environment with limited capacity to absorb the intense rainfall
that was to come.

Figure 5. Map of Australia showing the chance of exceeding median rainfall for summer 2021–22 issued by the Bureau of
Meteorology on 2 December 2021.

9
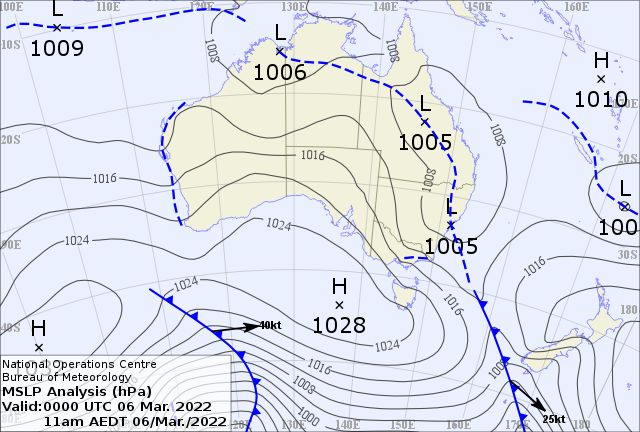
Figure 6. Maps of Australia showing the climate outlooks for rainfall issued by leading international meteorological agencies for
summer 2021–2022. Models in Copernicus multi-model ensemble include ECMWF (EU)/UK Met Office (UK)/Meteo-
France/CMCC (Canada)/DWD (Germany)/NOAA (USA)/JMA (Japan)/ECCC (Italy).

10
Figure 7. Map showing rootzone soil moisture prior to the start of the rain on 22 February 2022 for south-east Queensland and
eastern New South Wales. Shows the percentage of plant-available water content in the top 1 metre of soil as a percentage of
the field capacity.

Several climate drivers contributed to the development and maintenance of wetter conditions over 2021 and into
summer 2021–2022. These included an active La Niña in the tropical Pacific Ocean, a persistent and strong
positive phase of the Southern Annular Mode (SAM), warm oceans surrounding northern Australia, several active
phases of the Madden Julian Oscillation (MJO). In 1974 and 2011, such combinations of climate drivers, and in
particular similar or stronger La Niña events, led to previous periods of significant and widespread flooding across
the region.

3 Record breaking rainfall in south-eastern Queensland and north-east
  New South Wales
The intense rainfall that occurred across areas of south-eastern Queensland and north-east New South Wales
from 22 February to 1 March was some of the most significant on record. The region north of Brisbane towards
Gympie was the first affected, with rainfall starting in the early hours of Wednesday 23 February. The highest totals

11
were east of Gympie, with a Bureau of Meteorology standard rain gauge site (Beenham Valley Rd (040686)),
recording 424.0 mm in the 24 hours to 9am on 23 February (Table 1), with 425.0 mm recorded at a nearby flood
warning site1 (Mount Wolvi Alert (540304)) (Table 2).

Rainfall in the last week of February saw many rainfall records across Greater Brisbane. The Brisbane City gauge
recorded 792.9 mm in the 6 days from 23 to 28 February, which is 78% of the annual average at the current site of
1011.5 mm. The highest daily total was 228.4 mm on 27 February, a record for any month at the current site2.
There were three consecutive days, 26 to 28 February, with totals over 200 mm; across the current and former
sites there have been only eight previous days with totals over 200 mm, none of them consecutive. When
compared across the current and former sites, the Brisbane City gauge set records for all periods from 3 to 7 days.

This rainfall was sustained for almost a week across large areas (Figure 1). The Bureau's Moreton rainfall district3,
which includes Greater Brisbane, the Gold Coast, Gympie and Kingaroy, had its wettest week since at least 1900
(the start of the national gridded rainfall analysis). The totals for the Moreton rainfall district are comparable to the
extreme rainfall of February 1893, which saw three floods along the Brisbane River and Australia's highest daily
rainfall total of 907.0 mm at Crohamhurst on the 3rd of that month. The Brisbane City gauge recorded 887.0 mm in
February 2022, which is 479% of the monthly average of 185.2 mm at the current site. It was the second-highest
total for any month, behind only 1025.9 mm in February 1893 and more than in January 1974 (871.8 mm).
Averaged over the Brisbane River catchment, the rainfall in the last week of February was the highest on record
(since 1900) for all periods from 1 to 7 days (Table 11), exceeding totals during the January 1974 floods. It is
indicative of the spatial extent of the heavy rain that a daily record of 180.4 mm was set for Brisbane River
catchment average rainfall on 26 February (Table 11), even though very few individual sites set daily records.

The multi-day accumulation of intense rainfall resulted in many areas receiving more than half their average annual
(over the 1961–1990 period) rainfall total in just a week. Rainfall totals for the week ending 9am 1 March in parts of
south-eastern Queensland were in excess of 70% of the average annual rainfall total, with a broader region
receiving more than 60% of the average annual rainfall total. The highest verified 7-day rainfall total for south-
eastern Queensland was 1,334 mm at Upper Springbrook Alert (540400) (Table 6), a gauge in the flood warning
network. The highest total in the Bureau's standard network reporting in near-real time was 1,097.0 mm at
Clontarf4 (040965) (Table 5).

The rainfall extended and intensified into north-east New South Wales on 27 and 28 February. For the 3-day
period ending 9am 1 March, 5 flood warning sites exceeded 1,000 mm of rainfall. For the 7-day period ending 1
March, the Bureau's Upper North Coast rainfall district, which covers the Northern Rivers region in north-east New
South Wales, had its wettest week since at least 1900, with an area-averaged rainfall total of 642.8 mm, exceeding
the previous record set in March 1974 of 480.3 mm. This region also broke its previous area-averaged rainfall
records for the single daily rainfall total (since 1900), and for multi-day totals of 2, 3, 5, 6 and 7 days. Figure 8
highlights the areas where the 7-day rainfall totals exceeded previous 7-day records. Large areas of south-eastern
Queensland and north-east New South Wales received in excess of 80 mm more rain in a 7-day period than
previously recorded in any 7-day period since at least 1900 (Figure 8).

The catchments of the Tweed, Brunswick, Richmond and Wilsons rivers had 7-day average rainfalls that were 37%
to 61% above previous records (Table 11). The highest 7-day total recorded in eastern New South Wales was
1,346 mm at the flood warning site at Uki (058167) on the Tweed River (Table 8). The highest total reported in
near-real time in the Bureau standard network was 1,090.6 mm at Rosebank (Repentance Creek (058070)) (Table
7). Rainfall in this region was especially intense at 1- and 2-day timescales, with the Wilsons River catchment
average rainfall exceeding previous records at both timescales by more than 200 mm. The 2-day area-average of

1 The flood warning network of rain gauges operated are by a combination of the Bureau of Meteorology and other organisations and do not form part of
the Bureau's standard rain gauge network. The Bureau of Meteorology hold less information about many flood warning network sites compared to its
standard rain gauges. The variety of types of rain gauges used in the flood warning network and their locations means that it may not always be possible
to directly compare rainfall totals between the networks of rain gauges.

2Observations for “Brisbane City” are taken from the current site Brisbane (040913) which opened in December 1999. Rainfall is compared across the
current and former site Brisbane Regional Office (040214), which ran from 1841 to 1994 with complete daily rainfall data from 1869.

3   For information on the Bureau of Meteorology rainfall districts, see http://www.bom.gov.au/climate/cdo/about/rain-districts.shtml

4
    Clontarf exceeded 1,000 mm rainfall in 5 days (24-28 February).

12
649.0 mm (Table 11) compares with the next 3 highest 2-day values, 398.9 mm (March 1974), 388.6 mm (February 1954) and 368.0 mm (March 2017), which were previously also the three 3 highest floods on record at Lismore. The weekly rainfall totals in parts of north-east New South Wales were in excess of 60% of the average annual total rainfall (based on the 1961–1990 period), with a broader region receiving more than 40% of the average annual total rainfall. For the 6-day period to 28 February, rainfalls across parts of north-east New South Wales and south-eastern Queensland were at least 2.5 times the February average (based on the 1961–1990 period), with some parts more than 5 times the average. Rainfalls across parts of north-east New South Wales and south- eastern Queensland for 6-days ending 28 February were between 110–125% of the average summer rainfall. Figure 8: Map of south-eastern Queensland and eastern New South Wales showing areas that had their highest 7-day rainfall totals on record (since 1900). The highest 7-day rainfall total for the 16 days ending 9 March 2022, minus the previous highest 7-day rainfall total from all months since February 1900, indicating by how much the previous record 7-day rainfall was exceeded. Black outlines show river catchments where 7-day catchment-average records were exceeded during the 22 February – 9 March period. (Table 11). More details of river catchment regions are available at http://www.bom.gov.au/water/about/riverBasinAuxNav.shtml 13
4 Persistent intense rainfall in Sydney and along the central New
  South Wales coast
The New South Wales central and southern coasts, including Sydney, experienced persistent rain during the 2
weeks ending 9 March. The most intense rain fell during the week of 3–9 March, and some areas also received
more than 300 mm in the week prior (Figure 2). The individual daily rainfall totals were significant in some areas,
but it was the multi-day and multi-week nature of the intense rainfall that had the greatest impacts.

The 7-day period from 2–8 March, for example, was comparable to the wettest 7-day period on record (since 1900)
for the Hawkesbury-Nepean catchment average rainfall, set in February 2020. Multi-day area averaged records
were set for longer periods, particularly for 8- and 9-day periods ending 9 March. Parts of the Illawarra region
received more than 500 mm from the start of March. Fourteen-day totals were even more significant, with the
Hawkesbury-Nepean, Upper Nepean, Georges-Sydney Coast and Wollongong Coast catchments all setting
records (since 1900) by substantial margins (Table 11). Daily rainfall totals in excess of 150 mm were recorded at
locations from the Hunter Valley to south of Sydney from 3 to 9 March. Several sites recorded more than 200 mm
in a single day (e.g. Carey's Peak, 214.2 mm, 4 March; Ulladulla AWS 217.0 mm, 8 March; Beaumont 249.0 mm,
7 March).

At 9 March, Sydney (Observatory Hill) had recorded 872.4 mm since the start of the year, making it the wettest
start to the year since records began in 1859. The wet start exceeded the previous record of 815.8 mm up to
9 March, which was set in 1956. There were 16 consecutive days with at least 1 mm of rain and 10 consecutive
days with at least 10 mm of rain up until 9 March, both of which equalled previous records.

5 Rapid filling of South East Queensland major water storages
The intense rainfall contributed to significant inflow volumes to some of the major water storages in South East
Queensland. The Wivenhoe water storage increased from 57% on 23 February to over 183% on 28 February
(Figure 9, top); this is an increase of more than 1.4 million megalitres.

Wivenhoe Dam has a total storage capacity of 3.132 million megalitres with a full supply level of 1.165 million
megalitres5 and a flood storage capacity of 1.967 million megalitres. This flood storage capacity enables Wivenhoe
to exceed 100% of full supply level and absorb a significant volume of floodwaters from the Upper Brisbane River.
Other major6 gated water storages in the region such as Somerset (Figure 9, bottom) were also able to hold large
inflow volumes using flood storage capacity.

5seqwater is currently undertaking a Dam Improvement Program, which includes Wivenhoe and Somerset Dams. Whilst the program is underway,
Wivenhoe Dam is operating at an amended full supply level of 90% and Somerset at 80%. This means that seqwater commence flood releases from
Wivenhoe and Somerset Dams if storage levels exceed the amended full supply level. These temporary changes are not reflected in the full supply level
presented in this report (https://www.seqwater.com.au/project/somerset-dam-upgrade).

6
    Water storages with capacities greater than 1,000 megalitres are classified as 'major' in the Water Regulations 2008 Schedule 3 Part 1.

14
Figure 9. Water storage levels in Wivenhoe (top) and Somerset (bottom) major gated water storages as of 28 February 2022, and compared with the same time in 2021. 15
6 Major local and widespread riverine flooding

6.1 South-eastern Queensland
The record-breaking rainfall across south-eastern Queensland caused extensive flash flooding, overwhelming local
drainage systems and causing many minor creeks and rivers to burst their banks. Flash floods usually occur within
6 hours of intense rain and may not be measured by gauges, but the impacts can be seen across large areas.
Flash flooding can lead to rapidly rising, fast flowing water that endangers lives and causes significant damage to
property, roads and infrastructure.

The Mary River system was the first to flood, initially reaching moderate flood levels at Gympie on 23 February.
The area of the upper Mary River catchment, south of Gympie recorded 150–200 mm in the 24 hours to 9am 23
February and saturated the catchment. The Mary River at Gympie surpassed its historical peak of 21.677 metres
(in February 1999) and reached a maximum height of 22.96 metres on the morning of 27 February (below the
February 1893 peak of 25.45 metres), above the 17 metre threshold for a major flood.

The Brisbane River at Brisbane City peaked on the high tide at 3.85 metres on the morning of 28 February (Figure
10, top). This was lower than the peak of 4.46 metres recorded in January 2011. The Bremer River, a tributary of
the lower Brisbane River, reached major flood levels at Ipswich and peaked on the morning of 28 February at
16.72 metres; these levels were well below the 19.4 metres reached in January 2011. However, heavy rainfall
across Brisbane and Ipswich through the period led to significant river and creek level rises along smaller creeks
and tributaries, leading to extensive and significant flooding across the area.

The Logan River catchment experienced the most significant flooding since January 1974, with multiple locations
along the river peaking above levels observed during ex-Tropical Cyclone Debbie in March 2017. The Logan River
at Waterford peaked at around 11.15 metres, the highest level since January 1974 and well above the major flood
level of 9 metres. The Albert River experienced flooding, but river levels peaked below levels observed in March
2017.

6.2 North-east New South Wales
Record breaking floods in late February and early March (based on the available history of river level records)
occurred in north-east New South Wales and inundated major towns, including Lismore (Wilsons River), Coraki
and Woodburn (Richmond River), and Murwillumbah and Tumbulgum (Tweed River).

Lismore, located at the junction of Leycester Creek and Wilsons River, suffered devastating flooding on 28
February. The Wilsons River at Lismore peaked at a record high level at 14.4 metres between 1pm and 3pm on 28
February, overtopping the riverbank levee (10.6 metres) with floodwaters inundating the city. This exceeded the
previous record flood level (12.27 metres in February 1954) by over 2 metres.

Heavy rainfall also caused record major flooding along the Richmond and Tweed rivers. Levels of the Richmond
River at Woodburn peaked at 7.17 metres on 1 March, well above the major flood level of 4.2 metres (Figure 10,
bottom) and exceeding the February 1954 peak (5.42 metres) by around 1.8 metres. The Richmond River at
Coraki peaked at 7.65 metres on Tuesday 1 March, higher than the March 1974 peak (7.01 metres). Along the
Tweed River at Murwillumbah, the river peaked at 6.51 metres on the afternoon of 28 February, with major
flooding, exceeding the March 2017 flood (6.20 metres). At Tumbulgum on the Tweed River, the river peaked at
4.77 metres on the evening of 28 February, with major flooding, exceeding the March 2017 flood (3.91 metres).

Major flooding occurred in Grafton, Ulmarra and Maclean along the Clarence River, with levels at Ulmarra and
Maclean exceeding the March 2021 floods (Table 13). The Clarence River at Grafton peaked at nearly 7.67 metres
on 28 February, just below the Grafton levee crest (7.95 metres). The Clarence River at Ulmarra peaked at 6.03

7 River height levels quoted in this statement are provisional and may be subject to further quality assurance processes by key Agencies including the Bureau.

16
metres on 1 March, well above the major flood level of 4.9 metres. At Maclean, the Clarence River peaked at 3.37
metres on 1 March nearly a metre above the major flood level of 2.5 metres.

Figure 10. Graph of water level from 22 February to 9 March 2022 at the Brisbane River at Brisbane City Gauge (540198, top)
and the Richmond River at Woodburn gauge (058061) (bottom). The oscillations in the water level indicate the rise and fall of
the tide. Major, moderate and minor flood levels shown as defined at
http://www.bom.gov.au/water/floods/floodWarningServices.shtml.

17
6.3 Sydney and New South Wales central and southern coastal regions
Persistent intense rainfall in Sydney and along the central New South Wales coast caused widespread flash
flooding and major riverine flooding, particularly in the Hawkesbury-Nepean Valley. The already saturated soils, full
reservoirs and swollen rivers meant that the severe thunderstorms and persistent rain in the week of 3 to 9 March
quickly led to flash flooding. The widespread intense rainfall quickly overwhelmed local stormwater and drainage
systems, resulting in significant flash flooding across regional and metropolitan Sydney as well as along the New
South Wales coast. Severe weather and major flood warnings were issued, and thousands of people were
evacuated from the affected areas.

The Hawkesbury-Nepean Valley was impacted by two periods of consecutive heavy rainfall between 27 February
and 9 March, with the heaviest falls observed in the Upper Nepean catchment. Moderate to major flooding was
recorded along the Upper Nepean, driven by the first period of rain. A second period of heavy rain followed,
resulting in renewed increases of already elevated water levels, and higher second peaks at all locations.

The Hawkesbury River reached major flood levels from North Richmond downstream to the Wisemans Ferry
gauge (Table 12). Warragamba Dam, the largest water storage in the region at over 2 million megalitres, sits at the
headwaters of the Hawkesbury River system and was already at 98% of capacity on 22 February. The water in the
Hawkesbury River in late February and early March came from heavy rainfall in the catchment, the spilling of
Warragamba Dam and from the Nepean River, which also reached major flood levels at both Menangle Bridge and
Wallacia Weir (Figure 11). The Nepean River at Menangle Bridge reached a height of 15.92 metres on 8 March,
surpassing the March 2021 flood levels by more than 3 metres. The Hawkesbury River also surpassed the flood
level reached in March 2021 at Windsor, Sackville, Lower Portland and Wisemans Ferry (Table 12). At Windsor,
levels peaked on 9 March at 13.8 metres, nearly 1 metre above the March 2021 floods. At Lower Portland, river
levels peaked at 8.64 metres on 9 March, almost 1 metre above the 2021, 1978, and 1964 flood levels (Table 12).

There was significant flooding from the central to north coast of New South Wales along the Manning, Macleay and
Hunter rivers. Moderate to major flooding occurred in the Hunter River catchment. At Bulga on Wollombi Brook,
prolonged major flooding occurred from 7 to 11 March and a major flood peak of 7.37 metres was recorded on 9
March, with levels exceeding the March 2021 floods by over 0.7 metres (Table 13). At Singleton on the Hunter
River, a major flood peak of 13.15 metres was recorded around 6pm on 9 March, caused by the floodwaters
coming from Wollombi Brook. This was just above the major flood level (13 metres) and exceeded levels during
March 2021 floods by nearly 1 metre (Table 13).

7 An increasing trend in extreme rainfall
Observations show that there has been an increase in the intensity of heavy rainfall events in Australia. The
intensity of short-duration (hourly) extreme rainfall events has increased by around 10 per cent or more in some
regions in recent decades, with larger increases typically observed in the north of the country (State of the Climate
2020).

As the climate warms, heavy rainfall events are expected to continue to become more intense. A warmer
atmosphere can hold more water vapour than a cooler atmosphere, and this relationship alone can increase
moisture in the atmosphere by 7 per cent per 1 degree Celsius of global warming. This can cause an increased
likelihood of heavy rainfall events. Increased atmospheric moisture can also provide more energy for some
processes that generate extreme rainfall events, which further increases the likelihood of heavy rainfall (State of
the Climate 2020).

There is no clear trend in the number of east coast lows that have been observed over the past decades. Climate
model projections indicate that fewer east coast lows are likely to occur in the future due to increasing greenhouse
gas emissions (NESP 2019). However, other important changes to our climate are likely to affect the impacts of
future east coast lows, including the predicted increase in rainfall intensity resulting in increased risk factors for
flooding in some cases.

18
Figure 11. Map showing river gauge sites with major flooding in the Hawkesbury-Nepean catchment in the Sydney region
between 3 and 9 March 2022.

19
Tables of highest daily rainfall totals
Table 1: Ten highest daily rainfall totals at Queensland sites in the Bureau's standard rain gauge network for the period
22 February – 9 March 2022.

    Date       Station number Station name                                          Rainfall (mm)
    2022-02-26         140010 Tin Can Bay (Defence)                                           444.4
    2022-02-23         040686 Beenham Valley Rd                                               424.0
    2022-02-26         040908 Tewantin RSL Park                                               369.2
    2022-02-28         040607 Springbrook Road                                                 3698
    2022-02-26         040995 Noosaville                                                      368.8
    2022-02-26         040999 Landsborough                                                    345.0
    2022-02-28         040224 Alderley                                                        344.8
    2022-02-27         040965 Clontarf                                                        340.0
    2022-02-28         040550 Numinbah                                                        339.0
    2022-02-28         040965 Clontarf                                                        330.0

Table 2: Ten highest daily rainfall totals at Queensland sites that form part of the Flood Warning network of rain gauges
operated by the Bureau of Meteorology and other organisations for the period 22 February – 9 March 20229.

    Date       Station number Station name            Rainfall (mm)
    2022-02-28         540400 Upper Springbrook Alert            530
    2022-02-28         540354 Tomewin Alert                      491
    2022-02-28         540640 Currumbin Ck Alert                 480
    2022-02-25         039338 Old Range Rd Alert                 463
    2022-02-28         540371 Bracken Ridge Res Alert            444
    2022-02-26         540224 Upper Doonan Alert                 427
    2022-02-23         540304 Mount Wolvi Alert                  425
    2022-02-28         540467 Albany Creek Al                    421
    2022-02-26         540308 Boreen Point Alert                 420
    2022-02-26         540775 Pomona (Hill St) Alert             416

8 Rainfall totals are reported to the precision appropriate to the individual instruments. The Bureau of Meteorology collects rainfall data from a variety of
instruments, some with precision to whole millimetres, others to fractions of millimetres.

9 Higher real-time rainfall totals from Mt Glorious Alert (540138) and Pomona Alert (540324) were subsequently found to be suspect and are excluded
from this statement.

20
Table 3: Ten highest daily rainfall totals at New South Wales sites in the Bureau's standard rain gauge network for the period 22 February – 9 March 202210. Date Station number Station name Rainfall (mm) 2022-02-28 058165 Rosebank (Upper Coopers Creek) 701.8 2022-02-28 058070 Rosebank (Repentance Creek) 620.0 2022-02-28 058040 Mullumbimby (Fairview Farm) 520.0 2022-02-28 058127 Clunes (Flatley Drive) 394.0 2022-02-28 058097 New Italy (Vineyard Haven) 385.0 2022-02-28 058023 Mcleans Ridges (Lascott Drive) 364.8 2022-02-28 058027 Harwood Island (Harwood Sugar Mill) 334.2 2022-02-28 058036 Chillingham (Limpinwood) 331.0 2022-02-28 058020 Murwillumbah (Dungay (Taleswood)) 304.4 2022-02-28 058113 Green Pigeon (Morning View) 287.6 Table 4: Ten highest daily rainfall totals at New South Wales sites that form part of the Flood Warning network of rain gauges operated by the Bureau of Meteorology and other organisations for the period 22 February – 9 March 2022. Date Station number Station name Rainfall (mm) 2022-02-28 558031 Dunoon 775 2022-02-28 558033 Goonengerry 706 2022-02-28 558049 Huonbrook 662.0 2022-02-28 558000 Repentance (Coopers Creek) 592 2022-02-28 058167 Uki (Tweed River) 575 2022-02-28 558018 Terragon (Palmers Road) 540 2022-02-28 058206 Corndale (Coopers Creek) 539 2022-02-28 058180 Nimbin (Goolmangar Creek) 537 2022-02-28 558107 Burringar (Upper Burringbar Rd) 535 2022-02-28 558075 Lismore (Goolmangar (Goolmangar Creek)) 531 10 Non real-time data from Doon Doon (McCabes Road) (058019) subsequently reported a higher total but quality assurance checks have not yet been made of this observation. 21
Tables of highest weekly rainfall totals
Table 5: Ten highest weekly rainfall totals at Queensland sites in the Bureau's standard rain gauge network for the period 22
February – 9 March 2022.

 Week ending date Station number Station name              Rainfall (mm) Days of accumulation
       2022-03-01         040965 Clontarf                         1097.0                    7
       2022-03-01         040224 Alderley                         1009.0                    7
       2022-03-01         040686 Beenham Valley Rd                1008.2                    7
       2022-03-01         040958 Redcliffe                          968.8                   7
       2022-02-28         040550 Numinbah                           944.0                   6
       2022-03-01         040607 Springbrook Road                   930.0                   7
       2022-03-01         040999 Landsborough                       868.8                   7
       2022-03-01         040284 Beerburrum Forest Station          865.2                   7
       2022-02-28         040145 Mt Mee                             858.0                   6
       2022-03-01         040169 Peachester                         845.0                   7

Table 6: Ten highest weekly rainfall totals at Queensland sites that form part of the Flood Warning network of rain gauges
operated by the Bureau of Meteorology and other organisations for the period 22 February – 9 March 2022.

                                                                                                 Days of
 Week ending date  Station number Station name                                    Rainfall (mm) accumulation
        2022-03-01          540400 Upper Springbrook Alert                                  1334             7
        2022-03-01          540371 Bracken Ridge Res Alert                                  1164             7
        2022-03-01          540417 Murrumba Downs Alert                                     1150             7
        2022-03-01          540467 Albany Creek Al                                          1135             7
        2022-03-01          540326 Cooran Alert                                             1132             7
        2022-03-01          540414 Normanby Way Alert                                       1115             7
        2022-03-01          540412 Youngs Crossing Alert                                    1105             7
        2022-03-01          540562 Lawnton (Todds Rd) Alert                                 1099             7
        2022-03-01          540121 Everton Hills Alert                                      1096             7
        2022-03-01          540625 Strathpine (Gympie Rd) Alert                             1095             7

22
Table 7: Ten highest weekly rainfall totals at New South Wales sites in the Bureau's standard rain gauge network for the
period 22 February – 9 March 2022.
Week ending Station Days of
date number Station name Rainfall (mm) accumulation
2022-03-01 058070 Rosebank (Repentance Creek) 1090.6 7
2022-03-01 058040 Mullumbimby (Fairview Farm) 1012.6 7
2022-02-28 058165 Rosebank (Upper Coopers Creek) 1003.8 6
2022-03-08 068247 Beaumont (The Cedars) 816.2 7
2022-02-28 058036 Chillingham (Limpinwood) 788.5 6
2022-03-01 058020 Murwillumbah (Dungay (Taleswood)) 772.2 7
2022-03-01 058023 Mcleans Ridges (Lascott Drive) 710.2 7
2022-02-28 058127 Clunes (Flatley Drive) 703.0 6
2022-03-01 058097 New Italy (Vineyard Haven) 685.2 5
2022-03-01 058012 Yamba Pilot Station 668.2 7
Table 8: Ten highest weekly rainfall totals at New South Wales sites that form part of the Flood Warning network of rain
gauges operated by the Bureau of Meteorology and other organisations for the period 22 February – 9 March 2022.
Week ending Station Rainfall Days of
date number Station name (mm) accumulation
2022-03-01 058167 Uki (Tweed River) 1346 7
2022-03-01 558049 Huonbrook 1298 7
2022-03-01 558107 Burringar (Upper Burringbar Rd) 1297 7
2022-03-01 558033 Goonengerry 1283 7
2022-03-01 558031 Dunoon 1268 7
2022-03-01 558018 Terragon (Palmers Road) 1206 7
2022-03-01 058129 Kunghur (The Junction) 1170 7
2022-03-01 558094 Upper Crabbes Creek (Crabbes Creek Rd) 1116.5 7
2022-03-01 558079 Numinbah (Couchy Creek) 1088 7
2022-03-01 558028 Clarrie Hall Dam (Doon Creek) 1086 7
23Tables of new rainfall records
Table 9: Queensland sites setting new daily rainfall records for February. Only sites with 50 or more years of data included.
New records for any month highlighted in bold.
Station New daily Date of Previous Date of previous Years of
number Station name record (mm) new record record (mm) February record data
039097 Waterloo 325.0 2022-02-25 279.4 1931-02-04 113
040004 Amberley AMO 216.8 2022-02-26 109.0 1967-02-24 81
040043 Cape Moreton Lighthouse 229.8 2022-02-26 215.4 1931-02-05 152
040079 Forest Hill 269.8 2022-02-26 111.3 1959-02-18 128
040120 Lowood Don St 240.0 2022-02-26 143.5 1931-02-05 133
040140 Mt Brisbane 250.0 2022-02-26 186.7 1931-02-06 130
040145 Mt Mee 305.2 2022-02-27 304.8 1915-02-10 109
040184 Rosewood Walloon Rd 222.0 2022-02-26 130.0 1997-02-17 129
040224 Alderley 344.8 2022-02-28 304.8 1931-02-06 120
040312 New Beith 180.0 2022-02-28 145.5 1972-02-12 61
040343 Wamuran 294.0 2022-02-26 244.2 1999-02-09 67
040388 Upper Tenthill 217.0 2022-02-26 112.0 1992-02-10 63
040395 Fordsdale 180.4 2022-02-26 167.0 1997-02-14 69
040407 Lumeah 157.0 2022-02-28 139.0 2010-02-07 91
040458 Capalaba Water Treat 280.0 2022-02-26 238.3 1972-02-12 51
040463 Oxley 200.4 2022-02-26 179.1 1972-02-12 51
040469 Marodian Homestead 207.5 2022-02-25 168.0 2010-02-17 98
040493 Homeleigh 150.0 2022-02-26 132.8 1976-02-11 107
040517 McKenzie Creek 271.0 2022-02-26 230.4 1999-02-09 70
040693 Highvale 295.8 2022-02-26 190.5 1972-02-12 57
041016 Cecil Plains Homestead 131.8 2022-02-25 92.0 1988-02-13 65
041314 Brookstead Post Office 95.4 2022-02-25 93.4 2020-02-09 64
043065 Katoota 117.1 2022-02-22 63.0 1997-02-16 93
24Table 10 New South Wales sites setting new daily rainfall records for February or March. Only sites with 50 or more years of
data are included. New records for any month highlighted in bold.
Station New daily Date of Previous Date of previous Years of
number Station name record (mm) new record record (mm) monthly record data
058005 Brays Creek (Misty Mountain) 287 2022-02-28 275.3 1956-02-18 72
058012 Yamba Pilot Station 274.4 2022-02-28 270.5 1954-02-21 145
Harwood Island (Harwood
058027 Sugar Mill) 334.2 2022-02-28 273.1 1954-02-21 108
058040 Mullumbimby (Fairview Farm) 520.0 2022-02-28 359.0 2001-02-02 124
058059 Ulmarra (Newsagency) 267.4 2022-02-28 229.9 1954-02-21 130
058070 Rosebank (Repentance Creek) 620.0 2022-02-28 413.4 1976-02-29 65
058077 Grafton Research Stn 252.0 2022-02-28 136.0 2013-02-23 67
058099 Whiporie Post Office 297.4 2022-02-28 154.8 2013-02-23 56
Grafton South (South Grafton
058102 (Yeerong)) 160.0 2022-02-28 160.0 2020-02-07 58
058127 Clunes (Flatley Drive) 394.0 2022-02-28 368.0 1976-02-29 61
058129 Kunghur (The Junction) 522 2022-02-28 271.0 2001-02-02 53
054148 Lillian Rock (Williams Road) 369 2022-02-28 255.4 2001-02-02 56
061288 Lostock Dam 160.0 2022-03-04 143.6 1978-03-20 52
066080 Castle Cove (Rosebridge Ave) 181.0 2022-03-09 156.2 1975-03-11 64
066137 Bankstown Airport AWS 126.0 2022-03-08 121.6 1978-03-20 54
066141 Mona Vale Golf Club 135.8 2022-03-09 121.2 2019-03-15 53
068083 Culburra Treatment Works 145.2 2022-03-08 140.0 2011-03-22 57
Berrima West (Medway
068186 (Wombat Creek)) 131.6 2022-03-08 73.4 1983-03-22 52
25Table of multi-day catchment-average records
Table 11: Catchment-average rainfalls that were the highest on record for periods of 1 to 7 days, and 14 days. Catchment
average rainfall data starts in 1900. Sub-catchments are listed with parent catchment in brackets. More details of river
catchment regions are available at http://www.bom.gov.au/water/about/riverBasinAuxNav.shtml.
Period New record Date(s) of new Previous Date(s) of previous
Catchment (days) (mm) record record (mm) record
Maroochy 3 562.3 25−27 Feb 2022 545.3 4−6 Feb 1931
4 590.8 25−28 Feb 2022 581.0 3−6 Feb 1931
5 736.7 23−27 Feb 2022 609.3 3−7 Feb 1931
6 765.1 23−28 Feb 2022 613.5 2−7 Feb 1931
7 769.2 22−28 Feb 2022 697.1 31 Jan−6 Feb 1931
14 879.9 20 Feb−5 Mar 2022 867.4 27 Jan−9 Feb 1931
Pine / Caboolture 2 545.8 26−27 Feb 2022 452.4 5−6 Feb 1931
3 714.2 26−28 Feb 2022 598.1 25−27 Jan 1974
4 777.4 25−28 Feb 2022 674.0 25−28 Jan 1974
5 801.0 24−28 Feb 2022 681.8 25−29 Jan 1974
6 852.8 23−28 Feb 2022 689.4 24−29 Jan 1974
7 856.5 23 Feb−1 Mar 2022 692.5 24−30 Jan 1974
14 927.2 19 Feb−4 Mar 2022 723.8 15−28 Jan 1974
Brisbane 1 180.4 26 Feb 2022 170.7 27 Jan 1974
2 315.9 26−27 Feb 2022 279.2 26−27 Jan 1974
3 398.8 25−27 Feb 2022 348.5 25−27 Jan 1974
4 444.6 25−28 Feb 2022 397.4 25−28 Jan 1974
5 453.5 24−28 Feb 2022 403.7 25−29 Jan 1974
6 477.9 23−28 Feb 2022 409.1 24−29 Jan 1974
7 479.4 23 Feb−1 Mar 2022 413.5 6−12 Jan 2011
14 486.2 22 Feb−7 Mar 2022 415.1 15−28 Jan 1974
Bremer (Brisbane) 14 525.9 23 Feb−8 Mar 2022 490.3 15−28 Jan 1974
Lockyer (Brisbane) 1 191.7 26 Feb 2022 155.1 27 Jan 1974
2 301.7 26−27 Feb 2022 247.4 26−27 Jan 1974
3 381.8 25−27 Feb 2022 294.3 26−28 Jan 1974
4 414.8 25−28 Feb 2022 337.7 25−28 Jan 1974
5 419.0 24−28 Feb 2022 363.7 1−5 May 1996
6 436.4 23−28 Feb 2022 397.7 1−6 May 1996
7 444.8 25 Feb−3 Mar 2022 400.9 1−7 May 1996
14 490.5 23 Feb−8 Mar 2022 431.5 24 Apr−7 May 1996
Logan-Albert 7 466.5 23 Feb−1 Mar 2022 463.3 24−30 Jan 1974
14 523.7 23 Feb−8 Mar 2022 482.5 25 Jan−7 Feb 1974
Tweed 1 394.0 28 Feb 2022 358.5 31 Mar 2017
2 558.8 28 Feb−1 Mar 2022 519.2 30−31 Mar 2017
3 713.0 27 Feb−1 Mar 2022 566.4 4−6 Feb 1931
4 731.3 26 Feb−1 Mar 2022 625.4 4−7 Feb 1931
5 787.1 25 Feb−1 Mar 2022 654.8 3−7 Feb 1931
6 910.0 24 Feb−1 Mar 2022 677.8 3−8 Feb 1931
267 944.3 23 Feb−1 Mar 2022 694.7 3−9 Feb 1931
14 985.9 19 Feb−4 Mar 2022 869.9 1−14 Apr 1988
Brunswick 1 417.2 28 Feb 2022 309.4 31 Mar 2017
2 580.7 28 Feb−1 Mar 2022 412.9 1−2 Feb 2001
3 711.9 27 Feb−1 Mar 2022 511.0 4−6 Feb 1931
4 724.6 26 Feb−1 Mar 2022 559.0 10−13 Mar 1974
5 752.7 25 Feb−1 Mar 2022 567.6 3−7 Feb 1931
6 874.1 24 Feb−1 Mar 2022 585.7 3−8 Feb 1931
7 899.8 23 Feb−1 Mar 2022 605.0 3−9 Feb 1931
14 946.9 22 Feb−7 Mar 2022 870.1 1−14 Apr 1988
Richmond 1 315.2 28 Feb 2022 235.2 21 Feb 1954
2 414.4 28 Feb−1 Mar 2022 338.3 20−21 Feb 1954
3 476.3 27 Feb−1 Mar 2022 374.2 20−22 Feb 1954
4 490.2 26 Feb−1 Mar 2022 419.5 10−13 Mar 1974
5 535.7 25 Feb−1 Mar 2022 421.6 10−14 Mar 1974
6 634.9 24 Feb−1 Mar 2022 427.0 5−10 May 1980
7 655.7 23 Feb−1 Mar 2022 454.8 4−10 May 1980
14 706.0 23 Feb−8 Mar 2022 597.9 31 Mar−13 Apr 1988
Wilsons (Richmond) 1 486.5 28 Feb 2022 282.6 31 Mar 2017
2 649.0 28 Feb−1 Mar 2022 398.9 10−11 Mar 1974
3 733.7 27 Feb−1 Mar 2022 464.8 10−12 Mar 1974
4 746.7 26 Feb−1 Mar 2022 543.7 10−13 Mar 1974
5 790.0 25 Feb−1 Mar 2022 548.8 10−14 Mar 1974
6 923.5 24 Feb−1 Mar 2022 567.5 3−8 Feb 1931
7 948.5 23 Feb−1 Mar 2022 588.2 3−9 Feb 1931
14 990.0 23 Feb−8 Mar 2022 745.0 1−14 Apr 1988
Hawkesbury-Nepean 7 289.9 2−8 Mar 2022 289.2 7−13 Feb 2020
14 383.3 24 Feb−9 Mar 2022 333.9 7−20 Feb 2020
Upper Nepean
(Hawkesbury-Nepean) 7 466.3 2−8 Mar 2022 437.1 16−22 Nov 1961
14 634.2 24 Feb−9 Mar 2022 518.3 9−22 Feb 1956
Georges-Sydney Coast 14 568.0 23 Feb−8 Mar 2022 486.9 9−22 Feb 1956
Wollongong Coast 14 756.2 23 Feb−8 Mar 2022 690.7 18 Nov−1 Dec 1961
27Tables of river heights
Table 12: Selected locations in the Hawkesbury-Nepean Valley where the peak flood level in March 2022 exceeded that of the
March 2021 floods11.
March 2022 March 2021
River Location Peak Peak Note
Upper Nepean Menangle Bridge 15.92 metres 12.85 metres on Also peak of 16.83 metres on
on 8 Mar 2022 23 Mar 2021 7 Apr 2022
Upper Nepean Wallacia Weir 11.35 metres 8.57 metres on
on 8 Mar 2022 21 Mar 2021
Hawkesbury-Nepean North Richmond 14.09 metres 14.38 metres on
on 8 Mar 2022 21 Mar 2021
Hawkesbury-Nepean Windsor 13.8 metres 12.93 metres on March 2022 level around 0.7
on 9 Mar 2022 24 Mar 2021 metres below the 1978 floods
Hawkesbury-Nepean Sackville 10.58 metres 9.71 metres on
on 9 Mar 2022 21 Mar 2021
Hawkesbury-Nepean Lower Portland 8.64 metres 7.84 metres on March 2022 around 1 metre
on 8 Mar 2022 24 Mar 2021 higher than 1978 and 1964
Hawkesbury-Nepean Wisemans Ferry 5.18 metres 4.36 metres on
on 9 Mar 2022 24 Mar 2021
Table 13: Selected locations in the Hunter and Clarence Valleys where the peak flood level in March 2022 exceeded that of the
March 2021 floods.
March 2022 March 2021
River Location Peak Peak Note
Hunter Singleton 13.15 metres on 12.20 metres on
9 Mar 2022 25 Mar 2021
Hunter Maitland 9.36 metres on 7.56 metres on
11 Mar 2022 26 Mar 2021
Wollombi Brook Bulga 7.37 metres on 6.63 metres on
9 Mar 2022 23 Mar 2021
Wollombi Brook Wollombi 11.25 metres on 7.95 metres on
9 Mar 2022 22 Mar 2021
Clarence Grafton 7.67 metres on 6.56 metres on
28 Feb 2022 24 Mar 2021
Clarence Ulmarra 6.03 metres on 5.13 metres on
1 Mar 2022 24 Mar 2021
Clarence Maclean 3.37 metres on 2.66 metres on
1 Mar 2022 25 Mar 2021
11
All river height levels quoted in Tables 12 and 13 are provisional and may be subject to further quality assurance processes by key Agencies including
the Bureau.
28Further information
This statement in general covers information available as at 18 March 2022.
This statement uses the following analysis datasets:
• Rainfall daily totals since 1900: Australian Water Availability Project (AWAP)
o Available at: http://www.bom.gov.au/climate/maps/rainfall
o About: http://www.bom.gov.au/climate/austmaps/about-rain-maps.shtml
• Rainfall monthly totals since 1900: Australian Gridded Climate Dataset (AGCD)
o Available at: http://www.bom.gov.au/climate/maps/rainfall
o About: http://www.bom.gov.au/climate/austmaps/about-agcd-maps.shtml
• Rootzone soil moisture: Australian Water Resources Assessment Landscape model (AWRA-L)
o Available at: https://awo.bom.gov.au
o About: https://awo.bom.gov.au/about/overview
References
State of the Climate (2020). http://www.bom.gov.au/state-of-the-climate
National Environmental Science Program (2019) East coast lows and climate change in Australia.
https://nespclimate.com.au/wp-
content/uploads/2019/11/A4_4pp_brochure_NESP_ESCC_East_Coast_Lows_Nov11_2019_WEB.pdf
29You can also read