Interim Results November 2020 - Hibernia REIT

Page created by Leo Aguilar
 
CONTINUE READING
Interim Results November 2020 - Hibernia REIT
Interim Results
November 2020
Interim Results November 2020 - Hibernia REIT
Disclaimer

This presentation (hereinafter "this document") has been prepared by Hibernia REIT plc (“Hibernia”,
the “Company“, “Group”, “we” or “us”) for information purposes only.
This document has been prepared in good faith but the information contained in it has not been
independently verified and does not purport to be comprehensive. This document is neither a
prospectus nor an offer nor an invitation to apply for securities. No representation or warranty,
express or implied, is given by or on behalf of the Company, its group companies, or any of their
respective shareholders, directors, officers, employees, advisers, agents or any other persons as to
the accuracy, completeness, fairness or sufficiency of the information, projections, forecasts or
opinions contained in this presentation. In particular, the market data in this document has been
sourced from third parties. Save in the case of fraud, no liability is accepted for any errors, omissions
or inaccuracies in any of the information or opinions in this document.
Certain information contained herein may constitute “forward-looking statements” which can be
identified by the use of terms such as “may”, “will”, “should”, “expect”, “anticipate”, “project”,
“estimate”, “intend”, “continue”, “target” or “believe” (or negatives thereof) or other variations
thereon or comparable terminology. Due to various risks and uncertainties, actual events or results or
actual performance of the Group may differ materially from those reflected or contemplated in such
forward-looking statements. No representation or warranty is made as to the achievement or
reasonableness of, and no reliance should be placed on, such forward-looking statements. There is
no guarantee that the Group will generate a particular rate of return.
Pictured on cover: 2 Cumberland Place nearing completion
Hibernia REIT plc                                                                                           INTERIM RESULTS | NOV 2020   2
Interim Results November 2020 - Hibernia REIT
Agenda

    Highlights
    Financial results
    Market update
    Portfolio and development
    update
    Conclusion

  Pictured: Dublin’s Dawson Street photographed looking north
Hibernia REIT plc                                               INTERIM RESULTS | NOV 2020   3
Interim Results November 2020 - Hibernia REIT
Results summary

                                                                                                   6 months                                                    12 months
                                                                                                   to Sep-20                                                   to Sep-20

 Portfolio value(1,2)                                                                                 (3.8%)                                                     (2.6%)

 Total property return (“TPR”)(2,3)                                                                   (1.7%)                                                       1.6%

    TPR vs. MSCI Ireland Index(4)                                                                    (0.2pp)                                                    +1.8pp

 EPRA NTA per share(2)                                                                                (4.1%)                                                     (2.1%)

 EPRA earnings per share                                                                             +17.6%                                                    +22.9%

 Total accounting return (“TAR”)(2,5)                                                                 (2.4%)                                                       0.6%

(1) Like-for-like change (incl. finance costs) on Investment Property and excluding assets acquired and disposed of during the period
(2) “NTA” is the abbreviation for Net Tangible Assets. Over the 12 month period to Sep-20, performance was impacted by the increase in commercial stamp duty (from 6% to 7.5%) in October 2019,
    which reduced Hibernia’s portfolio value by c.1.5%
(3) TPR is calculated on an “all assets” basis as per MSCI
(4) MSCI/SCSI Ireland Quarterly Property All Assets Index (excl. Hibernia)
(5) Calculated as EPRA NTA per share growth plus dividends per share paid in period
Hibernia REIT plc                                                                                                                                 INTERIM RESULTS | NOV 2020             4
Interim Results November 2020 - Hibernia REIT
Business highlights
1. Rent collection rates reflect strong tenant base               4. Accretive use of capital
   • 60% of our contracted rent is from technology                   • €25m share buyback programme launched in Aug-20
     companies or state entities                                        – Completed in Nov-20 with average purchase price of
   • Commercial(1) rent collection(2) : 99% for the last three            €1.08 per share
     quarters                                                        • €3.8m of bolt-on acquisitions of property
   • Residential(1) rent collection: averaging 99% for the last
     three months

                                                                  5. ESG focus
2. Further growth in distributable income                            • Real-time energy monitoring system now running in our
   • 24,000 sq. ft. of new office lettings in period and a             managed offices
     further 12,000 sq. ft. after period end                         • EPRA Gold Award for ESG disclosures for third
   • Annual contracted rent +1% in the period to €66.5m                successive year
   • Net rental income in the period +12.0% to €32.0m                • GRESB and CDP submissions made and results due
                                                                       shortly
    • Interim DPS +14.3% to 2.0c
                                                                     • Focus on the TCFD and Net Zero Carbon pathways

3. Progress with developments
   • 62,500 sq. ft. of Grade A offices completing by Jan-21(3)
      – 38% pre-let
   • Full planning now in place for 539,000 sq. ft. near term
     office pipeline
      – Final approval received for Clanwilliam Court
        (152,000 sq. ft.) and Marine House (50,000 sq. ft.)
      – Approval received for expanded Harcourt Square
        scheme (337,000 sq. ft.)

(1) 91% of contracted rent is commercial; 9% is residential
(2) Rent received or on agreed payment terms
(3) 2 Cumberland Place and 50 City Quay
Hibernia REIT plc                                                                            INTERIM RESULTS | NOV 2020   5
Interim Results November 2020 - Hibernia REIT
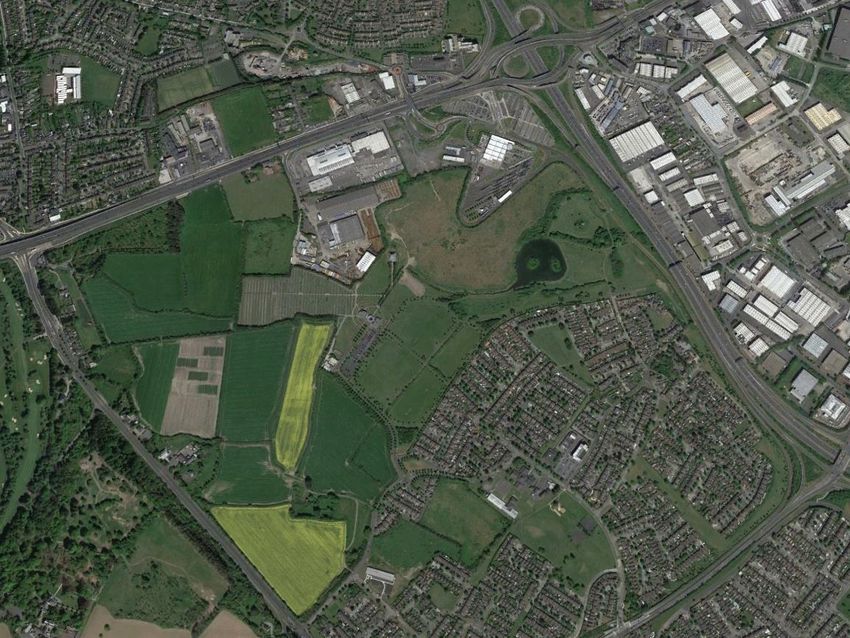
Office market update and outlook

             Current: Significant fall in activity due                Longer-term: Acceleration in structural shifts
             to restrictions / economic uncertainty                   seen pre-COVID

  Occupational market                                                          More remote working
  • Q2+Q3 2020 take-up: -57% on prior year(1)
  • Active demand: -28% vs Feb-20 and -45% vs Sep-19(2)                        Offices as a place for collaboration
  • Grade A CBD office vacancy: 9.1% at Sep-20 vs 5.9% at                      • More break-out spaces
    Mar-20(1)                                                                  • Town-halls and communal areas
  • Headline prime CBD rents: €57.50psf vs €62.50psf in
    Mar-20(1)                                                                  Increased focus on employee wellness
                                                                               • Building facilities
  Investment market                                                            • Air and light quality
  • Q2+Q3 2020 volumes: -54% on prior year(1)                                  • Nearby amenities
  • Overseas investors still active
  • Prime yields remain at 4%(1)                                               Importance of ESG credentials
  • Some evidence of secondary yields moving out(1)
                                                                               Greater lease flexibility sought
                                                                               • Shorter lease terms
                                                                               • Furnished space (“managed offices”)

 Outlook                                                       Outlook
 ➢ Limited transactional evidence since COVID-19 but market    ➢ Well-configured, prime CBD offices likely to be in demand
     fundamentals much better than in 2008                     ➢ Many of the features above were successfully
 ➢ Until workers are able to return in meaningful numbers          incorporated in the Windmill Quarter, our first office
     expect vacancy rates and rents to remain under pressure       cluster

(1)   Source: Knight Frank
(2)   Source: Cushman & Wakefield

Hibernia REIT plc                                                                            INTERIM RESULTS | NOV 2020   6
Interim Results November 2020 - Hibernia REIT
Opportunities for Hibernia

1. We have two new city centre office cluster developments ready to start in near term, both building on the success of the Windmill
      Quarter and both with low break-evens
      • Clanwilliam Quarter (>200,000 sq. ft.) can start in early 2022 for delivery in 2025
      • Harcourt Square (337,000 sq. ft.) can start in early 2023 for delivery in 2026
      • Estimated all-in capital cost of delivery of c.€850 per buildable sq. ft. (including current property value)

2. Substantial longer-term potential in our portfolio
      • 154 acres of well-located land with mixed-use potential(1)
      • Assessing in-place office portfolio for future redevelopment opportunities

3. Strong balance sheet gives strategic flexibility and substantial investment capacity
      • LTV of 18.7% at Sep-20
      • €103m of cash and undrawn facilities(2), with potential to add more facilities if necessary

                                     We have the team and the funding capacity to capitalise on internal and external opportunities

(1)   Subject to rezoning
(2)   Net of committed expenditure
Hibernia REIT plc                                                                                                          INTERIM RESULTS | NOV 2020   7
Interim Results November 2020 - Hibernia REIT
Agenda

     Highlights
     Financial results
     Market update
     Portfolio and development
     update
     Conclusion

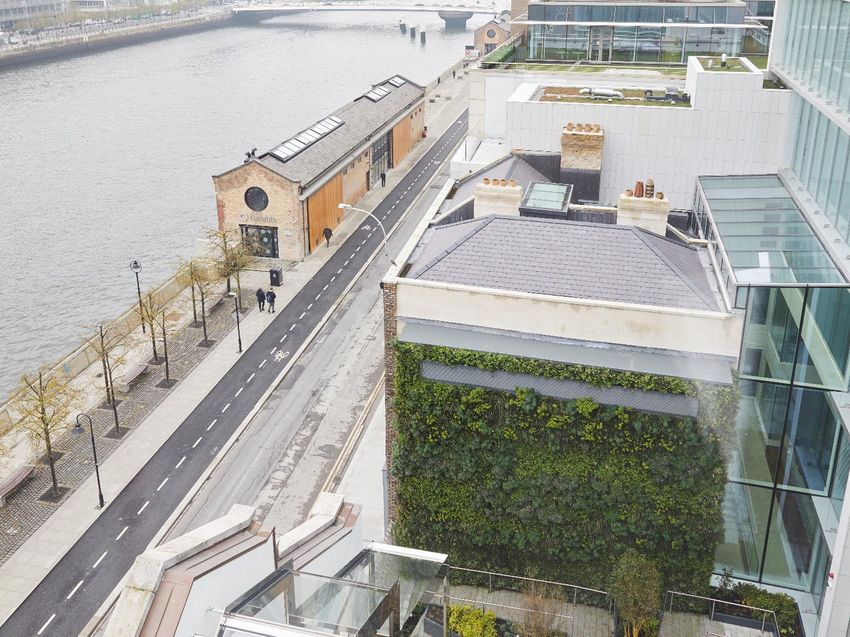
  Pictured: The Living Wall at 1SJRQ, Dublin
Hibernia REIT plc                              INTERIM RESULTS | NOV 2020   8
Interim Results November 2020 - Hibernia REIT
Tenant breakdown and rent collection
     Contracted rent by sector/industry                                                                          Commercial rent(2) collection
                                                                                                                  Quarter ending                            Dec-20              Sep-20              Jun-20
                                        45%
                                                                                                                  Within seven days                           90%                87%                 89%
                                                                                                                  Within 14 days                              90%               90.5%                89%
                                                                                Office
                                         Contracted                            WAULT*:                            Within 30 days                              93%               90.5%                90%
                                                            15%
                                            rent:
                                          €66.5m(1)
                                                                               6.2 years                          Within 60 days                              95%                95%                93.5%
                          1%    3%
                                3%                                                                                Rent received at 16 November                95%                99%                 96%
                                   6%                   11%
                                        7%      9%                                                                Monthly rent                               3.5%                  -                   -
                                                                                                                  Deferred rent                                 -                  -                 3%(3)
 Office - Technology                Office - Govt agency                    Office - Banking & Capital Markets    Rent on payment plans at 16
                                                                                                                                                             3.5%                  -                  3%
 Residential                        Other                                   Office - Professional Services        November
 Office - Media & Telecomms.        Office - Insurance & Reinsurance        Co-working
                                                                                                                  Rent due                                   0.5%                0.5%                0.5%

     Top 10 tenants by contracted rent                                                                            Rent waived                                1.0%                0.5%                0.5%
                                                                                                                  Rent unpaid at 16 November                 1.5%                 1%                  1%
                                                                               HubSpot
                                                                               €10.5m
                                                                                 16%

                                                                                          OPW
                                                                                          €6.0m                  Residential rent collection
                                                                                           9%
Rest of portfolio         Top 10                                                                                   Month                                    Nov-20              Oct-20              Sep-20
    €30.0m                €36.5m                                                             Twitter
      45%                  55%                                                               €5.1m                 Within 30 days                             98%                >99%                >99%
    3.9yrs*               7.4yrs*                                                              8%

                                                                                             Zalando
                                                   ComReg                                      €2.9m
                                                    €1.6m                                       4%
                                                                                      Autodesk
                                                     2%
                                                                                       €2.8m
                                                                                         4%

                                                  BNY Mellon                    Riot Games        Informatica
                                                    €1.6m      Travelport          €2.0m             €2.1m
                                                     3%          €1.8m                                3%          (1) Contracted rent includes residential on a net basis and excludes income from The Brickhouse
                                                                                    3%
                                                                  3%                                              (2) Commercial tenants are all tenants other than residential
     *Office WAULT to earlier of break/expiry                                                                     (3) Due to be paid in full by July 2021
     Hibernia REIT plc                                                                                                                                              INTERIM RESULTS | NOV 2020         9
Interim Results November 2020 - Hibernia REIT
Financial highlights
 Balance sheet                             Sep-20      Mar-20                        Change
 Portfolio value                          €1,420.9m   €1,465.2m                      (3.8%)

 Net debt                                 €265.3m     €241.4m                        +9.9%

 Loan to value                             18.7%       16.5%                         +2.2pp

 Net assets                               €1,167.1m   €1,231.1m                      (5.2%)

 EPRA NTA per share                        171.9c      179.2c                        (4.1%)

 Income statement                          Sep-20      Sep-19                        Change
 Net rental income                         €32.0m      €28.6m                        +12.0%

 Revaluation and disposal (loss) / gain   (€56.9m)     €6.3m                          N/A

 (Loss) / Profit after tax                (€34.2m)     €25.5m                       (234.2%)

 EPRA earnings                             €22.4m      €19.3m                        +16.4%

 EPRA EPS                                   3.3c        2.8c                         +17.6%

 Interim dividend per share                 2.0c        1.75c                        +14.3%

Hibernia REIT plc                                               INTERIM RESULTS | NOV 2020     10
EPRA NTA per share movement since 31 March 2020
                         184
                                         Like-for-like “in-place” office valuation: (4.4%) (c.40%(1) ERV impact)

                         182

                                                      Net valuation reduction: (8.3c)
                         180   179.2c
                                                              Resi.i

                         178
                                                         Trad Core
                                                                                                                                                     (4.1%)
EPRA NTA per share (c)

                         176
                                                         South Docks

                                                                                                           3.3c
                         174                               IFSC

                                                          Other
                                                        Developments                                                                     0.7c                 171.9c
                         172
                                                           (6.9c)
                                                            Other

                                                                                   (1.4c)                               (3.0c)
                         170

                                                    South Docks
                                                                        Residential  +0.9c
                         168                                            Trad Core    (0.5c)
                                                      Other
                                                                        South Docks (0.8c)
                                                                        IFSC         (0.8c)
                         166                                            Other        (0.1c)
                                                                        Developments (0.1c)

                         164
                               Mar -20              Q1 performance            Q2 performance             EPRA EPS   Dividends paid   Share buyback            Sep-20

                                173.2c                                 0.9c                                 2.8c       (2.0c)           0.7c                      175.6c
                               Mar-19(2)                                                                                                                          Sep-19(2)

(1) Based on standing office investments only in 6 months to Sep-20 per MSCI
(2) Reported EPRA NAV per share figures restated to EPRA NTA per share
Hibernia REIT plc                                                                                                                    INTERIM RESULTS | NOV 2020         11
Earnings and dividend progression
EPRA earnings movement versus period to 30 Sep 2019                                                                    6.0
                                                                                                                             EPRA EPS and DPS growth in last five years
          2WML         €1.7m
€23m                                                        €0.2m
          1SJRQ        €1.1m                €0.4m
                                                                                            €22.4m                     5.0
                                                                            (€0.3m)
                               €2.8m
€22m

€21m                                                                             +€3.1m                                4.0
                                                                                 +16.4%

                                                                                                       Per share (c)
€20m                                                                                                                                                                 3.0
            €19.3m                                                                                                     3.0                                                      EPRA EPS
                                                                                                                                                                                 3.3c(3)
€19m
                                                                                                                                                        2.0
                        New lettings      €0.9m (1)      Direct property cost     (€0.1m)
€18m                                                                                                                   2.0                1.9
                        Vacancy           (€0.3m)        Expected credit loss     (€0.1m)

                        Rents waived      (€0.2m)        Finance expense          (€0.1m)                                      1.5
€17m
                                                                                                                       1.0                                                         2.0
                                                                                                                                                                     1.75
€16m                                                                                                                                                    1.5
                                                                                                                                          1.1
                                                                                                                              0.75

€15m                                                                                                                   0.0
            Sept-19     Developments       Leasing       Disposals &       Cost Items       Sept-20                           FY17       FY18          FY19          FY20          FY21
                        completed in       activity      acquisitions
                          prior year                                                                                                 Interim DPS         Final DPS          EPRA EPS
                                                                                    (2)
        €12.8m           €2.2m           €1.3m            (€1.9m)               €4.9m        €19.3m

         Sep-18                                                                              Sep-19

(1) Largely attributable to lettings in Observatory and South Dock House in prior financial year
(2) The Investment Management Agreement (“IMA”) expired in Nov-18 and was replaced by a new incentive scheme, which was the primary driver of the net €4.9m saving
(3) Based on weighted average number of shares in issue
Hibernia REIT plc                                                                                                                                  INTERIM RESULTS | NOV 2020      12
Organic rent roll growth opportunity(1)
  €100m
              Rent Reviews/lease         €0.2m
              variations                                                Office under review: €0.9m(3)                                                                 €31.1m(3)            €95.4m
              Lettings                   €1.5m

      €90m    Acquisitions               €0.1m                                                                    2CP: €1.9m(3)                                                                              +€21.3m
                                                   Forum             €2.4m(3)                                    50CQ: €0.3m(3)
              Expiries/breaks/         (€1.1m)                                                                                                                                                                +29%
              surrenders                           Central Quay      €1.4m(3)                                                                                         Harcourt
              Other                      €0.1m     Remainder         €1.2m(3)                                                                                          Square
      €80m

                                                                                                                              €74.1m(2)          Marine House

                                                                                          €0.5m(3,4)                                            Clanwilliam         Clanwilliam                               +€28.9m
                                                                                                                                                   Court
      €70m                                                                                                        +€7.6m                          Harcourt             Court                                   +43%
                                                                          €5.0m
                  €65.7m(2)           €0.8m          €66.5m(2)                                                     +11%                            Square              Marine
Rent

                                                                                                                                                                       House
                                                                                                                                                 (€9.8m)(2)
      €60m

                                       1                                                     2                                                                  3
      €50m                         Delivered                                 Estimated capex of €17.9m(5) to                                  Office development pipeline
                                                                                       complete                                               (estimated capex of €295m(6)
                                                                                                                                                      to complete)
      €40m                                                                                                                                      Book value              €303psf(7)

                                                                                                                                                Cost to build           €550psf(7)

      €30m
                Contracted rent     Movement          Contracted       Vacant assets      Reversion     Committed (unlet) Near term portfolio Rent loss from        ERV of pipeline    Potential rent roll
                  at Mar-20                          in-place rent                                         schemes                           developing pipeline    office schemes    incl. office schemes
                                                       at Sep-20                                                                               office schemes

                                                             Potential to grow rent roll in near term and looking further ahead
(1)    Excl. income potential of possible future mixed-use development schemes
(2)    Excl. Iconic Offices arrangement in Brickhouse (Clanwilliam Court, Block 1). Residential rent on a net basis.
(3)    Based on C&W ERVs @ Sep-20
(4)    Office reversion (€0.4m = €0.9m under review + negative reversion of €0.5m) + residential reversion (€0.1m): €0.4m + €0.1m = €0.5m
(5)    Committed capex (€10.8m on 2 Cumberland Place, 50 City Quay, 2 Windmill Lane) plus estimated capex per valuer assumptions for Forum & other minor capex
(6)    Capex based on current build cost incl. contingency but excl. effect of any future construction cost inflation
(7)    Per buildable sq. ft.; Book value includes present value of remaining existing income of approx. €29psf at Sep-20. Note: standard purchaser costs should be assumed to be 9.92% @ Sep-20.
Hibernia REIT plc                                                                                                                                          INTERIM RESULTS | NOV 2020                    13
Robust balance sheet and no debt maturities until December 2023
 Current facilities                         Quantum                                  Cost                      Capital allocation
                                                                           2.00% margin/0.8%
 RCF due Dec-23                              €320m
                                                                              undrawn fee
 PP note due Jan-26                          €37.5m                           2.36% coupon                                    €150m                                                                        20.0%
                                                                                                                                                                                      18.7%
 PP note due Jan-29                          €37.5m                           2.69% coupon                                                                                                                 17.5%
                                                                                                                              €125m
                                                                                            (1)
 Total                                       €395m                                  2.10%
                                                                                                                                                                                                           15.0%
                                                                                                                              €100m
                                                                                                                                          85m
 Debt statistics                                    Sep-19               Mar-20                   Sep-20                                                                                                   12.5%
                                                                                                                              €75m
Drawn debt                                         €242m                €262m                €288m                                                   39m                                                   10.0%
                                                                                                                                                            40m

                                                                                                           Capital deployed
                                                                                                                                                                        23m
Net debt                                           €222m                €241m                €265m                            €50m                                                                         7.5%

                                                                                                                                                                                                                    LTV
% interest fixed/hedged                             124%                  76%                     69%                                                                   21m
                                                                                                                              €25m        53m                45m                                           5.0%
% unsecured                                         100%                 100%                     100%                                              46m                            4m      11m
                                                                                                                                                                        25m        8m
Weighted average debt maturity                     4.8 years            4.4 years           3.8 years                                                                              9m      16m             2.5%
                                                                                                                               €0m
Cash and undrawn facilities(2)                     €133m                €136m                €103m
                                                                                                                                                                                                           0%
                                                                                                                                                    (35m)              (35m)
                                                                                                                         (€25m)
                                                                                                                                                            (65m)                                          (2.5%)
                                                                                                    (5)
 Headroom vs key covenant              Requirement         At Sep-20                Headroom
                                                                                                                         (€50m)
 Loan to value (gross                                                        Portfolio value could                                                                                                         (5.0%)
                                           1.5x               6.7x
                                                                                  fall 78%
 costs)
                                                                                                                                                                    Actual                    Forecast
                                                                             Net asset value could                                    Asset sales                    Buyback                       Capex
 Net worth (NAV)                          >€400m           €1,167m
                                                                                   fall 66%
                                                                                                                                      Acquisition spend              Net spend                     LTV

                                                                             Through-cycle LTV target remains 20-30%

(1) Assuming RCF fully drawn                                                                                                      (4) Based on LTM interest cover
(2) Net of committed expenditure                                                                                                  (5) At Sep-20
(3) Please note LTV as reported elsewhere is calculated as net debt/portfolio value, giving a figure of 18.7%
Hibernia REIT plc                                                                                                                                                            INTERIM RESULTS | NOV 2020    14
Key financial messages
1. Further growth in distributable income from high quality tenant base
      • EPRA EPS +17.6%
      • Interim DPS +14.3%

2. Modest decline in portfolio value, due to a reduction in office ERVs and yield shift
      • -3.2% in Q1 2020(1)
      • -0.6% in Q2 2020(1)
      • Six monthly TPR of -1.7%(2) vs MSCI Ireland Index of -1.6%(3)

3. Balance sheet strength gives great flexibility
      • Over €100m of cash and undrawn facilities(4) and ability to add further debt to fund investment opportunities
      • No maturities before Dec-23

4. Disciplined capital allocation
      • €25m deployed in accretive share buyback programme
        – At Sep-20, €8.1m shares repurchased for average price of €1.11
        – At completion in Nov-20, 23.1m shares repurchased for average price of €1.08
      • €3.8m invested in bolt-on acquisitions

Outlook
      • Expect market rents to remain under pressure until there is a clear pathway for workers to return to the office
      • Will continue to invest for the long-term: substantial pipeline of exciting opportunities

(1)   Like-for-like change (incl. finance costs) on Investment Property and excluding assets acquired and disposed of during the period
(2)   TPR is calculated on an “all assets” basis as per MSCI
(3)   MSCI / SCSI Ireland Quarterly Property All Assets Index (excl. Hibernia)
(4)   Net of committed expenditure
Hibernia REIT plc                                                                                                                         INTERIM RESULTS | NOV 2020   15
Agenda

     Highlights
     Financial results
     Market update
     Portfolio and development
     update
     Conclusion

Pictured: Car park at Cumberland Place
Hibernia REIT plc                        INTERIM RESULTS | NOV 2020   16
Economic outlook
“K-shaped” recovery expected in Ireland                                                                                                                                 Euro area yield curves* flattening: “lower for even longer”
                                                                                                                                                                        1.25%
                                                                                                   2019                          2020f                    2021f

 GDP                                                                                               5.6%                           (2.5)%                  1.4%          0.75%

 GNP                                                                                               3.4%                           (3.1)%                  1.3%          0.25%
 Domestic demand(1)                                                                                3.3%                           (6.5)%                  3.9%
                                                                                                                                                                    -0.25%
       Construction                                                                                1.1%                         (2.8%)                    1.0%
                                                                                                                                                                    -0.75%
       Personal consumption                                                                        2.0%                         (4.7%)                    3.4%

       Government consumption                                                                      1.2%                         (2.5%)                    (0.4%)
                                                                                                                                                                    -1.25%

 Employment                                                                                        2.9%                        (13.8%)                    7.1%

 Unemployment rate(2)                                                                              5.0%                            15.9%                  10.7%                            31-Mar-20                    Current             31-Mar-20           Current
Source: Department of Finance                                                                                                                                               Source: European Central Bank
(1) Modified Domestic Demand (MDD) is Domestic Demand excl. R&D and aircraft leasing                                                                                        *Note: solid lines are for all bonds and dashed lines are AAA rated bonds only
(2) COVID adjusted unemployment rate
Significant increase in unemployment*…                                                                                                                             …hospitality and retail the most impacted sector

 35.0%                                                                                                                                                                           250,000                                                                                  40%
                                    Standard unemployment rate (%)                                                                                                                             35%           PUP        % PUP of sector employment (RHS)
                                    COVID adj. unemployment rate (%)                                                                                                                                                                                                      35%
 30.0%
                                                                                                                                                                                 200,000
                                                                                                                                                                                                                                                                          30%
 25.0%                                                                                                                                           20.2%
                                                                                                                                                                                                                                                                          25%
                                                                                                                                                                   # of people
                                                                                                                                                                                 150,000
 20.0%
                                                                                                                                                                                                                                                                          20%
 15.0%                                                                                                                                                                           100,000                                                                                  15%
                                                                                                                                                                                                                                                             10%
 10.0%                                                                                                                                                                                                             7%                                                     10%
                                                                                                                                        7.3%                                      50,000                                          5%
  5.0%                                                                                                                                                                                                                                          3%                        5%

  0.0%                                                                                                                                                                                -                                                                                   0%
                                                                                                                                                                                             Hospitality,     Office based Construction &      Other         Total
                  Dec-07
                           Nov-08

                                                                        Jun-13

                                                                                                                               Dec-18
                                                                                                                                        Nov-19
                                    Oct-09

                                                               Jul-12

                                                                                                                                                 Oct-20
                                             Sep-10

                                                                                          Apr-15

                                                                                                             Feb-17
                                                      Aug-11

                                                                                 May-14
         Jan-07

                                                                                                    Mar-16

                                                                                                                      Jan-18

                                                                                                                                                                                            Retail, Arts &   employment*      Industry
                                                                                                                                                                                           Entertainment

Source: CSO                                                                                                                                                               Source: CSO @ Week 44 for PUP claimants and Q2 2020 for number of persons employed in each sector
*the standard rate of unemployment is based on the CSO’s monthly unemployment                                                                                             *Office based employment = Information & communication, Professional, scientific and technical
series and the COVID adjusted unemployment rate assumes all those claiming the Pandemic                                                                                   activities, Administrative and support service activities, Public administration and defence, compulsory
Unemployment Payment (PUP) are unemployed and it is considered an “upper bound”                                                                                           social security, Financial, insurance and real estate activities
Hibernia REIT plc                                                                                                                                                                                                             INTERIM RESULTS | NOV 2020             17
Dublin office rental market
       2020 YTD take-up significantly impacted by COVID-19                                        Vacancy levels likely to remain elevated in near term but rising from a low base
                                                                                                                                                                                      11.5%                       (1)
                   4.0m                                                                                                                                                               11.0%                 11.20%
                                                                                                                                                                                      10.5%
                   3.5m                                                                                                                                                               10.0%                                     (2)
                   3.0m                                                                             25.0%                                                                              9.5%                               10.20%
                                                                                                                                                                                       9.0%
  Area (sq. ft.)

                   2.5m                                                                             20.0%                                                                              8.5%        8.9%

                   2.0m                                                                                                                                                                8.0%
                                                                                                    15.0%                                                                                            Q3 2020            2021E
                   1.5m
                   1.0m                                                                             10.0%
                   0.5m
                                                                                                     5.0%
                   0.0m
                                                                                                     0.0%

                          Net Take-Up         Gross Take-Up          10 Yr. Avg. Gross Take-Up      (1)     Assumes no further lettings of stock scheduled to be delivered by end of 2021 and no other lettings in the market. Excludes the

        Source: Knight Frank @ 30 Sept 20                                                             effect of additional grey/shadow market coming back into the market. i.e. overall net take-up over the period is zero
                                                                                                    (2)     Assumes no new lettings in 2020 and 500k sq. ft. net absorption in 2021
                                                                                                    Source: Knight Frank/Hibernia

        Some softening in prime headline rent, reflecting uptick in vacancy                         Dublin office market much better positioned than 2008
€70psf                                                                                                                                                                          Pre-GFC                         Pre-COVID
€65psf                                                                                               All Dublin office market                                                  (Mar-08)                          (Mar-20)

€60psf                                                                                               Prime Dublin headline office rent                                       €65.00psf(1)                       €62.50psf(1)
€55psf
                                                                                                     Vacancy rate                                                              12.3%(1)                            6.5%(1)
€50psf
                                                                                                     Stock under construction                                              5.1m sq. ft. (2)                   5.5m sq. ft. (3)
€45psf
€40psf                                                                                               Stock under construction that is un-let                               4.6m sq. ft. (2)                        3.0m(3)
€35psf                                                                                               Under construction as a % of total stock                                  16.6%(2,4)                         12.6%(3)
€30psf
                                                                                                     Under construction but not yet let as a %
€25psf                                                                                                                                                                         14.9%(2,4)                          6.9%(3)
                                                                                                     of total stock
                     Jun-06

                     Jun-07

                     Jun-08

                     Jun-09

                     Jun-10

                     Jun-11

                     Jun-12

                     Jun-13

                     Jun-14

                     Jun-15

                     Jun-16

                     Jun-17

                     Jun-18

                     Jun-19
                     Dec-05

                     Dec-06

                     Dec-07

                     Dec-08

                     Dec-09

                     Dec-10

                     Dec-11

                     Dec-12

                     Dec-13

                     Dec-14

                     Dec-15

                     Dec-16

                     Dec-17

                     Dec-18

                     Dec-19
                     Sep-20

                                                                                                    (1)   Knight Frank                                    (4) End 2007 stock
                                                                                                    (2)   Property Market Analysis (PMA)
          Source: Knight Frank @ 30 Sept 20
                                                                                                    (3)   Hibernia/Knight Frank

                                    Office occupational market expected to remain challenging until there is a clear pathway for workers returning to offices
        Hibernia REIT plc                                                                                                                                        INTERIM RESULTS | NOV 2020                          18
Expected CBD Dublin office development supply
                               Dublin CBD(1) office development pipeline @ May 20                                                              Dublin CBD(2) office development pipeline @ Nov 20
                                                                                • CBD forecast supply 2020-23  5% to 5.4m sq. ft.
                                                                                • Some delays seen between years

                         4.0                                                                                                             4.0

                                   May              50% of space currently under                                                                  Nov               47% of space currently under construction is
                         3.5       2020             construction is pre-let                                                              3.5      2020              pre-let

                         3.0                                                                                                             3.0

                         2.5                                                                                                             2.5

                                                                                                                 Potential sq. ft. (m)
                                      Knight Frank 2019 CBD take-up: 2.2m sq. ft.
 Potential sq. ft. (m)

                                                                                                                                                    Knight Frank 2019 CBD take-up: 2.2m sq. ft.
                                                                        2.2m                                                                                                           2.1m
                         2.0                                                                                                             2.0
                                   1.8m                                                                                                          1.8m
                                          Knight Frank 10yr avg. CBD                                                                                    Knight Frank 10yr avg. CBD
                                          take-up: 1.5m sq. ft.                                                                                         take-up: 1.5m sq. ft.
                         1.5                                                                                                             1.5
                                                           1.3m                                                                                                                                             1.2m
                                                                                                    1.4m                                                                                          1.1m
                         1.0                                                                                                             1.0                              1.0m
                                                                                     0.8m
                                               0.7m                                                                                                          0.7m
                         0.5                                                                                                             0.5

                         0.0                                                                                                             0.0
                                   2018        2019         2020        2021         2022          2023                                          2018        2019         2020         2021       2022      2023

                                          Actual                             Forecast                                                                   Actual                             Forecast
                                                   Expected year of completion                                                                                   Expected year of completion
                                              Completed         Under construction          Probability weighted pipeline                          Pre-let/let         All potential schemes

Source: Knight Frank/Hibernia
(1) Restated at Sep-20 to include Ballsbridge submarket as part of CBD pipeline. Ballsbridge is approx. 2m sq. ft. of total CBD stock
(2) Including Ballsbridge submarket
Note: Total Dublin CBD office market including Ballsbridge is 22m sq. ft.

                                               Some delays to commencements and live sites occurring with expectations for delivery out to 2023 reduced
Hibernia REIT plc                                                                                                                                                            INTERIM RESULTS | NOV 2020    19
Expected Dublin office development supply
                                Total Dublin office development pipeline incl. suburbs @                                                        Total Dublin office development pipeline incl. suburbs @
                                                         May 20                                                                                                           Nov 20
                                                                                        • Dublin forecast supply 2020-23  6% to 7.1m sq. ft.
                                                                                        • Some delays seen between years

                                                                                                                                               4.0
                        4.0         May                     46% of space currently under                                                              Nov                   43% of space currently under construction is
                                                            construction is pre-let                                                                   2020                  pre-let
                                     2020
                                                                                                                                               3.5
                        3.5                                                                                                                            Knight Frank 2019 take-up: 3.3m sq. ft.
                                      Knight Frank 2019 take-up: 3.3m sq. ft.

                                                                                                                                               3.0
                        3.0
                                                                                                                                                       Knight Frank 10yr avg.
                                       Knight Frank 10yr avg.                 2.7m
                                                                                                                                                       take-up: 2.5m sq. ft.
                                       take-up: 2.5m sq. ft.                                                                                   2.5
                        2.5

                                                                                                                       Potential sq. ft. (m)
                                                                                                                                                                                              2.2m
Potential sq. ft. (m)

                                                                                                                                                     2.2m
                                   2.2m
                                                                  2.0m                                                                         2.0
                        2.0
                                                                                                     1.7m                                                                         1.7m                   1.6m
                                                                                                                                                                                                                    1.6m
                                                                                                                                               1.5
                        1.5
                                                     1.2m                                  1.2m                                                                      1.2m

                        1.0                                                                                                                    1.0

                        0.5                                                                                                                    0.5

                        0.0                                                                                                                    0.0
                                   2018              2019         2020        2021         2022      2023                                            2018            2019         2020         2021       2022      2023

                                            Actual                                 Forecast                                                                 Actual                                 Forecast
                                                               Expected year of completion                                                                                     Expected year of completion
                                                       Completed          Under construction      Probability weighted pipeline                         Pre-let/let            All potential schemes
                        Source: Knight Frank/Hibernia
                        Note: Total Dublin office market is 44m sq. ft.

                                                            Some delays to commencements and live sites occurring with expectations for delivery out to 2023 reduced
                        Hibernia REIT plc                                                                                                                                             INTERIM RESULTS | NOV 2020    20
Dublin investment market
Yield progression in key Dublin property sectors                                                                               Robust Dublin investment demand at Sep-20
                                                                                               Change YoY*
                                                 Sep-19       Mar-20         Sep-20           bps        %                      Sector                                   Investment demand Mar-20 Investment demand Sep-20
 Office(1)

                                                                                                                                                                                                                                     
                                                                                                                                Office                                               €3.5bn                      €3.5bn
   Prime                                         4.00%        4.00%          4.00%         0bps            0%
   Second. asset; prime location                 4.75%        4.75%          4.75%         0bps            0%                   Private Rental Sector (residential)                  €3.0bn                      €3.0bn
   Second. asset; second. location               5.25%        5.50%          5.75%        +50bps          +9.5%
                                                                                                                                Retail                                               €0.0bn                      €0.0bn
 Residential(2)
   Prime (% net)                                 4.05%        4.00%          4.00%         -5bps           -1.2%                Industrial                                           €1.0bn                      €1.5bn            
 Industrial(3)
                                                                                                                                Total                                               €7.5bn                       €8.0bn
   Prime                                         5.10%        5.00%          5.00%        -10bps           -2.0%
* Sep-20 vs Sep-19                                                                                                             Source: Knight Frank
Source: (1) Knight Frank (2) Cushman & Wakefield, mid of range (3) CBRE

Dublin prime office yields and spreads competitive among European peers
10.00%

  8.00%

  6.00%

  4.00%

  2.00%

  0.00%

 -2.00%
               Brussels

                                     Amsterdam

                                                                                                       Berlin

                                                                                                                                     Munich
                                                    Vienna

                                                                 Bucharest

                                                                                                                                                          Warsaw

                                                                                                                                                                                                               Milan
                                                                                                                                                                      London

                                                                                                                                                                                                      Prague
                                                                                          Budapest

                                                                                                                   Frankfurt
                                                                              Barcelona

                                                                                                                                                Madrid

                                                                                                                                                                                              Paris
                          Dublin

                                                                                                                                                                                Geneva

                                                                                                                                                                                                                          Moscow
                                                             Prime office yield                 10yr gov. bond yield                     Prime office yield spread over bond

Source: Knight Frank/Financial Times

                                                                              Investment demand and prime yields broadly stable

Hibernia REIT plc                                                                                                                                                                  INTERIM RESULTS | NOV 2020             21
Agenda

    Highlights
    Financial results
    Market update
    Portfolio and development
    update
    Conclusion

  Pictured: CGI of development scheme at Clanwilliam Court, Dublin
Hibernia REIT plc                                                    INTERIM RESULTS | NOV 2020   22
Portfolio contracted income
                Whole portfolio:                                                    Office portfolio:                                        Acquired in-place office portfolio:
             contracted rent €66.5m                                              contracted rent €58.2m                                          contracted rent €25.5m

     Industrial/Land                                                    Committed office development un-let                                  Potential incremental rent from near
     Industrial/Land:                     3%                            Contracted rent:                       €0.0m                         term pipeline of €21.3m
     Contracted rent:                     €2.0m                         ERV:                                   €2.2m/€55psf
     ERV:                                 €2.0m                         Committed office development pre-let
                                                                        Contracted rent:                       €1.5m/€61psf                  Near term development pipeline
                                                                        ERV:                                   €1.4m /€59psf                 Contracted rent:                       €9.9m/€42psf
     Residential                                                                                                                             ERV:                                   €9.9m/€42psf
     Residential:                         9%                            Completed office development
                                                                                                                                             WAULT to review:                       1.7yrs
     Contracted rent:                     €6.3m                         Contracted rent:                       €31.3m/€54psf
                                                                                                                                             WAULT to break:                        1.7yrs
     ERV:                                 €6.4m(1)                      ERV:                                   €31.1m/€54psf
                                                                                                                                             % rent upward only:                    0%
                                                                        WAULT to review:                       2.4yrs
                                                                                                                                             % rent cap & collar:                   0%
                                                                        WAULT to break:                        8.6yrs
     Office                                                             % rent upward only:                    0%
     Office:                              88%                           % rent cap & collar:                   29%                           Investment assets
     Contracted rent:                     €58.2m/€51psf                                                                                      Contracted rent:                       €15.5m/€51psf
                                                                        Acquired in-place office
     ERV:                                 €58.6m(1)/€51psf                                                                                   ERV:                                   €16.1m/€52psf
                                                                        Contracted rent:                       €25.5m/€47psf
     WAULT to review:                     2.3yrs                                                                                             WAULT to review:                       2.1yrs
                                                                        ERV:                                   €26.1m/€48psf
     WAULT to break:                      6.2yrs                        WAULT to review:                       2.0yrs                        WAULT to break:                        4.1yrs
     % rent upward only:                  7%                            WAULT to break:                        3.2yrs                        % rent upward only:                    26%
     % rent cap & collar:                 15%                           % rent upward only:                    16%                           % rent cap & collar:                   0%
                                                                        % rent cap & collar:                   0%

(1) Excl. vacant space: Residential €0.4m, office €6.7m (€50psf) (in-place office €4.5m (€48psf), committed office un-let €2.2m (€55psf))
Note: Contracted rent includes residential rent on a net basis and excludes The Brickhouse; small differences in summation due to rounding

                                                     Office portfolio has long WAULTs except for near term development assets
Hibernia REIT plc                                                                                                                                    INTERIM RESULTS | NOV 2020              23
Office portfolio statistics
                                               Sep-19                           Mar-20                          Sep-20
                                                                                                                                   (1) Excl. arrangement with Iconic Offices at Block 1 Clanwilliam
 All office contracted   rent(1)               €54.3m             +6%          €57.7m         +1%             €58.2m
                                                                                                                                   (2) To earlier of break or expiry
 In-place office contracted rent(1)            €54.3m             +6%          €57.7m         -2%             €56.7m
                                                                                                                                   (3) By net lettable office area. Office area only (i.e. excl.
 In-place office WAULT(2)                       6.9yrs            -7%          6.4yrs         -5%              6.1yrs                retail, basement space, gym, Townhall etc.)
                                                                                                                                   (4) Excl vacancy in near term developments (Marine & Clanwilliam).
 In-place office vacancy(3)                      12%              -5pp           7%             -                7%(4)                 Incl. Marine & Clanwilliam, the vacancy rate would be 10%

                      Portfolio by area                                            Industry split of in-place tenants                              Top 10 tenants of in-place portfolio
                                                  (1)
                      1.5m sq. ft.                                                 €56.7m                                                          €56.7m
                                                                                         1%            Co-working
                                                                                         2%                                                                3%              ComReg
                                                                                         3%            Other
                                                Near-term                                              Insurance & Reinsurance                             3%
                           289k sq. ft.                                                  4%                                                                3%              BNY
                                                pipeline                                               Media & Telecommunications                          3%
                                                                                         7%                                                                4%              Travelport
                                                Committed                                                                                                  5%              Riot Games
                           62k sq. ft.                                                   13%           Professional Services
                                                development                                                                                                5%              Informatica
                                                                                                                                                           9%              Autodesk
                                                In-place office                                                                                                            Zalando
                                                                                         18%           Banking & Capital Markets
                                                portfolio                                                                                                 11%              Twitter
                                                                                                                                                                           OPW
                                                                                                                                                                           HubSpot
                                                                                                       Government Agency                                  19%
                                                                                                                                                                           Remainder
                         1,137k sq. ft.

                                                                                                       Technology
                                                                                         53%

                                                                                                                                                          36%

(1) Office areas only (i.e. excl. retail, basement space, gym, townhall etc.)
Hibernia REIT plc                                                                                                                                    INTERIM RESULTS | NOV 2020                    24
Office leases agreed and schedule of upcoming lease events(1)
Office lease agreements since March 2020
                                                                  Area                              Contracted rent            Contracted                   To                To
 Tenant                                    Building             (sq. ft.)        Lease event              €m                 rent vs. last ERV             break            expiry         Notes

                                       2 Cumberland                24k            New lease                €1.5m                    Ahead                  10yrs            10yrs          •    To commence in 2021

 Total in HY21                                                     24k                                     €1.5m                    Ahead                  10yrs            10yrs

                                                                                                                                                                                           •    Signed Nov-20
                                        Central Quay               12k            New lease                €0.6m                    In line                 6yrs            10yrs
                                                                                                                                                                                           •    +€0.2m incremental rent

Schedule of upcoming lease events for in-place office portfolio(1,2,3,4)
                                                                                     Contracted in-place office rent(3): €56.7m
                                                                       ClanW
                                                                         1CP                                    Central Quay
                                                                         1DC                                        2DC
                                                                     One Earlsfort                                Harcourt                                                                           Central Quay
 €18m                                                                Observatory                                   1WML                                                                                 1SJRQ
                                                                     SOBO Works                                 Observatory                                                                             2WML
 €16m                                                                                                                                                                                                Observatory
                                                                                                                                                                                                   South Dock House
 €14m
                          Central Quay
 €12m                        ClanW
                            Marine                                                                                                                           Forum
 €10m                         1DC                                                                                                                           Hardwicke
                              2DC                                                                                                                           Montague
                           Hardwicke                                                                                                                         1WML
      €8m
                          SOBO Works
      €6m

      €4m

      €2m

      €0m
  Twelve months             Mar-21                                     Mar-22                                     Mar-23                                     Mar-24                                     Mar-25
  ended:
                  Rent review            Expiry - remainder              Expiry - near term development                  ERV @ Sep-20 - remainder                  ERV @ Sep-20 - near term development (4)

(1)    To earlier of rent review or lease expiry. Note that of the rent due for rent review, €9.0m of this income is capped & collared at next review and a further €4.0m is subject to upward only rent review provisions
(2)    Note: €5.7m of income is subject to break options in the period from now to Mar-25
(3)    Note: excl. 3M letting at 2CP as committed development at Sep-20
(4)    Assuming space re-let at same rent as is currently contracted
Hibernia REIT plc                                                                                                                                                            INTERIM RESULTS | NOV 2020                      25
Committed developments

       2 Cumberland Place, D2
       • 58,000 sq. ft. of new Grade A offices

       • 41% pre-let following 3M leasing in
         Apr-20 (ahead of ERV)(1)

       • Total office space at Cumberland Place post-
         completion will be c.190,000 sq. ft.

       • Completion now expected in Jan-21 due to
         COVID-19 restrictions. Project remains on
         budget

 Pictured: 2 Cumberland Place nearing completion

                                              Total area post               Full                             Est. total cost                       Office
 Sector               Property              completion (sq. ft.)      purchase price(2)     Est. capex      (incl. land) €psf       ERV(3)        ERV psf(3)     PC date

  Office 2 Cumberland Place, D2                  58k office                  €0m               €35m               €605psf(4)        €3.3m         €56.53psf      Jan-21
                                                1k retail/café

  Office          50 City Quay, D2                 5k office                 €3m              €1.4m              €935psf            €0.3m         €55.00psf      Jan-21

(1)   In April 2020, the Group entered into a pre-let with 3M for the 4th, 5th and 6th floors (24k sq. ft.) on a 10 year lease ahead of the September 2019 ERV
(2)   Including acquisition costs
(3)   Headline office ERV as per C&W @ Sep 20
(4)   Office demise only
Hibernia REIT plc                                                                                                                                          INTERIM RESULTS | NOV 2020   26
Committed developments

    50 City Quay, D2
    • 4,500 sq. ft. of office space refurbished to a
      high standard

    • Building faces the River Liffey

    • Forms part of the Windmill Quarter and
      tenants will have access to all the amenities
      of the Quarter

    • Marketing commenced in Autumn 2020

Pictured: CGI of refurbished 50 City Quay with 1SJRQ in the
background

                                          Total area post            Full                        Est. total cost              Office
 Sector             Property            completion (sq. ft.)   purchase price(1)   Est. capex   (incl. land) €psf   ERV(2)   ERV psf(2)   PC date

 Office 2 Cumberland Place, D2               58k office              €0m             €35m            €605psf(3)     €3.3m    €56.53psf    Jan-21
                                            1k retail/café

 Office       50 City Quay, D2                 5k office             €3m            €1.4m           €935psf         €0.3m    €55.00psf    Jan-21

(1) Including acquisition costs
(2) Headline office ERV as per C&W @ Sep 20
(3) Office demise only
Hibernia REIT plc                                                                                                                   INTERIM RESULTS | NOV 2020   27
Development pipeline progress
                                                                 Pictured: CGI of development scheme at Clanwilliam Quarter

    Clanwilliam Quarter, D2
    • Final planning received for Clanwilliam Court and Marine
      House in the period

    • >200,000 sq. ft. office scheme including 11,000 sq. ft.
      retail / leisure

    • Strategic location in Traditional Core but near Grand
      Canal Dock

    • Lease expiries through 2021 so project can commence in
      early 2022

    Future proofing our development pipeline

    • The Clanwilliam Quarter is designed to meet evolving
      occupiers’ needs:

  Collaborative space (eg townhall /
  communal areas)                                   ✓
  Air + light quality                               ✓
  Health + fitness amenities                        ✓
  Near public transport                             ✓
  Strong ESG credentials                            ✓
Hibernia REIT plc                                                   INTERIM RESULTS | NOV 2020            28
Development pipeline progress
                                                                   Pictured: CGI of development scheme at Harcourt Square

     Harcourt Square, D2
     • Planning granted for 337,000 sq. ft. office development
       scheme(1) (+9% on previous planning)

     • Site is a short walk from St. Stephen’s Green in Dublin’s
       Traditional Core

     • Existing lease expires in Dec-22, so project can
       commence thereafter

     Future proofing our development pipeline

     • Harcourt Square is designed to meet evolving occupiers’
       needs:

  Collaborative space (eg townhall /
  communal areas)                                    ✓
  Air + light quality                                ✓
  Health + fitness amenities                         ✓
  Near public transport                              ✓
  Strong ESG credentials                             ✓

(1) 343k sq. ft. including reception areas
Hibernia REIT plc                                                          INTERIM RESULTS | NOV 2020           29
Agenda

     Highlights
     Financial results
     Market update
     Portfolio and development
     update
     Conclusion

Pictured: CGI of top floor office space at 50 City Quay

Hibernia REIT plc                                         INTERIM RESULTS | NOV 2020   30
Conclusion and outlook
Resilient performance in challenging market conditions

    • EPRA NTAPS -4.1%
    • EPRA EPS +17.6% / interim DPS +14.3%

High quality tenant base and low financial risk

    • Strong rent collection statistics
    • LTV of 18.7% at Sep-20, no maturities before Dec-23

Office market expected to remain challenging until clear pathway for workers to return…

    • Rising Dublin office vacancy putting market rents under pressure

…we still believe in long-term prospects for appropriately configured offices in Dublin’s CBD

    • Important for staff collaboration, creativity and team culture

Exciting near-term development opportunities with low break-evens

    • Can start on 539,000 sq. ft. of Grade A office space in next two years

Hibernia REIT plc                                                                               INTERIM RESULTS | NOV 2020   31
Hibernia REIT plc   INTERIM RESULTS | NOV 2020   32
Appendix

Pictured: Dublin’s North Docks and the River Liffey as seen from 1SJRQ

                                                                         INTERIM RESULTS | NOV 2020   33
Location of Hibernia portfolio

Dublin overview                                                                                                                  Central Dublin portfolio(1)

                                                                                                                                            19                                                                       20
                                                                  Dublin
                                                                  Airport                                                                                                                                Fairview
                                                                                                                                                                                                          Fairview
                                   The Ward                                                                                                                              Croke
                                                                                                                                                                          CrokePark
                                                                                                                                                                                Park                     Park
                                                                                                                                                                                                          Park
                                                                              M1
                                                                                                       Portmarnock
                                              N2/M2
                  Northwest
                  Business Park                            M50
                                                                                           Northern
                                                                                           Cross
                  N3/M3                                    Ballymun
                                                                                                             Sutton
Blanchardstown                                                                        20
                                                                        Beaumont                                         Howth          Kings                                                                          1   Wyckham Point
                                                                                                            North Bull                  Inns
                                                                                                                                                                                                                       2   Gateway Lands
                                                      19                                                    Island
                     Castleknock                           Drumcondra          Clontarf                                                                                                             8                  3   Montague House
                                                                                                                                                                                       10
      N4/M4                                    Phibsborough                                                                                                                                         9                  4   Hardwicke House

         Palmerstown                                                                                                                                                                    River Liffey                   5   2WML
                                                           Dublin                                                                                                                          11 7                        6   1WML
                                                                      CBD
                                                                                                                                                                                               6    5     15           7   Observatory
                                                           N81             18                                                     2
                                                                                                                                                                                                                       8   Two Dockland Central
                                                                      Ballsbridge                                                                                               12
                                                                                                                                                                                                                       9   One Dockland Central
Clondalkin                                  Kimmage
                                                                                                                                                                                                                      10   The Forum
  N7/M7            2
                        Ballymount                                                                                                                                                                                    11   1SJRQ
                                                                                                                                                          St.
                                                                                    Blackrock                                                                                                      17
                                                                                                                                                       Stephens                                                       12   1&2 Cumberland
                                              Rathfarnham                                                                                               Green                                                              Place

                                      M50                          Dundrum
                                                                                                                                                                                                    18                13   Harcourt Square
                                                            1    14                                                                                    4
                                                                                                                                                             16                                                       14   Dundrum View
                Tallaght                                                                                                                          13
                                                                                                                                                       3                                                                      20
                                                                                                                                                                                                                      15   Central Quay
                                                                                                 N11
  1     Wyckham Point                                                                                   Glenageary                                                                                                    16   One Earlsfort Terrace
  2     Gateway Lands
                                                                                                                                                                                                                      17   Marine House &
                                                                                           M50                                                                                                                             Clanwilliam Court
 14     Dundrum View
                                                                                                                                                                                                                      18   Cannon Place
 18     Cannon Place
                                                                                                                                                                                                                      19   Dublin Industrial
 19     Dublin Industrial Estate
                                                                                                                                                                                                         Herbert           Estate
 20     Malahide Road                                                                                                                                                       1   14                       Park         20   Malahide Road

                                                                                                                                 Key:    Office            Residential                      Industrial             Office development

Source: Google Maps, Visit Dublin, Jones Lang LaSalle
(1) Property assets > €7.5m in value as at 30 Sept 2020
Hibernia REIT plc                                                                                                                                                                    INTERIM RESULTS | NOV 2020                           34
Portfolio summary at September 2020

                                                          Value as at                                             Yield on value %(1)                    Passing
                                                            Sep-20            % of                                                                        rent          Contracted
                                                         (all assets)*      portfolio                Initial         Equivalent    Reversionary           (€m)           rent (€m)         ERV (€m)

 1. Dublin CBD Offices

 Traditional Core                                            €413m              29%              5.0%(2)                5.1%(2)         5.1%(2)         €22.3m            €22.3m              €23.1m

 IFSC                                                        €191m              13%                   3.9%                4.8%           5.1%             €8.3m             €8.3m             €11.0m

 South Docks                                               €540m(3)             38%                   4.3%                4.4%           4.4%           €26.1m            €26.1m              €27.5m

 Total Dublin CBD Offices                                €1,145m(3)            81%               4.5%(2)                4.7%(2)         4.8%(2)         €56.7m            €56.7m              €61.7m

 2. Dublin CBD Office Developments(4)                          €56m              4%                           -                -              -                  -          €1.5m              €3.6m

 3. Dublin Residential(5)                                  €164m(6)            12%               3.7%(7)                4.1%(7)         4.5%(7)         €6.3m(7)          €6.3m(7)           €6.8m(7)

 4. Industrial/Land                                            €56m              4%              3.2%(8)                3.2%(8)         3.4%(8)           €1.8m             €2.0m              €2.0m

 Total Investment Portfolio                             €1,421m(3,6)          100%            4.3%(2,7,8)            4.6%(2,7,8)    4.7%(2,7,8)       €64.8m(7)         €66.5m(7)          €74.1m(7)

*Note: Per RICS guidance C&W have highlighted material uncertainty in their Sep-20 valuations           (5)Includes 1WML residential element (Hanover Mills)
due to COVID-19. This applies to all assets with the exception of “3. Dublin Residential”.              (6)Valuation assuming 80% net-to-gross and purchaser costs as per C&W @ Sep-20
(1) Yields on unsmoothed values and excluding adjustment for 1WML owner-occupied space                  (7)Residential income on net basis assuming Hibernia cost
(2) Harcourt Square, Clanwilliam Court & Marine House yields are calculated as the passing rent         (8)Current rental value assumed as ERV as these assets are valued using a combination of price per
    over the total value (after costs) which includes residual land value. Excludes Iconic Offices         acre and on an income basis
    income at Brickhouse in Clanwilliam Court                                                           Note: differences in summation of totals in the above table are due to rounding
(3) Excludes the value of space occupied by Hibernia in 1WML
(4) 2 Cumberland Place and 50 City Quay

Hibernia REIT plc                                                                                                                                        INTERIM RESULTS | NOV 2020             35
Portfolio performance since March 2020

                                                        Value                                              Reval Q1         Reval Q2            Value            LfL change        LfL change
                                                     (all assets)      Capex         Acquisitions(1)       (Apr-Jun)        (Jul-Sep)        (all assets)            (€m)              (%)

                                                      Mar-20*                                                                                 Sep-20*

 1. Dublin CBD Offices

 Traditional Core                                      €435m          (€0.2m)               -               (€18m)            (€4m)            €413m               (€21m)            (4.9%)

 IFSC                                                  €205m              -                 -               (€8m)             (€6m)            €191m               (€14m)            (6.6%)

 South Docks                                          €555m(2)         €0.5m             €3.4m              (€13m)            (€5m)           €540m(2)            (€18m)(2)         (3.2%)(2)

 Total Dublin CBD Offices                           €1,194m(2)         €0.3m             €3.4m              (€38m)           (€15m)         €1,145m(2)            (€52m)(2)         (4.4%)(2)

 2. Dublin CBD Office Development                      €51m            €8.4m                -               (€3m)             (€0m)            €56m                 (€3m)            (5.1%)

 3. Dublin Residential                                 €159m           €0.1m             €0.4m              (€2m)              €6m             €164m                 €4m              2.6%

 4. Industrial/Land                                    €61m               -                 -               (€4m)             (€1m)            €56m                 (€5m)            (8.4%)

 Total Investment Portfolio                         €1,465m(2)         €8.8m             €3.8m              (€47m)           (€10m)         €1,421m(2)            (€56m)(2)         (3.8%)(2)

*Per RICS guidance, C&W have highlighted material uncertainty in their Sep-20 valuations due to COVID-19, with the exception of assets classed as 3. Dublin Residential. At Mar-20, the material
valuation uncertainty clause was in place for valuations of all assets.
(1) Including acquisition costs
(2) Excludes the value of space occupied by Hibernia in 1WML
Note: At Mar-20, 50 City Quay was within the South Docks segment. At Sep-20, 50 City Quay was undergoing a substantial refurbishment so has been moved to Dublin CBD Office Development. This
transfer explains differences in South Docks and Dublin CBD Office Development at Mar-20 vs that presented in Hibernia’s Preliminary Results in May-20.
Note: Differences in summation of totals in the above table are due to rounding
Hibernia REIT plc                                                                                                                                  INTERIM RESULTS | NOV 2020            36
Vacant offices and office leases under review
Vacant office(1) space at September 2020
                                               Area                % of portfolio             Sep-20                    Sep-20
 Building                                    (sq. ft.)               vacancy                 ERV(2) (€)               ERV(2) (€psf)         Comment

 The Forum                                       47k                    4%                    €2.2m                       €47.00            • Marketing space

                                                                                                                                            • Marketing space
 Central Quay                                    25k                    2%                    €1.3m                       €52.75
                                                                                                                                            • Since Sep-20, 12k sq. ft. has been leased to Hines

 Other                                           11k                    1%                    €0.4m                          –              • Marketing space

 Total                                           82k                   7%(1)                  €3.9m

Office leases currently under review

                                       Review                Area              Contracted             % of Group
 Building                               date               (sq. ft.)            rent €m             contracted rent       Expected uplift       Notes

 Hardwicke House                        Jul-18               30k                 €1.0m                    2%               Double digit %       • Two rent reviews active

 2DC                                   Apr-20                16k                 €0.8m                    1%                     Modest         • One rent review active

 1DC                                   Apr-20                16k                 €0.8m                    1%                     Modest         • One rent review active

 Total                                                       62k                 €2.6m                    4%

                                                                    ERV of vacancy across entire portfolio(3) of €5.0m

(1) Exc. currently vacant but near term office developments: Clanwilliam (
Development pipeline: office
                                                                            Area post        Full
                                                            Current area   completion      purchase
                                                  Sector      (sq. ft.)      (sq. ft.)      price(1)   Comments

 Office

 Marine House                                      Office       41k              50k       €30m        • Full planning granted for refurbishment and extension of
                                                                                                         Marine House to provide 50k sq. ft. of office accommodation
                                                                                                         (+22% on existing area)
                                                                                                       • Lower ground floor planning application approved in Aug-20
                                                                                                         which added approx. 1.5k sq. ft. (included within 50k sq. ft.)
                                                                                                       • Ability to obtain vacant possession during 2021

 Clanwilliam                                       Office       93k        141k office     €59m        • Redevelopment opportunity post 2021
 Court                                                                                                 • Potential to increase the existing NIA by 63% and create an
                                                                           11k ancillary
                                                                                                         office cluster similar to Windmill Quarter (with Marine)
                                                                                                       • Final planning grant received Aug-20

 Harcourt Square                                   Office      122k        337k office     €77m        • Leased to OPW until Dec-22
                                                                                                       • Site offers potential to create cluster of office buildings with
                                                                                                         shared facilities or a major HQ
                                                                                                       • Planning granted for 337k sq. ft. of offices (343k incl.
                                                                                                         reception areas), +9% over previous planning and +176%
                                                                                                         over existing area
 One Earlsfort                                     Office       22k            28k         €20m        • Current planning permission for two extra floors (6k sq. ft.),
 Terrace                                                                                                 expiring Jul-21
                                                                                                       • Potential for redevelopment as part of wider Earlsfort
                                                                                                         Centre scheme

 Total                                                         278k           567k         €186m

(1) Including transaction costs and capex spent to date
Hibernia REIT plc                                                                                                               INTERIM RESULTS | NOV 2020        38
Development pipeline: mixed-use
                                                                                           Full
                                                                            Area post    purchase
                                                           Current area    completion     price(1)   Comments

 Mixed-use

 Newlands                                                  143.7 acres        N/A       €48m(2)      • Strategic transport location
 (Gateway)                                                                                           • Potential for future mixed-use redevelopment subject to
                                                                                                       rezoning

 Dublin Industrial                                            119k on         N/A        €11m        • Strategic transport location
 Estate                                                      6.8 acres                               • Potential for future mixed-use development subject to
                                                                                                       rezoning

 Malahide Road                                            66k warehouse       N/A         €8m        • Potential for future mixed-use development subject to
                                                           17k ancillary                               rezoning
                                                              office
                                                           on 3.8 acres

 Total mixed-use                                           154.3 acres       N/A         €67m

(1) Including transaction costs and capex spent to date
(2) Initial consideration
Hibernia REIT plc                                                                                                           INTERIM RESULTS | NOV 2020     39
Gateway/Newlands Cross
                                                                                                       20 mins                                   City Centre
Summary financial statements
Balance sheet highlights                                     Summary income statement
                                                                                                                       6 mths to    6 mths to
€ '000                              30-Sep-20   31-Mar-20    € '000                                                    30-Sep-20    30-Sep-19

Investment properties               1,420,886   1,465,183    Revenue                                                      36,672      33,717

Other non current assets              18,518       19,414    Rental income                                                33,263      29,749

                                                             Property expenses                                            (1,243)     (1,171)
Cash and cash equivalents             29,341       28,454
                                                             Net rental income                                            32,020      28,578
Trade and other receivables             6,107       3,751
                                                             Administrative expenses                                      (4,642)     (4,656)
Gross assets                        1,474,852   1,516,802
                                                             Variable remuneration                                        (1,029)     (1,044)
Current liabilities                  (21,980)     (25,567)
                                                             Expected credit losses                                         (213)          (53)
Liabilities (non-current)           (285,811)   (260,086)
                                                             Net finance (costs)                                          (3,712)     (3,586)
Net assets                          1,167,061   1,231,149
                                                             Revaluation & other income/(expense):
Equity share capital                 650,680      700,499
                                                             Investment properties revaluation gains / (losses)          (56,891)         6,288
Retained earnings                    654,098      638,267
                                                             Other gains/ (losses)                                            15           (28)
Dividends paid/Share Buy-back       (142,518)   (112,996)
                                                             Tax credit                                                      208            26
Other reserves                          4,801       5,379
                                                             Total revaluation gain / (loss) /other income:              (56,668)         6,286
Total equity                        1,167,061   1,231,149    Profit / (loss) for the period                              (34,244)     25,525
IFRS NAV per share (cent)               172.5       179.8    Diluted IFRS EPS (cent)                                        (5.0)           3.7
Diluted IFRS NAV per share (cent)       171.9       179.2    EPRA earnings                                                22,439      19,284

EPRA NTA per share (cent)               171.9       179.2    EPRA EPS (cent)                                                  3.3           2.8

 Hibernia REIT plc                                                                                     INTERIM RESULTS | NOV 2020    41
Selected investment transactions (9 months to Sep 2020)
Office
                                                                                                Buyer                                                 Purchase price
#     Property                         Location                        Buyer                  Nationality                        Seller                   (€m)       Cap. value (€psf)

1     Bishop's Square                  Dublin 2                         GLL                                                      Hines                    €183m            €1,003

2     The Treasury Building            Dublin 2                       Google                                      Percy Nominees & Jayfield Ltd           €115m            €923

3     2 Burlington Road                Dublin 4                        KGAL                                               Henderson Park                  €94m             €1,090

                                                           AXA IM - Real Assets & BCP
4     La Touche House                  Dublin 1                                                                               Credit Suisse               €84m             €877
                                                                     Capital

5     30-33 Molesworth Street          Dublin 2                       KanAm                                               Henderson Park                  €60m             €1,007

                                                                                                                                                          €536m

PRS
                                                                                                Buyer                                                 Purchase price   Purchase price
#     Property                         Location                        Buyer                  Nationality                        Seller                   (€m)          (€k per unit)
      Cheevers Court & Haliday
1                                      South Suburbs                SW3 / DWS                                             Cosgrave Group                  €195m            €530k
      House

2     The Prestige Portfolio           North Suburbs                SW3 / DWS                                                   Private                   €145m            €457k

3     Clay Farm (Phase 1C)             South Suburbs                  Urbeo                                             Park Developments                 €75m             €391k

4     Johnstown Road                   South Suburbs               Confidential                                           McGrath Group                   €45m             €445k

5     Herberton                        Dublin 8                     LRC Group                                           Deloitte (receiver)               €37m             €358k

                                                                                                                                                          €497m

Source: Office – Knight Frank @ Sep-20. Residential – various including Hooke & MacDonald, BNP Paribas, Cushman & Wakefield
Hibernia REIT plc                                                                                                                             INTERIM RESULTS | NOV 2020      42
Dublin office rental market (further statistics)
Serviced office and co-working operators in Dublin                                                                                                                                                                                                                                                Top 10 Dublin takers of space in 9 months to Sep 2020

                                                                                                                                                                                                                                                                                                  # Tenant                             Sector           Take-up       % city centre
                 450k                                                                                                                                                                                                                                           2.5%
                                                        • In the 12 months to March 2020, serviced office/
                 400k                                     co-working accounted for 3.3% of gross take-up                                                                                                                                                                                          1                                   Finance              249k            0%
                                                        • Serviced office/co-working operators occupy                                                                                                                                                           2.0%
                 350k                                     approx. 3.6% of Dublin CBD stock**                                                                                                                                                                                                      2                                  Technology            135k          100%

                                                                                                                                                                                                                                                                       % of City Centre Stock**
                 300k                                   • For reference, co-working operators’ share of office
                                                                                                                                                                                                                                                                                                  3                                  Technology             85k            0%
Area (sq. ft.)

                                                          stock in some other major cities is: London (6.0%),                                                                                                                                                   1.5%
                 250k                                     Paris (3.2%), New York (3.9%)
                                                                                                                                                                                                                                                                                                  4                                  Technology             75k            0%
                 200k
                                                                                                                                                                                                                                                                1.0%
                 150k                                                                                                                                                                                                                                                                             5                                  Technology             48k          100%

                 100k                                                                                                                                                                                                                                           0.5%                              6                                  Technology             44k          100%

                  50k
                                                                                                                                                                                                                                                                                                  7                                  Technology             43k          100%
                   0k                                                                                                                                                                                                                                           0.0%
                                                  IWG

                                                                                                                                       DCU Alpha

                                                                                                                                                                                                      Us & Co

                                                                                                                                                                                                                                                       Other*
                                                                                                                                                                                                                Media Cube
                                                                                                          Glandore

                                                                                                                                                                                                                             Dospace
                                                         Pembroke Hall

                                                                                                                                                                   DCU Invent
                                                                                                                                                                                Huckletree
                                                                                                                                                                                             Knotel
                        WeWork

                                                                                                                                                                                                                                       Office Suites
                                 Iconic Offices

                                                                                                                                                   Dogpatch Labs
                                                                                                                     The Digital Hub
                                                                         The Guinness Enterprise Centre

                                                                                                                                                                                                                                                                                                  8                                    State                42k          100%

                                                                                                                                                                                                                                                                                                  9                                  Technology             37k          100%

                                                                                                                                                                                                                                                                                                  10                                 Technology             36k            0%

                                                                                                                                                                                                                                                                                                       Total                                               794k           44%

                                                                                                                                                                                                                                                                                                  Source: Knight Frank @ 30 Sep-20

                                                   sq. ft. (LHS)                                                                                           % of city centre stock** (RHS)                                                                                                                                               •   Accounted for 70% of the total take-
                                                                                                                                                                                                                                                                                                                                            up in 9 months to September 2020
                                                                                                                                                                                                                                                                                                                                        •   Strong expansion: 81% net to gross
Source: Hibernia & Knight Frank @ 31 Mar-20
* smaller operators with
You can also read