ICMA International Capital Market Association
←
→
Page content transcription
If your browser does not render page correctly, please read the page content below

International Capital Market Association
ICMA

ICMA European Repo and Collateral Council - General Meeting
De-mystifying Repo: Impacts on Financial Stability and
the Real Economy

14 November 2017, Brussels
ICMA European Repo and Collateral Council
General Meeting
14 November 2017, Brussels

                                            Welcome Remarks

                                            Godfried De Vidts
                                               Chairman
                                              ICMA ERCC
ICMA European Repo and Collateral Council
General Meeting
14 November 2017, Brussels

                   The financial crisis – the role of repo

                   How did problems in the subprime mortgages cause a systemic event? Our answer is that there
                   was a run in the repo market.
                   Gary B. Gorton and Andrew Metrick (2012): “Securitized Banking and the Run on Repo”, Journal of Financial Economics

                   The crisis came when crashing housing prices raised doubts about securitisations and when
                   chains of inside liquidity created by repos with re-hypothecation and re-use of the same
                   securities collapsed with rising haircuts and resulting illiquid markets.
                   Vítor Constâncio, Vice-President of the ECB, at the second ECB Macroprudential Policy and Research Conference, Frankfurt am Main, 11 May
                   2017

                   If the repo market wouldn´t have grown as it did, the crisis that followed the demise of Lehman
                   Brothers would have been, at least in Europe, even more damaging or the burden on the ECB to
                   attenuate its effects would have been even heavier.
                   Francesco Papadia, former Director General, Market Operations, ECB, at the ‘Future of the European Repo Market’ conference, London, 11
                   June 2013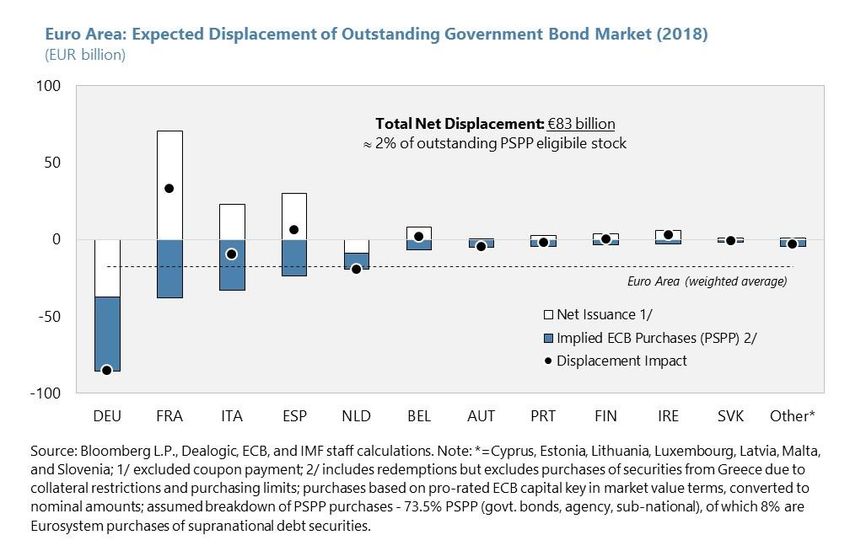
ICMA European Repo and Collateral Council
General Meeting
14 November 2017, Brussels
The regulatory discrepancy
Belief no 1: Collateral is good
Regulation defines and requires ‘good quality’ collateral for:
Secured lending and borrowing
Margining centrally cleared transactions
Margining non-cleared derivate transactions
ICMA European Repo and Collateral Council
General Meeting
14 November 2017, Brussels
The regulatory discrepancy
Belief no 2: Repo is bad
The repo and securities lending markets are a source of:
Excessive leverage
Procyclicality
Interconnectedness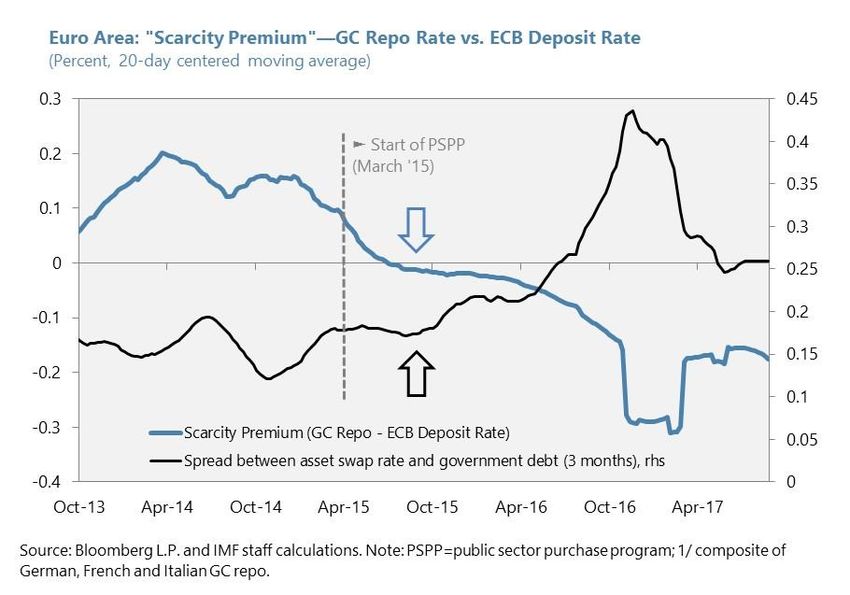
ICMA European Repo and Collateral Council
General Meeting
14 November 2017, Brussels

                   If only there was a market for collateral….

                  Some participants sit on collateral                                      Some participants are long cash but
                  and do nothing with it                                                   need collateral

                                                        Sovereign Wealth Funds
                                                                                  Insurance Funds
                                 Investment Banks
                                                                                           Central Banks
                                 Corporate Treasuries

                                                                                              Money Market Funds
                                  Asset Managers
                                                                                        Pension funds
                                                 Commercial Banks
                                                                          Hedge Funds

                      Some participants have the wrong                                     Some participants are long collateral
                      kind of collateral                                                   but need cash
ICMA European Repo and Collateral Council
General Meeting
14 November 2017, Brussels

                   Wait, there is!

                  Some participants sit on collateral                                      Some participants are long cash but
                  and do nothing with it                                                   need collateral

                                                        Sovereign Wealth Funds
                                                                                  Insurance Funds
                                 Investment Banks
                                                                                           Central Banks
                                 Corporate Treasuries                 Repo
                                                                      Market
                                                                                              Money Market Funds
                                  Asset Managers
                                                                                        Pension funds
                                                 Commercial Banks
                                                                          Hedge Funds

                      Some participants have the wrong                                     Some participants are long collateral
                      kind of collateral                                                   but need cash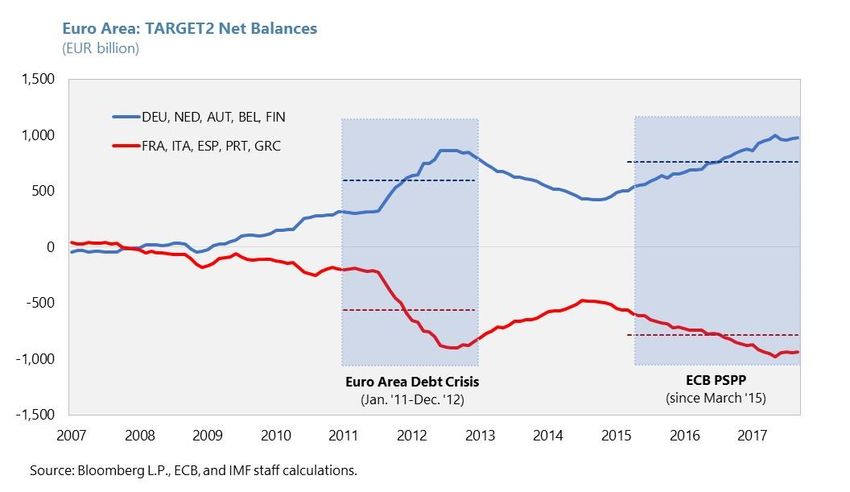
ICMA European Repo and Collateral Council
General Meeting
14 November 2017, Brussels

                   Collateral fluidity
                              Collateral Demand ≡ Available collateral supply x Collateral fluidity

                     The repo market is the ‘pump’ that sources, prices, and mobilizes collateral through the
                     financial system.

                     If we want efficient and resilient markets underpinned by collateral, then we need a vibrant and
                     liquid repo market. You can’t have one without the other.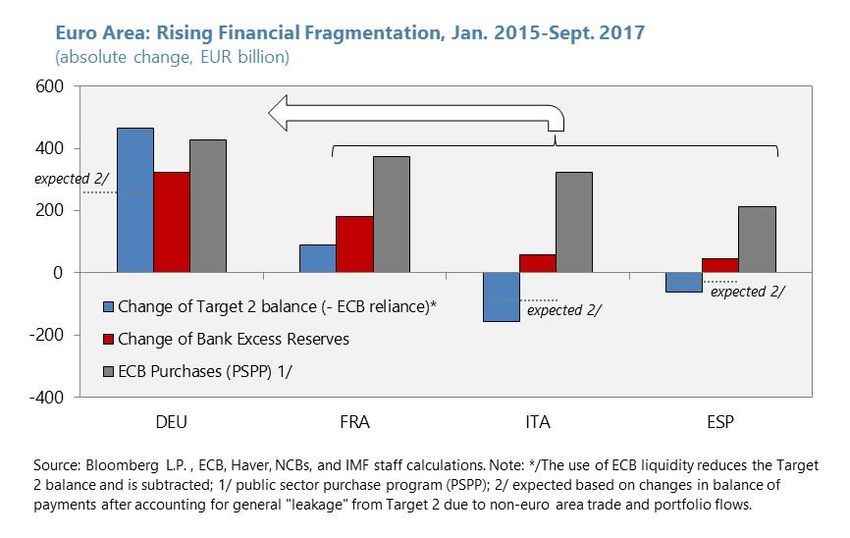
ICMA European Repo and Collateral Council
General Meeting
14 November 2017, Brussels

                   Tilting at windmills…
Monetary Policy and Repo Market in the Euro
Area
ICMA European Repo and Collateral Council General Meeting
Pradhan (2017) Monetary Policy and Repo Market 1Euro Area: a strong recovery
Euro Area Real GDP Growth
(Percent)
3
2
1
0
-1
-2
-3
-4
-5
2011
2009
2010
2012
2013
2014
2015
2016
2017
2018
2019
2020
2021
2022
Source: World Economic Outlook (October 2017).
Pradhan (2017) Monetary Policy and Repo Market 2All countries growing: lowest dispersion since inception
Euro Area Real GDP Growth
(Percent)
15
10
Max
5
0
Euro Area
-5
-10
Min
-15
1999
2000
2001
2002
2003
2004
2005
2006
2007
2008
2009
2010
2011
2012
2013
2014
2015
2016
2017
2018
2019
2020
2021
2022
Source: World Economic Outlook (October 2017).
Note: includes all 19 countries. Ireland growth rate in 2015 is excluded.
Pradhan (2017) Monetary Policy and Repo Market 3ECB price stability objective: widening dispersion
Euro Area Inflation
(percent)
4
Euro Area
Germany
3 Italy
"close to but below" 2 percent objective
2
1
0
-1
2010
2011
2012
2013
2014
2015
2016
2017
2018
2019
2020
2021
2022
Source: World Economic Outlook (October 2017).
Pradhan (2017) Monetary Policy and Repo Market 4Money markets dominated by secured lending
Euro Area: Secured vs. Unsecured Money Market Lending
(Cumulative Quarterly Turnover, Trillions of Euros)
35
30
Secured
25
20
15
10
Unsecured
5
0
2003 2004 2005 2006 2007 2008 2009 2010 2011 2012 2013 2014 2015
Source: ECB - Money Market Survey.
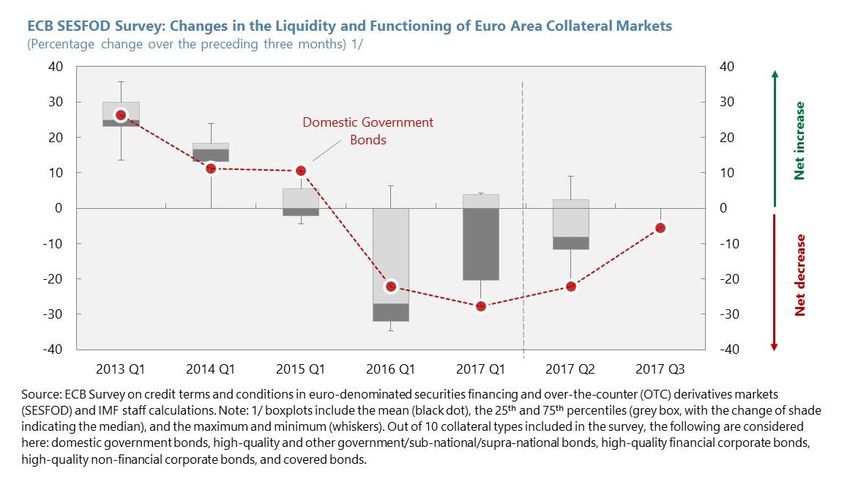
Pradhan (2017) Monetary Policy and Repo Market 5Collateral scarcity may become a challenge …
Scarcity premium due to lower collateral availability (esp. for non-banks but also CCPs) and persistent
arbitrage opportunities as banks have limited balance sheet capacity (e.g., lower basis trading)
Pradhan (2017) Monetary Policy and Repo Market 6Collateral: lower ECB asset purchases next year but still very significant
PSPP expected to displace €470 billion of government debt in 2017 but less next year (€83billion) amid
positive net debt issuance
Pradhan (2017) Monetary Policy and Repo Market 7Collateral: Target 2 imbalances widening again
Pradhan (2017) Monetary Policy and Repo Market 8Collateral: ECB asset purchases contributing to Target 2 imbalances?
This puts a premium on the efficient movement of collateral (via repo markets) to help reduce
fragmentation by reversing cross-border flows of (excess) liquidity.
Pradhan (2017) Monetary Policy and Repo Market 9Market Functioning: liquidity and collateral flows improving
Pradhan (2017) Monetary Policy and Repo Market 10Considerations for well-functioning repo market through wider collateral availability
Negative repo rates are not a new phenomenon ( specials), and NIRP/QE have not caused
material market disruptions.
But some aspects of Eurosystem securities lending and infrastructure raise issues:
Develop common active securities lending solution for all (or most) NCBs (esp. for those weakly
integrated in custodial network through central securities depositories (CSDs))
Harmonized modalities (e.g., pricing, haircuts, eligibility) and higher limits on lending per issue
Resolve interoperability challenges of trading platforms (CCP/tri-party repo): integrated securities
settlement under T2S for “central bank money” not available for “commercial bank money”
Dysfunctional repo market would result in:
Less efficient cash markets
Limited market access by non-banks for hedging, and
Difficulties for eventual monetary policy normalization
Pradhan (2017) Monetary Policy and Repo Market 11ICMA European Repo and Collateral Council
General Meeting
14 November 2017, Brussels
Panel 1: Macro-financial Linkages of Repo Markets
and Financial Stability Implications
Moderator: Andreas Jobst, Adviser to the Managing Director and CFO, World Bank
Panellists:
Peter Grasmann, E1 Unit Head, Directorate E, DG FISMA, European Commission
Steffen Kern, Head of Risk Analysis and Economics Department, ESMA
Michael Manna, Head of Fixed Income Financing Trading Europe, Barclays
Alberto Gallo, Head of Macro Strategies, AlgebrisThe Algebris View | Volatility, Fragility and Repo Markets
ICMA Conference, November 2017
Alberto Gallo, CFA
Portfolio Manager, Algebris Macro Credit Fund (UCITS), Head of Macro Strategies
Contact us
Call +44 203 196 2450
Email AlgebrisIR@algebris.com
Visit www.algebris.com
c Page 1
This document is for private circulation to professional investors only. Algebris (UK) Limited is authorised and regulated by the Financial Conduct Authority.A New Equilibrium in Monetary Policy
Credit Supercycle: How Did We Get Here?
Total Private Credit by Country ($trn)
US GDP US total credit Europe total credit UK total credit China total credit
70
Privatisation of 349% GDP
60 Fannie Mae
Big Bang (UK) Glass-Steagall Act Financial crisis & QE
repealed
Competition & credit
50 controls introduced / Introduction of
Freddie Mac Help to Buy (UK)
Bretton Woods the Euro
created breaks down
40
Fannie Mae issued first
MBS
304% GDP
30
274% GDP
Right to buy Reserve
introduced requirement
20 under abolished
Thatcher (UK)
10
377% GDP
0
1947 1952 1957 1962 1967 1972 1977 1982 1987 1992 1997 2002 2007 2012
Source: Federal Reserve, European Central Bank, Bloomberg, FRED, PBoC. Private credit calculated as the sum of household loans, corporate loans and bonds and bank debt
Page 13
This document is for private circulation to professional investors only. Algebris (UK) Limited is authorised and regulated by the Financial Conduct Authority.Low Volatility and Asset Bubbles
From QE to Markets
How Loose Monetary Policy Has Reduced Risk Premia and Volatility
Lower sovereign Reduced rates
yields volatility
Portfolio Lower credit Lower credit
rebalancing spreads volatility
QE
Compressed
Sell volatility
Search for yield volatility risk
strategies
premium
Anticipation of more QE to
Slow monetary
mitigate volatility reversal Low volatility trap
normalisation
(Buy on dips)
Source: Algebris (UK) Limited
Page 14
This document is for private circulation to professional investors only. Algebris (UK) Limited is authorised and regulated by the Financial Conduct Authority.Low Volatility and Asset Bubbles
How Investment Strategies Have Implicitly or Explicitly Benefited from QE
Bubbles? Short VIX Pension Vol Selling
ETFs Overwriting Funds
$3.2bn1 $45bn2 $8bn3
Real Estate, Equities
Investment High Yield
other Illiquid (Public and
Grade Debt Credit
assets Private)
Risk Parity
Rates $600bn4
Overpaying Across Asset Classes
Hunt for
Demand > Low Vol.
Yield >
Risky
Assets
Supply for
Safe Assets QE Investment
Strategies
Equity
Yield and Spread Compression Share
Credit Buybacks
$495bn5
Neg.
Equity Risk Term Vol Target /
Yielding Defaults Risk Premia CTAs
Premium Premium Control
Bond Mass Postponed $250bn7 $350bn8
Lower Vanishing $360bn6
Increases
Source: Algebris (UK) Limited. 1 $3.2 billion in short-volatility strategies estimated from Bloomberg data. 2 $45 billion in pension short volatility overwriting programs estimated as of 2017 in Deutsche Bank’s 2017 Tail Risk Monitor. 3 $8 billion exposure from option writing funds
estimate from Macro Risk Advisers derivatives research by Pravit Chintawongvanich (April 7, 2017). 4 $400-600 billion estimate as of 2016 from Financial Times article by Makan and Wiggles (October 14, 2016) “Little Known Trading Strategy Exacerbates Market Turmoil”.
5 $495 billion 2017 S&P 500 share buybacks estimate in Goldman Sachs “US Weekly Kickstart” (October 27, 2017) by David Kostin. 6 $360 billion exposure in Volatility Control Funds/Variable Annuity Funds exposure estimate based on J.P. Morgan Cross Asset Derivatives
Research Team research note (August 27, 2015) by Marko Kolanovic and Bram Kaplan. 7 $250 billion exposure in Low Vol Risk Premia strategies estimated by Research Affiliates’ Rob Arnott based on 2017 interview in Grant’s Interest Rate Observer.
8 $350 billion AUM in Trend Following strategies/CTA based on J.P. Morgan Cross Asset Derivatives Research Team research note (August 27, 2015) by Marko Kolanovic and Bram Kaplan.
Page 15
This document is for private circulation to professional investors only. Algebris (UK) Limited is authorised and regulated by the Financial Conduct Authority.Low Volatility and Asset Bubbles
Global QE Has Dampened Volatility
Central bank balance sheet size, $tn vs VIX Index
20 70
Fed ECB BoE BoJ PBoC SNS VIX Index (RHS)
18
60
16
14 50
12
40
10
30
8
6 20
4
10
2
0 0
2008 2009 2010 2011 2012 2013 2014 2015 2016 2017
Source: Algebris (UK) Limited, Bloomberg
Page 16
This document is for private circulation to professional investors only. Algebris (UK) Limited is authorised and regulated by the Financial Conduct Authority.Low Volatility and Asset Bubbles
Is Real World Uncertainty Rising?
Global Economic Policy Uncertainty G10 Economic Surprises Volatility
350 70
300 60
250 50
200 40
150 30
100 20
50 10
0 0
2004 2006 2008 2010 2012 2014 2016 2004 2006 2008 2010 2012 2014 2016
S&P Earnings Surprises Volatility US HY Default Rate
4 8%
7%
3 6%
5%
2 4%
3%
1 2%
1%
0 0%
2004 2006 2008 2010 2012 2014 2016 2004 2006 2008 2010 2012 2014 2016
Source: Algebris (UK) Limited, Bloomberg, BAML Indices. *G10 Economic Surprises Volatility calculated as annualised standard deviation of Citi G10 Economic Surprises Index; S&P Earnings Surprises Volatility calculated as annualised standard deviation of the sum of positive
and negative surprises in S&P earnings.
Page 17
This document is for private circulation to professional investors only. Algebris (UK) Limited is authorised and regulated by the Financial Conduct Authority.Low Volatility and Asset Bubbles
The Bubble Galaxy
Bubble Size = Potential Loss From a Crash*
2500%
Financial
FAANGS
$790bn Real assets
2000% Cryptocurrencies
combined
$76bn
1500% London property market Australian property
market
% Appreciation
BitCoin £1.2tn
$33bn A$0.9tn
1000%
Short VIX ETFs
Long-end Gilts $2.2bn
500% £260bn EM HY
$140bn
0%
Short-dated Bunds Duration of appreciation, years
€14bn
-500%
0 5 10 15 20 25 30 35 40
Source: Algebris (UK) Limited, Bloomberg, BAML Indices, OECD, Savills, UK Gov. *Assumptions for potential loss from a crash: -60% decline for BitCoin/cryptocurrencies, as happened in 2013; -20% decline for London and Australian property market, as happened during the US
housing market crash; for FAANGS, assuming their PE ratios converge to the market average; for short-dated Bunds, assuming a return to positive yield from around -60bp now; for long-end Gilts, assuming a catch-up with inflation and a 200bp widening in yield; for EM HY,
assuming a 15% decline; for short VIX ETFs, assuming a -70% decline.
Page 18
This document is for private circulation to professional investors only. Algebris (UK) Limited is authorised and regulated by the Financial Conduct Authority.Bibliography
- Gallo, A., Cotroneo, T., Pan, T., Aney, A., Morenes, P., The Silver Bullet | Interplanetary Bubbles, 21 September 2017
- Scars or scratches? Hysteresis in the euro area, Speech by Benoît Cœuré, Member of the Executive Board of the ECB at the International Center for Monetary and Banking Studies, Geneva, 19 May 2017
- Hassan, F., di Mauro, F., Ottaviano, G. Banks credit and productivity growth, ECB Working Paper Series, February 2017
- Corlett, A., Clarke, S. Living standards 2017: the past, present and possible future of UK incomes, 31 January 2017
- Understanding Populism: Inequality by the Numbers, Blog post by Pushan Dutt (INSEAD Professor of Economics and Political Science), 16 December 2016
- Jarociński, M., Lenza, M., An inflation-predicting measure of the output gap in the euro area, ECB Working Paper Series No 1966, September 2016
- Saito, I., Fading Ricardian Equivalence in Ageing Japan, IMF Working Paper 16/194, September 2016
- Democracy Index 2016: Revenge of the “deplorables”, The Economist Intelligence Unit, 2016
- Kuroda, H., “Comprehensive Assessment” of the Monetary Easing: Concept and Approaches, 5 September 2016
- Ball L., Gagnon J., Honohan P., Krogstrup S., What else can central banks do?, Vox, 2 September 2016
- Dauer U., German Savers Lose Faith in Banks, Stash Cash at Home, Wall Street Journal, 28 August 2016
- Jobst A., Lin H., The ECB’s Negative Rate Policy Has Been Effective but Faces Limits, IMF, 10 August 2016
- Stevens G., An Accounting: Address to the Anika Foundation Luncheon, 10 August 2016
- Gallo A., Our global financial system is broken. Here’s a plan for fixing it, World Economic Forum, 6 July 2016
- Williamson, S., Neo-Fisherism: A Radical Idea, or the Most Obvious Solution to the Low-Inflation Problem?, Federal Reserve Bank of St. Louis, July 2016
- Kuroda, H., Overcoming Deflation: Theory and Practice, 20 June 2016
- Corsetti, G., Feld P. L., Koijen R., Reichlin L., Reis R., Rey H., Weder di Mauro B.,Reinforcing the Eurozone and protecting an open society: Refugee bonds, 27 May 2016
- Haldane, A. G., The Great Divide, Bank of England, 18 May 2016
- Rajan R., Rethinking the Global Monetary System, Speech at the London School of Economics, 10 May 2016
- Jones, R., Innovation, research and the UK’s productivity crisis, The University of Sheffield, April 2016
- Standard & Poor’s, QE and Economic Inequality: The UK Experience, 10 February 2016
- Cochrane, J., Do Higher Interest Rates Raise or Lower Inflation, 10 February 2016
- Kothari, S.P., Lewellen, J., Warner, J. B., The behaviour of aggregate corporate investment, MIT, December 2015
- Borio, C., Labour reallocation and productivity dynamics: financial causes, real consequences, BIS, December 2015
- Gallo, A., Why ECB’s quantitative easing won’t work and how it can be fixed, Financial Times, 7 December 2015
- Blanchard, O., E. Cerutti and L. Summers, Inflation and activity – Two Explorations and their Monetary Policy Implications, IMF Working Paper No 230., November 2015
- Borio, C., Revisiting three intellectual pillars of monetary policy received wisdom, Luncheon address, Cato Institute, 12 November 2015
- Borio C., Gambacorta, L., Hofmann, B., The influence of monetary policy on bank profitability, BIS, October 2015
- Contessi, S., Kerdnunvong, U., Asset bubbles: detecting and measuring them are not easy tasks, Federal Reserve Bank of St. Louis, July 2015
- Belfied, Cribb, Hood, Joyce, Living Standards, Poverty and Inequality in the UK: 2015, Institute for Fiscal Study, July 2015
- Gallo, A., Rethink needed for monetary policy role, Financial Times, 1 July 2015
- Haldane, A. G., Stuck, Bank of England, 30 June 2015
- Borio C., Persistent unusually low interest rates. Why? What Consequences?, BIS, 28 June 2015
- IMF, Global Financial Stability Report, April 2015
- Gallo, A., Walker, R., Tyrrell-Hendry, L., Popovic, M., Grant, A., Pan, T., The Revolver | Divided Kingdom: Britain’s future beyond the election, 14 April 2015
- Sigurjonsson, F.; Monetary Reform, A better monetary system for Iceland, Report commission by the Prime Minister of Iceland, 20 March 2015
- OECD (2015), Economic Policy Reforms 2015: Going for Growth, OECD Publishing, 9 February 2015
- Milburn, Elitist Britain?, Social Mobility and Child Poverty Commission, 2014
- Kothari, S.P., Lewellen, J., Warner, J., The behavior of aggregate corporate investment, MIT Sloan Research Paper No. 5112-14, 19 October 2014
- Jahan S., Mahmud A. S., Papageorgiou C., What is Keynesian Economics?, IMF, September 2014
- Carrol, C.D., Slacalek, J., Tokuoka, K. (2014) The Distribution of Wealth and the Marginal Propensity to Consume, ECB Working Paper No 1655
- Sharpe, S.A. and Suarez, G.A. (2014) The insensitivity of investment to interest rates: Evidence from a survey of CFOs, Finance and Economics Discussion Series, FRB Washington DC
- Rotman, D., How Technology is Destroying Jobs, MIT Technology Review, 12 June 2013
- Koo, R., The world in balance sheet recession: causes, cure, and politics, Real-world Economics Review, issue no. 58, 2011
- Rajan, G. R., Let Them Eat Credit, New Republic, 27 August 2010
- Lewis, W. A., Economic Development with Unlimited Supplies of Labor, May 1954
Page 19
This document is for private circulation to professional investors only. Algebris (UK) Limited is authorised and regulated by the Financial Conduct Authority.Introduction to Algebris
Investment Expertise
Financial Equity Financial Credit Private Debt (NPL) Macro Credit Italian Securities
ⱶ Launch: Oct 2006 ⱶ Launch: Jan 2009 ⱶ Launch: Oct 2014 ⱶ Launch: Jul 2016 ⱶ Launch: Oct 2017
ⱶ Strategy: Primarily ⱶ Strategy: Senior and ⱶ Strategy: Non ⱶ Strategy: Focus on ⱶ Strategy: Primarily
financial stocks with subordinated credit performing loans in sovereign, financial securities of listed
a global remit. The (e.g. CoCo and Italy, targeting first and corporate debt Italian companies,
aim is to generate hybrid securities) of lien mortgage NPL (including hybrid focusing on small and
attractive risk- banks and insurance portfolios secured instruments). mid capitalisation
adjusted returns, companies globally. by real estate Exposures are companies
primarily through The aim is to capture assets tactically managed
fundamental analysis a high current and globally
income and generate ⱶ AUM: EUR 1.3bn* unconstrained
ⱶ AUM: EUR 0.6bn modest capital
appreciation ⱶ AUM: EUR 0.7bn
ⱶ AUM: EUR 7.0bn
*Private debt indicates committed capital to closed-end funds.
Data as of 30.09.2017
Page 20
This document is for private circulation to professional investors only. Algebris (UK) Limited is authorised and regulated by the Financial Conduct Authority.Disclaimer
This document is issued by Algebris (UK) Limited. It is for private circulation only. The information contained in this document is
Offices strictly confidential and is only for the use of the person to whom it is sent. The information contained herein may not be
reproduced, distributed or published by any recipient for any purpose without the prior written consent of Algebris (UK) Limited.
London
Algebris (UK) Limited Algebris (UK) Limited is authorised and regulated in the UK by the Financial Conduct Authority. The information and opinions
1 St. James's Market contained in this document are for background purposes only, do not purport to be full or complete and do not constitute
investment advice. Algebris (UK) Limited is not hereby arranging or agreeing to arrange any transaction in any investment
London SW1Y 4AH
whatsoever or otherwise undertaking any activity requiring authorisation under the Financial Services and Markets Act 2000.
Singapore This document does not constitute or form part of any offer to issue or sell, or any solicitation of an offer to subscribe or purchase,
Algebris Investments (Asia) Pte any investment nor shall it or the fact of its distribution form the basis of, or be relied on in connection with, any contract therefore.
LTD No reliance may be placed for any purpose on the information and opinions contained in this document or their accuracy or
50 Raffles Place #38-07 completeness. No representation, warranty or undertaking, express or implied, is given as to the accuracy or completeness of the
Singapore Land Tower information or opinions contained in this document by any of Algebris (UK) Limited, its members, employees or affiliates and no
Singapore 048623 liability is accepted by such persons for the accuracy or completeness of any such information or opinions.
This document is being communicated by Algebris (UK) Limited only to persons to whom it may lawfully be issued under The
Boston
Financial Services and Markets Act 2000 (Financial Promotion) Order 2001 including persons who are authorised under the
Algebris Investments US (Inc) Financial Services and Markets Act 2000 of the United Kingdom (the “Act”), certain persons having professional experience in
699 Boylston Street matters relating to investments, high net worth companies, high net worth unincorporated associations and partnerships, trustees
Suite #1001 of high value trusts and persons who qualify as certified sophisticated investors. This document is exempt from the prohibition in
Boston MA 02116 Section 21 of the Act on the communication by persons not authorised under the Act of invitations or inducements to engage in
investment activity on the ground that it is being issued only to such types of person.
Milan
The distribution of this document may be restricted in certain jurisdictions. The above information is for general guidance only,
Algebris Srl
and it is the responsibility of any person or persons in possession of this document to inform themselves of, and to observe, all
Via Fatebenefratelli 10 applicable laws and regulations of any relevant jurisdiction.
20121 Milano
Past performance is not necessarily a guide to future performance. The strategy employed may result in the NAV exhibiting a
Luxembourg high level of volatility. This document is suitable for professional investors only. This fund may invest in contingent convertible
Algebris Investments securities ('Cocos'). CoCos have unique risks, for example, due to equity conversion or principal write-down features which are
tailored to the issuing entity and its regulatory requirements, which means the market value of CoCos may fluctuate. Additional
(Luxembourg) S.a.r.l.
risk factors associated with CoCos are set out in the fund’s prospectus.
40 Avenue Monterey
L-2163 Luxembourg Algebris (UK) Limited, 1 St. James's Market, London SW1Y 4AH, UK. Company registration no: 10308570
Page
This document is for private circulation to professional investors only. Algebris (UK) Limited is authorised and regulated by the Financial Conduct Authority.ICMA European Repo and Collateral Council
General Meeting
14 November 2017, Brussels
Panel 2: Post-crisis Regulatory Reforms and the
Functioning of Repo Markets
Moderator: Natasha de Teran, Head of Corporate Affairs, SWIFT
Panellists:
Benedict Roth, Senior Technical Specialist, Prudential Policy, Bank of England
Greg Markouizos, Global Head of Fixed Income Finance & Collateral Management,
Citigroup
Richard Comotto, Senior Visiting Fellow, ICMA Centre
Richard Hochreutiner, Director, Head Global Collateral, SwissRe
This document is for private circulation to professional investors only. Algebris (UK) Limited is authorised and regulated by the Financial Conduct Authority.ICMA European Repo and Collateral Council
General Meeting
14 November 2017, Brussels
Presentation: Asset purchases, financial regulation
and repo market activity
Benoît Cœuré
Member of the Executive Board
European Central Bank
Speech and slides can be found hereICMA European Repo and Collateral Council
General Meeting
14 November 2017, Brussels
Closing Remarks
Godfried De Vidts
Chairman
ICMA ERCCICMA European Repo and Collateral Council
General Meeting
14 November 2017, Brussels
Next ICMA ERCC General Meeting:
March 2018 (date tbc), hosted by BNY Mellon in London
Regular ICMA courses and workshops on Repo:
▪ ICMA Workshop: GMRA Masterclass – a clause-by-clause analysis & Annex I negotiation
Next workshop: 20-21 November 2017 in London
▪ ICMA Seminar: The ICMA Guide to Best Practice in the European Repo Market
Next seminar: 27 November 2017 in London
▪ ICMA course: Securities Lending & Borrowing - Operational Challenges
Next course: 11-12 December 2017 in London
▪ ICMA Workshop: Repo and securities lending under the GMRA and GMSLA
Next workshop: 7-9 March 2018 in London
▪ ICMA course: Collateral Management
Next course: 9-10 April 2018 in London
▪ Annual ICMA Workshop: Professional Repo and Collateral Management
Next workshop: Q1 2018 (date tbd)You can also read