Introduction to Carvana - August 2021
←
→
Page content transcription
If your browser does not render page correctly, please read the page content below
Introduction to
    Carvana
  August 2021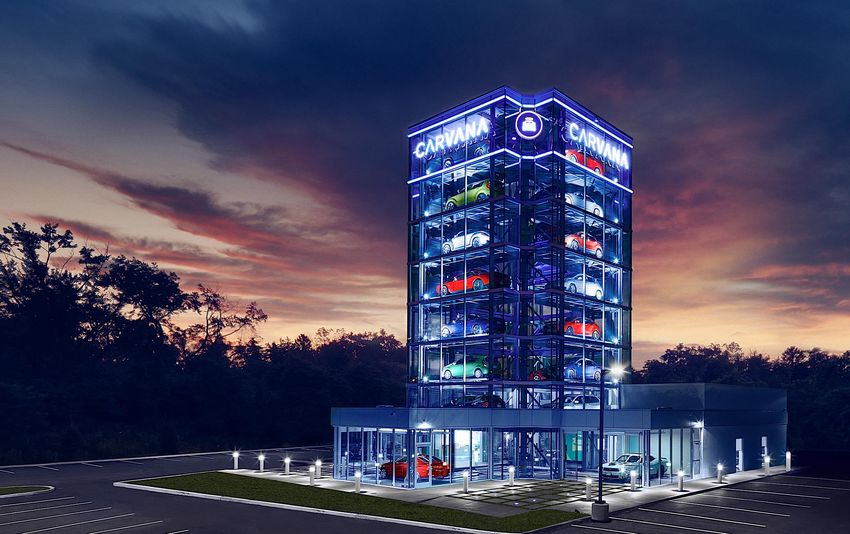
Forward-Looking Statements
This presentation contains forward-looking statements within the meaning of the Private Securities Litigation Reform Act of 1995. These
forward-looking statements reflect Carvana’s current expectations and projections with respect to, among other things, our financial
condition, results of operations, plans, objectives, future performance, and business. These statements may be preceded by, followed by or
include the words "aim," "anticipate," "believe," "estimate," "expect," "forecast," "intend," "likely," "outlook," "plan," "potential," "project,"
"projection," "seek," "can," "could," "may," "should," "would," "will," the negatives thereof and other words and terms of similar meaning.
Forward-looking statements include all statements that are not historical facts. Such forward-looking statements are subject to various risks
and uncertainties. Accordingly, there are or will be important factors that could cause actual outcomes or results to differ materially from
those indicated in these statements. Among these factors are risks related to the “Risk Factors” identified in Carvana’s Annual Report on
Form 10-K for 2020.
There is no assurance that any forward-looking statements will materialize. You are cautioned not to place undue reliance on forward-looking
statements, which reflect expectations only as of this date. Carvana does not undertake any obligation to publicly update or review any
forward-looking statement, whether as a result of new information, future developments, or otherwise.
Market and Industry Data
This presentation includes information concerning economic conditions, the Company’s industry, the Company’s markets and the Company’s
competitive position that is based on a variety of sources, including information from independent industry analysts and publications, as well
as Carvana’s own estimates and research. Carvana’s estimates are derived from publicly available information released by third party
sources, as well as data from its internal research, and are based on such data and the Company’s knowledge of its industry, which the
Company believes to be reasonable. The independent industry publications used in this presentation were not prepared on the Company’s
behalf. While the Company is not aware of any misstatements regarding any information in this presentation, forecasts, assumptions,
expectations, beliefs, estimates and projects involve risk and uncertainties and are subject to change based on various factors.

                                                                                                                                                     2
OUR MISSION IS
    TO CHANGE THE WAY
    PEOPLE BUY CARS.

5                5      3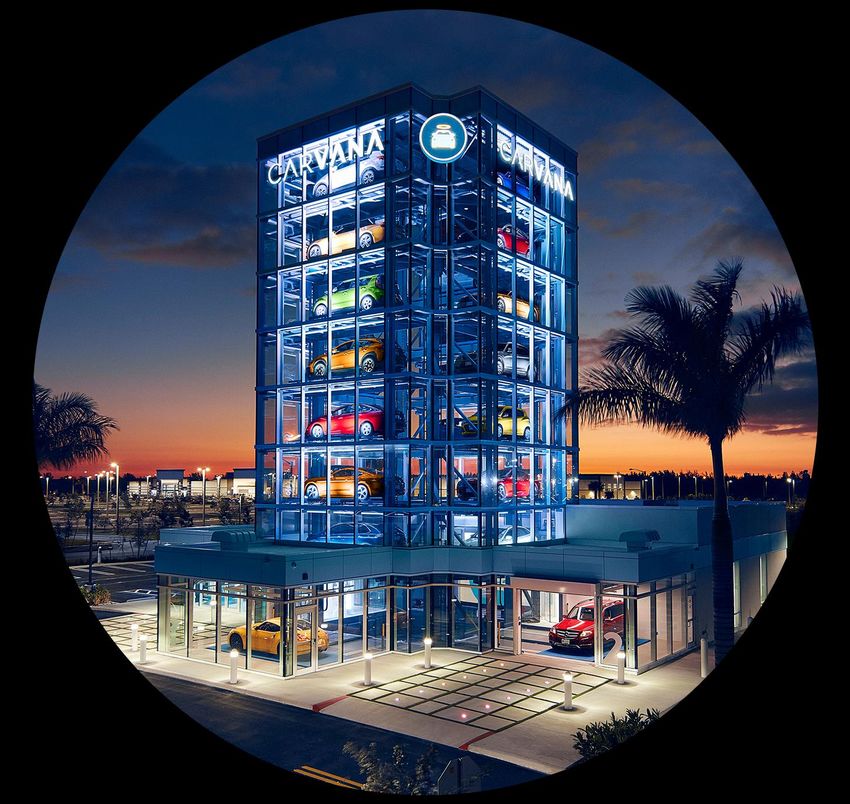
82% YoY
 Growth

                 96% YoY
                  Growth

17% YoY
 Growth

          ($M)

                 198% YoY
                  Growth

                            4
5

Auto is…    Massive   Fragmented   & Ripe for Disruption

$1.0 Tn    $840 Bn     1.9%              81%

 20%        2.0%       9.3%               9%

                                                           6
%   %   %

            7
Best
Experience                        Best
10 minutes –                      Value
                                  $1k+

        Next Day

                   Best
                   Selection
                    45,000+
                    cars on the
                    website
                                          8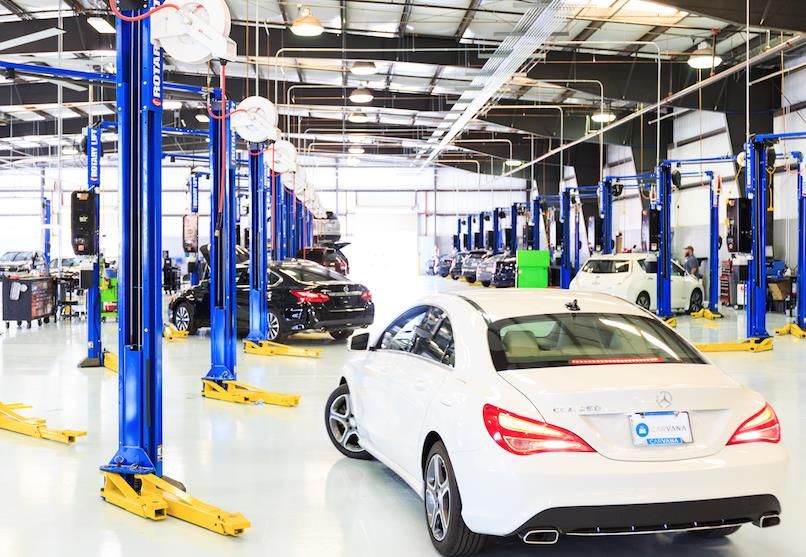
Vehicle Search &
  Discovery From Any
               Device

     Trade or Sell – All
                Online

            Real-Time,
Personalized Financing

 Seamless Transaction
          Technology

                           9
Three step process:                  Our artificial intelligence
                                     algorithms determine a real-
1. Input license plate or VIN        time offer for the customer

2. Enter vehicle details, and        No Haggling

3. Answer a few questions            Guaranteed for 7 days or
                                     1,000 miles

                                                                    Annual Wholesale Gross Profit
                                                                    per Wholesale Unit

You schedule at time that’s          Our vehicle data and
convenient for you                   valuation technology enables
                                     strong gross profit per unit
We pick up the car using our
last-mile delivery network           $610 Wholesale GPU *

We’ll review and hand you a          95% y-o-y growth in vehicles
check on the spot                    acquired from customers *

                                10
Carvana Delivery
• Scheduled appointments with
delivery as soon as the next day
in our markets
• Delivered by Carvana-uniformed
employee in a branded, custom
single or two car hauler, in our
markets
Vending Machine
• Operational efficiencies combined
with strong branding
• 28 vending machines currently operational (1)
• Creates a unique video of the experience for
customers to share via social media
11Carvana will I never
change the Carvana thought car
way cars are is the bomb! buying could
sold. be enjoyable.
12Enabling Rapid Expansion of 90%
Proven by Success in Our
Repeatable Market Entry Operating Markets Markets
Playbook Carvana U.S. Population Coverage
& Markets at End of Period MARKET PENETRATION BY COHORT (1)
80%
2.34%
Activate Team of 70%
Expansion Advocates
60%
EST. MARKET PENETRATION
CapEx Light 50%
1.48%
Market Launch
40%
1.00%
30%
Connect to 0.76%
0.72%
Logistics Network 0.61% 0.77%
20%
0.38%
10%
Turn on Marketing
Program
0%
Markets Population Coverage
1345,000+
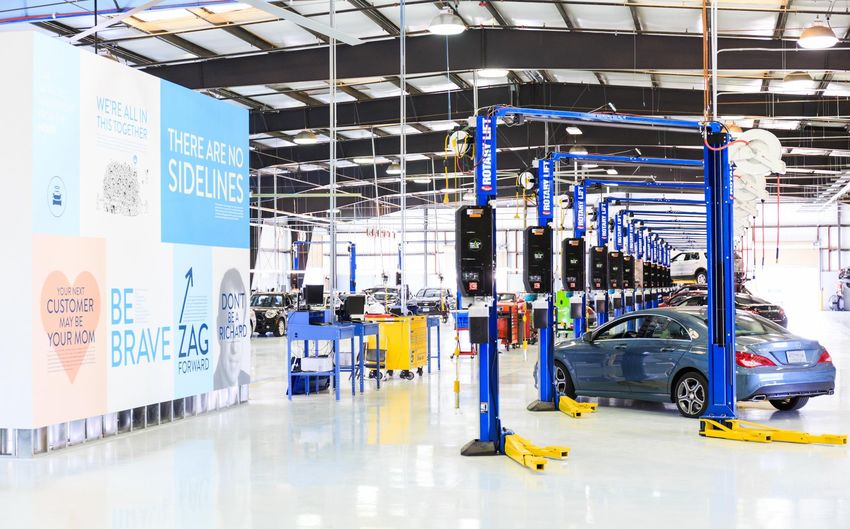
14Inspection and Reconditioning Photography and Annotation
buy all car types recondition • 360-degree, interactive
consistent car quality
• Patented imaging technology
• ~750k
• Robust processes and internal expertise
15Premium
Fulfillment
Capabilities
Carvana
Logistics
Network
16Revenues Retail Units
($M) Sold
$3,336
198% YoY 96% YoY
Growth Growth
244,111
$2,245
$5,587
177,549
$3,940
94,108
$1,955
44,252
$859
18,761
$365
17Gross Profit Key Drivers of Gross
per Unit Profit Expansion
18EBITDA MARGIN & NET LOSS ADVERTISING EXPENSE PER UNIT SOLD (1)
CUSTOMER ACQUISITION COST BY COHORT
CUSTOMER ACQUSITION COST
$1,177 $1,037 $1,093 $746
$1,652 $519
$1,188
$974
19NATIONAL CONSUMER
FOCUSED BRAND FULLY
LARGE SCALE TRANSACTABLE
RECONDITIONING E-COMMERCE
EXPERIENCE
INTERNAL LOGISTICS PROPRIETARY FINANCING
NETWORK PLATFORM
LEADING FULFILLMENT
EXPERIENCE
20Long Term
Target
FY 2016 FY 2017 FY 2018 Q1 2019 Q1 2019
FY 2016 FY 2017 FY 2018 FY 2019 FY 2020 Q2 2021
YoY Revenue Growth 180% 135% 128% 101% 42% 198% –
Gross Margin 5.3% 7.9% 10.1% 12.9% 14.2% 16.5% 15 – 19%
Gross Margin (1)
7.4% 6.5% 5.7% 5.2% 5.1% 3.6% 1.0 – 1.5%
21.1% 18.2% 14.9% 13.7% 13.7% 9.8% 4.5 – 5.5%
1.3% 1.3% 1.2% 1.0% 1.3% 0.7% 0.5 – 1.0%
29.8% 26.0% 21.7% 20.0% 20.2% 14.1% 6 – 8%
EBITDA Margin (23.2%) (16.9%) (10.5%) (6.2%) (4.6%) 3.4% 8 – 13.5%
Note: Numbers may not foot due to rounding 21Develop New
Products
Improve
Brand
Awareness
Innovate and
Extend
Technology
Enter New Leadership
Key
Geographical
Drive Revenue Markets
Growth in
Existing Markets
22$840B 1.9%
96% 4.7/5.0
79.4% 2.34%
13 28
42% 788K
2324
To supplement the financial measures prepared and presented in accordance with U.S. Generally
Accepted Accounting Principles (“GAAP”),we also include non-GAAP measures in this presentation.
None of these should be considered as a substitute for other measures of financial performance
reported in accordance with GAAP. In addition, the Company’s definitions of these non-GAAP financial
measures may not be comparable to similarly titled measures of other companies. A reconciliation of
each of these non-GAAP measures to the most directly comparable GAAP financial measure can be
found at the end of this presentation.

                                                                                                       25
26
27
You can also read