QUARTERLY CONSTRUCTION INSIGHTS - Q3 2021 - CORELOGIC

Page created by Roberta Barnes
 
CONTINUE READING
QUARTERLY CONSTRUCTION INSIGHTS - Q3 2021 - CORELOGIC
Quarterly Construction Insights
                                       Q3 2021

* The data for this Q3 report is a review of Q2 2021. This naming convention has recently been
                           updated to match the quarter of release.

                                                                                   Proprietary | © 2021 CoreLogic, Inc. All rights reserved.
                                                                                  CORELOGIC and the CoreLogic logo are trademarks of
                                                                                          CoreLogic, Inc. and/or its subsidiaries.
QUARTERLY CONSTRUCTION INSIGHTS - Q3 2021 - CORELOGIC
Summary of Q2 2021

    June Permit Authorizations
    Up 25% YoY, Lumber Costs Up
    129% YoY
▪    Authorizations for new housing permits
     continue to rise and increased 25% YoY in June.

▪    Costs for plywood and lumber continued to
     have over 100% YoY increases, while Romex wire
     and oak followed the trend.

▪    Labor costs continue to grow faster in the U.S.
     than in Canada, with many key construction
     labor costs growing by over 5% YoY.

▪    Confidence in commercial construction is
     improving, though still much lower than before
     pandemic.
                                                        Proprietary | © 2021 CoreLogic, Inc. All rights reserved.
                                                       CORELOGIC and the CoreLogic logo are trademarks of
                                                                CoreLogic, Inc. and/or its subsidiaries.            2
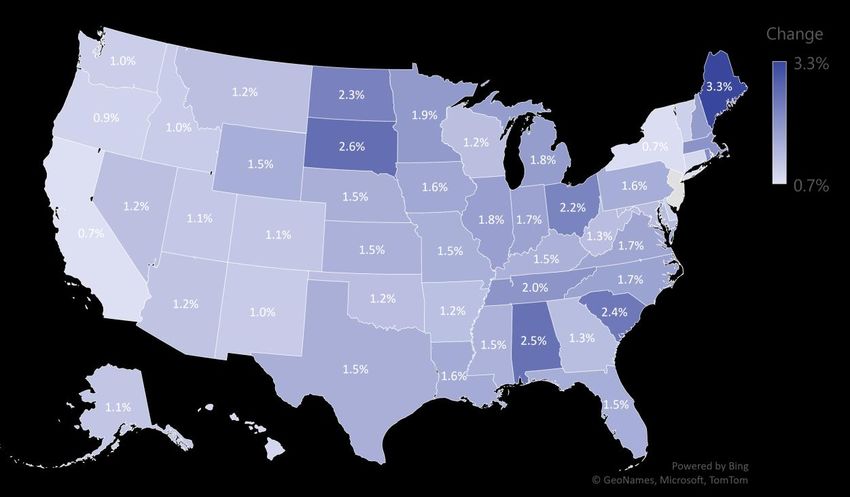
QUARTERLY CONSTRUCTION INSIGHTS - Q3 2021 - CORELOGIC
The Big Picture
Lumber costs continue to rise at unprecedented levels, but then began to level out. Why?

  In June 2021, costs for lumber, an important component of construction, increased by 129% YoY
  and 152% YoY in the United States and Canada, respectively.

  After many sawmills shut down due to the COVID-19 pandemic, production of lumber declined.
  However, unexpectedly, a homebuilding boom was underway, driven partly by low interest rates
  and partly by pandemic lockdown restrictions. Residential and commercial building owners
  began to remodel to adapt to the new circumstances. With a steep increase in demand for
  lumber and low supply, sawmills struggled and are still struggling to catch up. But very recently,
  as production of lumber met high demand, the growth of lumber prices began to slow, as
  indicated by sales prices at retailers.

  With the rapid increase in building costs continuing to have a ripple effect, U.S. new and existing
  home prices in Q2 2021 have seen a YoY 14% and 17% increase, respectively. It is important to note
  that unforeseen events can cause spikes in lumber costs. With respect to current building costs,
  insurance carriers, contractors and homeowners should be aware of the potential downstream
  implications of cost spikes on insuring to value (ITV). These fluctuations could have regional
  variations in impact.

                                                  Proprietary | © 2021 CoreLogic, Inc. All rights reserved. CORELOGIC and the CoreLogic logo are trademarks of
                                                                                       CoreLogic, Inc. and/or its subsidiaries.                                  3
QUARTERLY CONSTRUCTION INSIGHTS - Q3 2021 - CORELOGIC
U.S. Changes in Material Cost, YoY
Costs for many individual materials        180%
have continued to be significantly         160%
                                           140%                                                                                                                          Material        June
higher than at the same time last year.                                                                                                                                                  2021 YoY
                                           120%                                                                                                                                          Change
Costs for plywood and lumber in June
                                           100%
2021 were more than double what they                                                                                                                                     ½”              +165%
                                           80%                                                                                                                           Plywood
were in June 2020, and Romex wire and
                                           60%                                                                                                                           2x4             +129%
oak followed the trend.                                                                                                                                                  Lumber
                                           40%
                                           20%                                                                                                                           2x10            +104%
Different materials experience different                                                                                                                                 Lumber
                                            0%
rate hikes for various reasons. Products                                                                                                                                 Romex           +66%
                                           -20%                                                                                                                          Wire
such as plywood or plastics use
                                                                                                                                                                         1x4 Oak         +34%
additional processes, meaning that
glues and resins contribute to their              Concrete Block                 Clay Brick                     1/2" Drywall              Structural Steel

                                                  Steel Deck                     Asphalt Shingles 25yr, 3-tab   1/2" Rebar                1" Galvanized Pipe
cost. For materials with additional               Romex Wire                     1/2" Plywood                   2x4 Lumber                R-13 Fiber Batt Insulation

processes, cost changes are more                  Poly Rigid Insulation          1/4" Glass Plate               Exterior Paint            1/2" Copper Pipe

                                                  1/2" PVC Pipe                  3/4" Crushed Stone             Aluminum Conduit          1x4 Oak
gradual. But for solid soft woods such            4" Ceramic Wall Tile           Steel Stud                     Ready Mix                 Asphalt Felt 15#

as lumber or oak, cost changes are                Door- Interior HC slab         Dumpsters.                     Carpet- Nylon Loop        1/2" PEX Pipe

more rapid.                                       1" Black Fire-Sprinkler pipe   2x10 Lumber                    Door Casing               Asphalt Dimensional Shingles

                                                  1/2" Copper Pipe Type "L"

                                                                                                                                                                             Source: CoreLogic

                                                                                 Proprietary | © 2021 CoreLogic, Inc. All rights reserved. CORELOGIC and the CoreLogic logo are trademarks of
                                                                                                                      CoreLogic, Inc. and/or its subsidiaries.                                      4
QUARTERLY CONSTRUCTION INSIGHTS - Q3 2021 - CORELOGIC
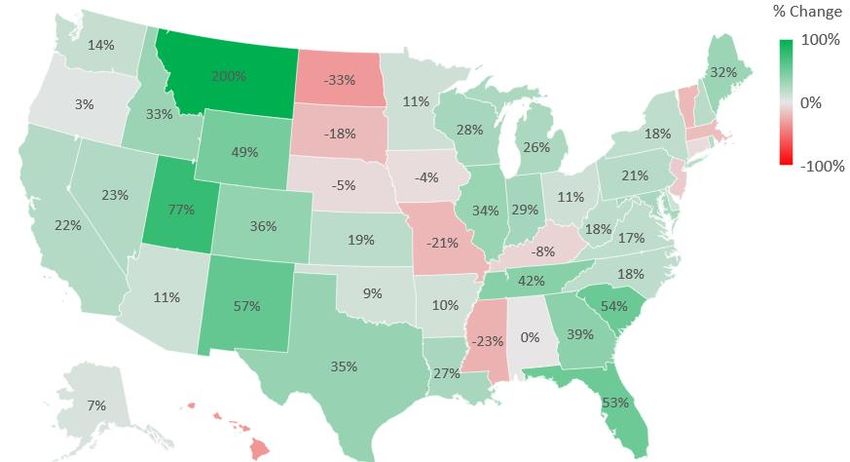
Canada Changes in Material Cost, YoY
                                           160%
Costs for many individual materials
                                           140%
have continued to be significantly         120%                                                                                                                   Material          June
higher than at the same time last year.    100%                                                                                                                                     2021 YoY
Costs for plywood and lumber in June        80%                                                                                                                                     Change

2021 were more than double what they        60%                                                                                                                   2x4               +152%
                                                                                                                                                                  Lumber
were in June 2020, and Romex wire and       40%
                                            20%                                                                                                                   ½”                +121%
oak followed the trend.                                                                                                                                           Plywood
                                             0%
                                                                                                                                                                  2x10              +102%
                                           -20%
Different materials experience different                                                                                                                          Lumber

rate hikes for various reasons. Products                                                                                                                          Romex             +53%
                                                                                                                                                                  Wire
such as plywood or plastics use
                                                  Concrete Block                      Clay Brick                       1/2" Drywall

                                                  Structural Steel                    Steel Deck                       Asphalt Shingles 25yr, 3-tab
                                                                                                                                                                  1x4 Oak           +14%
additional processes, meaning that                1/2" Rebar                          1" Galvanized Pipe               Romex Wire

glues and resins contribute to their              1/2" Plywood                        2x4 Lumber                       R-13 Fiber Batt Insulation

cost. For materials with additional               Poly Rigid Insulation               1/4" Glass Plate                 Exterior Paint

                                                  1/2" Copper Pipe                    1/2" PVC Pipe                    3/4" Crushed Stone
processes, cost changes are more
                                                  Aluminum Conduit                    1x4 Oak                          4" Ceramic Wall Tile
gradual. But for solid soft woods such            Steel Stud                          Ready Mix                        Asphalt Felt 15#

as lumber or oak, cost changes are                Door- Interior HC slab              Dumpsters.                       Carpet- Nylon Loop

more rapid.                                       1/2" PEX Pipe                       1" Black Fire-Sprinkler pipe     2x10 Lumber

                                                  Door Casing                         Asphalt Dimensional Shingles     1/2" Copper Pipe Type "L"

                                                                                                                                                                       Source: CoreLogic

                                                                           Proprietary | © 2021 CoreLogic, Inc. All rights reserved. CORELOGIC and the CoreLogic logo are trademarks of
                                                                                                                CoreLogic, Inc. and/or its subsidiaries.                                       5
QUARTERLY CONSTRUCTION INSIGHTS - Q3 2021 - CORELOGIC
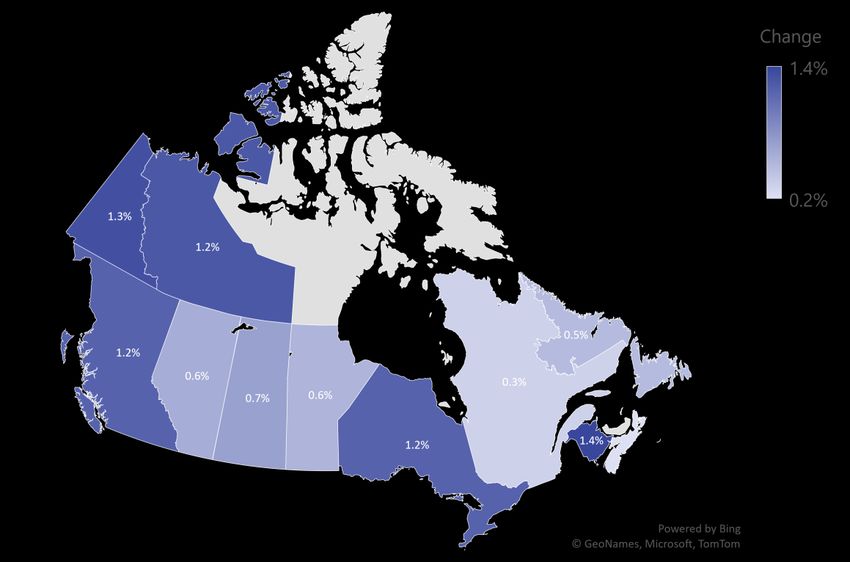
Labor Costs in the U.S. and Canada Compared
With a continuing shortage of workers for construction, companies are needing to pay higher rates for skilled labor.
From June 2020 to June 2021, residential and commercial labor costs in the United States grew significantly with cost
growth as high as 9% for teamsters. Labor costs in Canada continue to remain relatively more stable, with cost growth
highest for bricklayers at 4%.
                                           Labor Cost Change by Occupation
                                        (percent change, June 2020 to June 2021)
              10.0%
               9.0%
               8.0%
               7.0%
               6.0%
               5.0%
               4.0%
               3.0%
               2.0%
               1.0%
               0.0%

                                                      YoY U.S.     YoY CAN
                                                                                                                                                        Source: CoreLogic

                                                            Proprietary | © 2021 CoreLogic, Inc. All rights reserved. CORELOGIC and the CoreLogic logo are trademarks of
                                                                                                 CoreLogic, Inc. and/or its subsidiaries.                                   6
QUARTERLY CONSTRUCTION INSIGHTS - Q3 2021 - CORELOGIC
Q1 2021 to Q2 2021 Change in Residential Reconstruction Cost – United States
Changes in costs for materials impacts the final residential reconstruction cost of a property. Over a quarter,
costs have increased anywhere from 0.7% to 3.3% in each state. The national average was a change of 1.4%.

                                                                                             Most Significant Cost Increases

                                                                                               State                                   Change

                                                                                               MaineMost Significant Cost Increases
                                                                                                                               +3.3%

                                                                                               South Dakota                            +2.6%

                                                                                               Alabama                                 +2.5%

                                                                                             Least Cost Growth

                                                                                               State                                   Change
                                                                                               New Jersey                              +0.7%

                                                                                               California                              +0.7%

                                                                                               New York                                +0.7%

                                                                                                                                               Source: CoreLogic RCT
                                                        Proprietary | © 2021 CoreLogic, Inc. All rights reserved. CORELOGIC and the CoreLogic logo are trademarks of
                                                                                             CoreLogic, Inc. and/or its subsidiaries.                                  7
QUARTERLY CONSTRUCTION INSIGHTS - Q3 2021 - CORELOGIC
Q1 2021 to Q2 2021 Change in Residential Reconstruction Cost – Canada
Changes in costs for materials impacts the final residential reconstruction cost of a property. Over a quarter,
costs have increased anywhere from 0.2% to 1.4% in every province. The national average was a change of 0.8%.

                                                                                           Most Significant Cost Increases

                                                                                             State                                   Change

                                                                                             New Brunswick                   +1.4%
                                                                                                  Most Significant Cost Increases

                                                                                             Yukon Territory                         +1.3%

                                                                                             Northwest Territories                   +1.2%

                                                                                           Least Cost Growth

                                                                                             State                                   Change
                                                                                             Nova Scotia                             +0.2%

                                                                                             Quebec                                  +0.3%

                                                                                             Newfoundland                            +0.5%
                                                                                                                                            Source: CoreLogic RCT

                                                      Proprietary | © 2021 CoreLogic, Inc. All rights reserved. CORELOGIC and the CoreLogic logo are trademarks of
                                                                                           CoreLogic, Inc. and/or its subsidiaries.                                  8
ECONOMIC INDICATORS
U.S. Economic
Indicators
                                                                                                                  Q1 2021                  Q2 2021

                                         Housing Starts*                                                          1,599                    1,568

                                         Building Permits*                                                        1,788                    1,671

The U.S. economy has seen significant    Home Sales*                                                              7,200                    6,558
disruptions over the course of the        New                                                                     826                      728
                                          Existing                                                                6,303                    5,830
pandemic. Housing prices have
skyrocketed, with change in home         Unemployment                                                             6.2%                     5.9%
price from Q2 2020 to Q2 2021 being
                                         Consumer Confidence                                                      96.3                     121.6
17.2% for existing stock and 13.8% for
new stock. Though unemployment
                                         30-Year Fixed Mortgage Rate                                              2.9%                     3.0%
has declined and consumer
                                                                                                                  Q2 2020                  Q2 2021
confidence has increased, housing
starts, building permits and home        Home Price YOY Change
                                          New (%)                                                                 2.7%                     13.8%
sales are lower in Q2 2021 than in Q1     Existing (%)                                                            4.5%                     17.2%
2021.
                                          Data may be revised
                                          *in 1,000s

                                          Sources: U.S. Bureau of the Census, National Association of Realtors, U.S. Bureau of Labor
                                          Statistics, The Conference Board, Freddie Mac, CoreLogic
                                              Proprietary | © 2021 CoreLogic, Inc. All rights reserved. CORELOGIC and the CoreLogic logo are trademarks of
                                                                                   CoreLogic, Inc. and/or its subsidiaries.                                  9
Changes in Permit Authorizations
Construction permits are an indicator of anticipation. Because permits are required before construction can begin, they
may be an indicator that builders are moving forward with projects. U.S. permit authorizations in June 2021 were at 25%
total growth when compared to June 2020. All four regions have seen an increase in permit authorizations with the South
and West in the lead with 31% and 27% growth, respectively. All unit types have seen an increase between 19% and 25%, with
no particular focus on one type over the others.
                                                                                                   West Region
                                                                                                   South Region
                                                                                                 Midwest Region
                                                                                                 Northeast Region

                                                                                                                                       0%       10%       20%      30%     40%

                                                                                                   Units                Jun-20            Jun-21                % Change

                                                                                                   1                    84,270            105,122               25%

                                                                                                   2                    2,324             2,770                 19%

                                                                                                   3 or 4               1,569             1,895                 21%

                                                                                                   5+                   35,836            44,713                25%

                                                                                                   Total                123,999           154,500               25%

                                                                                                                                         Authorized Building Permits
                                                                                                                                   (Units % Change) 6/2020 – 6/2021

                                                                                                                                              Source: U.S. Census Bureau
                                                            Proprietary | © 2021 CoreLogic, Inc. All rights reserved. CORELOGIC and the CoreLogic logo are trademarks of
                                                                                                 CoreLogic, Inc. and/or its subsidiaries.                                        10
Construction Job Growth in the U.S.
Construction employment totaled 7,410,000 in June, down 38,000 from March. Employment in construction was
up by 239,000 jobs since June 2020.

           Total U.S. Construction Employment in June 2021                   Highest Annual GROWTH                             Largest Annual DECLINE

                       7,410,000
                                                                                     Massachusetts                                         Wyoming

                                                                                        25%                                               -8%

                            38,000                                                       New York

                                                                                        22%
                                                                                                                                           Colorado

                                                                                                                                          -2%
                                      qtr/qtr

                          239,000
                                                                                         Michigan                                          Alabama

                                                                                         21%                                              -2%
                                       yr/yr

   Source: U.S. Bureau of Labor Statistics                   *Total percent from 5/2020 to 5/2021.            Source: Associated General Contractors of America

                                                              Proprietary | © 2021 CoreLogic, Inc. All rights reserved. CORELOGIC and the CoreLogic logo are trademarks of
                                                                                                   CoreLogic, Inc. and/or its subsidiaries.                                  11
Construction Confidence in the U.S.
In Q2 2021, the USG Corporation and U.S. Chamber of Commerce stated the
Commercial Construction Index increased three points from 62 in Q1 to 65.
Surveys indicate that 72% of contractors are experiencing project delays
due to COVID-19, down from 80% in Q1 . 84% of contractors are experiencing
at least one material shortage, up from 71% in Q1. 33% of contractors report
that their top material shortage is wood/lumber, up from 22% in Q1.

  Sources: USG Corporation and U.S Chamber of Commerce

                                                         Proprietary | © 2021 CoreLogic, Inc. All rights reserved. CORELOGIC and the CoreLogic logo are trademarks of
                                                                                              CoreLogic, Inc. and/or its subsidiaries.                                  12
CoreLogic tracks construction costs for commercial, residential
and agricultural construction of all types by researching a
basket of goods (labor and materials) all around the United
States and Canada. This research is conducted monthly, which
allows us to monitor fluctuations to commonly used materials.

For more information, please call:

855.267.7027

              Proprietary | © 2021 CoreLogic, Inc. All rights reserved. CORELOGIC and the CoreLogic logo are trademarks of
                                                                                      CoreLogic, Inc. and/or its subsidiaries.   13
You can also read