Media forecast 2018 - Stuff.co.nz

Page created by Stanley Buchanan
 
CONTINUE READING
Media forecast 2018 - Stuff.co.nz
media
forecast
 2018
Media forecast 2018 - Stuff.co.nz
The way people consume their media is constantly changing.
We’ve been tracking these habits through the annual Stuff
media channel study and the results are pretty interesting.

We’ve used the study for a few years to judge what we
expect to happen. Whilst we aren’t 100% accurate, we’re
not usually too far away.

It’s our view on the world coupled with our view on what
we can expect. Nothing too grandiose, just simple facts
along with our view. We hope you find it useful for planning
what to expect in 2018.
Media forecast 2018 - Stuff.co.nz
Drivers of Change -                                                                                                              There is immediate
Ultra Fast Broadband                                                                                                             potential among the
                                                                                                                                 fifth who have UFB
                                                                                                                                 available but haven’t yet
                                                                                                                                 had it installed.
Do you have UFB?
                                                                                                                                 Its rollout and uptake
                                                                                                                                 opens NZ up to new
                                                                                                                                 disruptive behaviour,
                                                                                 Yes
                                       12%
                                                                                 No, but I know
                                                                                                                                 especially in our most
                    23%
                                                                                 it is available in
                                                                                 my area                                         valuable urban areas
                                                                                 No, it is not yet
                                                                                 available in my
                                                                                                                                 ‘Internet of things’
               23%                          42%                                  area
                                                                                                                                 device growth will be
                                                                                 No, I am not sure
                                                                                 if it is available in                           enabled by this
                                                                                 my area
                                                                                                                                 increased bandwidth
                                                                                              42%
                                                                                                          Huge growth in UFB,    available via fibre. This
                                                                                                          up by around a fifth   includes voice assistants.
                   21%                25%                25%
                                                                                                              since 2015.

                 2013                2014              2015                2016               2017

Base: 2017 National Sample N=1,001
Q: Do you have Fibre / Ultra Fast Broadband (i.e. high speed fibre optic internet access) at your home?
*Source: Nielsen CMI year ending Q2’14, Q2’15, Q2’16, Q2’17
Media forecast 2018 - Stuff.co.nz
Drivers of Change -
Fibre & VDSL
Household connections speeds increasing. Fibre penetration and increased
connections will be the major distruptive force in 2018

*Source: http://thedownload.co.nz/benchmarks/, Chorus Network Connections and Speed, Dec 17.
Media forecast 2018 - Stuff.co.nz
Video/Movie/TV Streaming -
Usage & Shifts
• We expect Vodafone TV and any new entrants to
  come in at around 7-8% for a good result
  comparable to previous years 2018.
• Netflix rules and lightbox will also grow, with
  Netflix to be on par with You Tube in 2018.
• TV networks will be static or see declines.

             65%
     62%            59%

                                                48%
                                                           42%              40%

                                                                                       29%           27%
                                                                                                                     20%                                    22%
                                        16%
                                12%
                                                                                                           8%   7%                     7%                         8%   8%
                                                                                                                           1%               1%    1%   1%

         You Tube                     Netflix                   TVNZ On                     TV3 On          Lightbox            Neon             HULU+        None of
                                                                Demand                      Demand                                                             these

      2015                  2016                  2017

Base: 2017 National Sample 2015 N=2,011, 2016 N=1,010, 2017 N=1,001
2015/2017: Which, if any, of the following video/movie/TV streaming services do you currently use?
2016 Q. Which of the following have you used in the last week?
Media forecast 2018 - Stuff.co.nz
Connected Devices -
Usage & Shifts
                                                                                                                                                                                        OTT TV devices now
                                                                                                                                                                                        greater than smart TV.
                                                                                                                                                                                        VOD & SVOD services
Over half of NZ Homes have
                                                                                                                                                                                        now bigger than PVR
TV connected devices                                                                                                           73%
                                                                                                                                                                                        and we expect further
                                                                                                                         65%
                                                                                                                   61%
                                                                                                                                                                        55%
                                                                                                                                                                              61% 61%
                                                                                                                                                                                        declines in PVR use.
49%
       47%
              44%                                                                                                                                41%
                                                                                                                                                                                        Huge growth in Netflix
                          38%                                                                                                              38%
                                  36%
                                         32%
                                                                                                                                     34%
                                                                                                                                                                  31%
                                                                                                                                                                                        year-on-year with
                                                                                                            27%
                                                                                                      23%                                                                               Lightbox also showing
                                                                           16%                  18%                                                         16%
                                                                    10%                                                                                                                 growth. On Demand TV
                                                              7%                                                                                       7%
                                                                                                                                                                                        has remained fairly
       PVR                    Game Console                     OTT/Multimedia
                                                                  devices
                                                                                                Smart TV / 3D TV    Smartphone             Tablet            SVOD             VOD       static since 2015

      YE Q4 2015               YE Q2 2016               YE Q2 2017

Source: Nielsen Consumer & Media Insights Q1-Q42015 Dec-fused, Q315–Q216 Aug fused, Q316-Q217
Media forecast 2018 - Stuff.co.nz
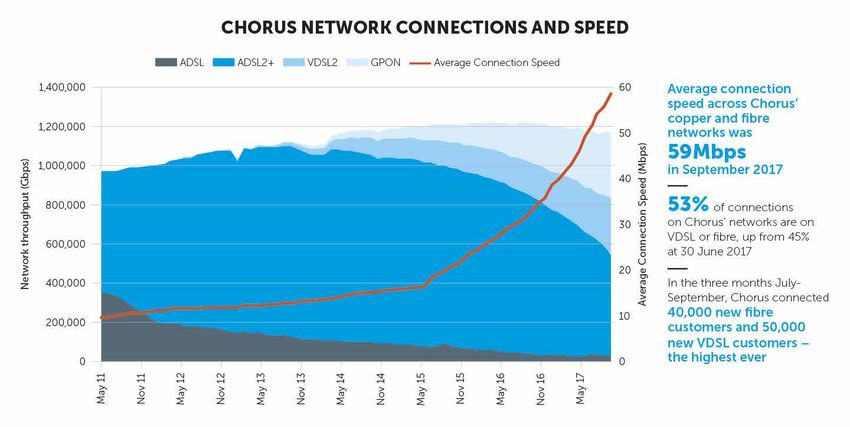
Online Social Platform –
Usage & Shifts

                                                                                                                             • Facebook has strong reach, but we’re seeing first
                   Using Facebook
                      MORE often
                                                                       20%
                                                                                            *Net                               signs of Facebook fatigue with users considering
                                                                                           Change                              reducing or withdrawing. Those using Facebook ‘less’
                   Using Facebook
                                                                                             -3%                               more likely to be younger i.e. 28% of under 35’s
                                                                       19%
                        LESS often
                                                                                                                               using less often (but nett change is similar at -3%)
               STOPPED using
          Facebook completely                            4%                                                                  • Trivial and time-consuming nature of Facebook is
                                                                                                                               what’s driving decrease in usage, in addition to the
      REDUCED the number
                                                                10%
                                                                                                                               lack of control over content
  of Facebook friends I have

                                                                                                                             • Of those leaving, around half have not replaced
          Considered LEAVING
                                                                12%
                                                                                                                               Facebook with anything. Those who have replaced
                   Faceboook
                                                                                                                               Facebook are mainly using Instagram, Twitter, Email,
           Haven’t changed the
                                                                                                                               face-to-face or phone conversation
           use of my Facebook                                                       35%
                                                                                                                             • This fatigue, coupled with increased competition
NA- Haven’t used Facebook
                                                                                                                               between social platforms means we expect social
                                                                   14%
      in the last 12 months
                                                                                                                               media fragmentation to accelerate in 2018

Base: 2017 National Sample N=1,001, Fairfax Sample N=1,114
Q: Thinking about Facebook, which of the following apply to you in relation to your use of Facebook in the last 12 months?
Please select all that apply.

*Net change = Less often + stopped – more often
Media forecast 2018 - Stuff.co.nz
Media Consumption Trends -
Reading
                                                                                Nett Gain / Loss
                                    Less often More often                       2017         2016
     New Zealand online
                                                7%                    40%         +33%         +29%
             news sites

        Social media sites                    11%                   34%           +23%         NA
                                                                                                       Kiwis connection to
         Online/digital
 newsfeeds/news alerts
                                                8%                  29%           +21%         NA     news likely to remain
      International online
                                                8%               23%              +15%         +13%
                                                                                                        strong over 2018
               news sites

          Local community
                                           19%                   20%              +1%          -7%
              newspapers

                Neighbourly                  14%               15%                +1%          NA

                                                                                                          Print declines
        Daily newspapers                 30%                   15%                -15%         -22%
                                                                                                        likely to reduce
          Food magazines                   22%               10%                  -12%         -21%   making it 3 years in a
      Lifestyle magazines                 25%                8%                   -17%         -30%
                                                                                                      row if forecast holds.
                                                                                                       Magazine forecasts
       Sunday magazines                  29%                 8%                   -21%         -34%
                                                                                                        are challenging.
   Gardening magazines                     19%              6%                    -21%         NA

Base: 2017 National Sample N=1,001, 2016 N=1,010
Q: Which of the below are you reading MORE / LESS than you were 6 months ago?
Media forecast 2018 - Stuff.co.nz
Media Consumption Trends -
Viewing & Listening

                                                                                                                                    • Over last 12 months, only small changes
    Watched/listened/used                                                          Less             More                   Nett
    in the past 12 months                                                         often             often                  Change     in use of traditional media. Growth in
                                                                                                                                      video media channel solely due to
                                                                                                                                      streaming services.
                              TV                                   92%         21%                             17%          -4%
                                                                                                                                    • Streaming services have overtaken SKY in
                                                                                                                                      terms of media consumption.
                         Radio                                     88%       26%                           12%              -14%
                                                                                                                                    • Online streaming will continue to grow in
                                                                                                                                      2018 with traditional broadcasters to
         Video/movie/TV
                                                                                                                                      experience declines in the same order of
                                                           63%                    17%                                45%    +28%
       streaming services                                                                                                             magnitude as 2017. We expect that
                                                                                                                                      without the major sporting events of the
                                                                                                                                      previous year, 2018 will be a tough year
                        Sky TV                          54%                   24%                             17%           -7%
                                                                                                                                      for traditional TV. Consumers will
                                                                                                                                      continue to take more control and we’ll
         Music Streaming
                                                                                                                                      therefore see ongoing growth in
                                                        51%                   19%                                    35%    +16%
                 Services
                                                                                                                                      streaming services.

Base: 2017 National Sample N=1,001
Have watched/listened/used in past 12 months.
Q: Compared to 12 months ago are you watching/listening/using the following MORE or LESS often, or about the SAME?
Media forecast 2018 - Stuff.co.nz
Media Consumption -
Streaming Services

     Video/Movie/TV
     streaming services
                                                                                                              Music streaming
                                                                                                              services
                                                                                                                                                                    Huge growth overall in
                                                                                                                                                                    use of music streaming
                     YouTube                                                59%                    Spotify                      49%
                                                                                                                                                                    services with just 15%
                       Netflix                                        48%                         YouTube
                                                                                               iHeart radio          9%
                                                                                                                                49%
                                                                                                                                      YouTube                       non-users this year.
     TVNZ On Demand                                              40%                                                                    most used streaming
                                                                                              Apple Music            8%
        TV3 On Demand                                  27%
                                                                                iTunes Radio / iCloud                8%
                                                                                                                                      service followed by Netflix   Spotify and YouTube
                    Lightbox                        20%                                           Pandora        7%                                                 the most popular music
        Sky On Demand                             17%                               Google Play Music            7%
                                                                                                                                                                    streaming services.
                                                                                              SoundCloud         6%
                   Apple TV                 8%
                                                                                              TuneIn Radio       3%
                         Neon              7%
                                                                                                      Rova       3%
                           Tivo        2%                                                     Grooveshark       2%

                      HULU+            1%                                                       Mix Cloud       1%
                                                                                                     Beats      1%
                    Quickflix          1%
                                                                                               Sony Music       1%
                          Igloo        1%
                                                                                        Music Unlimited         1%
                        Other          1%
                                                                                                     RDIO       0%
           None of these                    8%                                                       Other      2%
                                                                                             None of these            14%

Base: 2017 National Sample N=1,001
Q: Which, if any, of the following video/movie/TV streaming services do you currently use?
Q: Which, if any, of the following music streaming services do you currently use?
Takeaway - Drivers of Change

In our view the major disruptive media force will be driven
by increased bandwidths and speeds being consumed
by NZ households. The fastest growing segment of fibre
connections is at 100MB+ and this opens up more
opportunities across 2018. From more streaming to
households experimenting with new Internet enabled
devices including voice assistants
Takeaway - Traditional Media

News plays an important role in online content
consumption and we expect this to stay strong and keep
growing in 2018 ~25%

Traditional print will see further declines, however these
should slow for the 3rd consecutive year - newspapers
Takeaway - Streaming Services

Streaming services will continue to grow across 2018,
with continued significant growth of music streaming
through Spotify and YouTube.

Netflix growth will continue, solidifying its leadership
position in video streaming services. Its penetration will
increase to mid 50% range
Takeaway - Social Media

Expect social media to remain strong in terms of reach,
with Facebook continuing to lead

But expect it to fragment further driven by those
aged
About This Study…

          This report shares                                                                                     This wave provides
                                                                          It is designed to                       baseline measures
           the first wave of
                                                                          provide a holistic                          and where
            data from the
                                                                           view of market                       appropriate compares
          annual Stuff media
                                                                             performance                        to the previous brand
            channel study
                                                                                                                    health tracker

Majority of study conducted                                           Sample: N=2,115
online between Q3/Q4 2017                                             • N=1,001 National sample
by The Thinking Studio                                                • N=1,114 Study Conducted by The Thinking Studio and
                                                                        sample sourced by Yabble
                                                                      • Supplemented by other data from Nielsen CMI, and Chorus
                                                                      • Media forecast for 2018 developed by the Stuff Business
                                                                        Marketing & Insights Team
Like to chat about how these findings might impact your business or
marketing in 2018? Email us at businessmarketing@stuff.co.nz
You can also read