Investec Europe
 Market Bulletin
  February 2021
←
→
Page content transcription
If your browser does not render page correctly, please read the page content below

Investec Europe Market Bulletin February 2021

Contents
                                                                                                                          Page

Economic Update Ireland: New economic forecasts – a slower recovery as reopenings delayed                                   2

Investec Corporate Finance: Soft Commodities – signs of inflation stirring down on the farm                                 7

Investec Treasury – Currencies: Sterling gets a shot in the arm                                                            11

Investec Treasury – Commodities: A polar vortex and a drop in US inventory drive oil prices higher                         13

Investec Private Finance Ireland Limited: High-end residential property market                                             14

Contact Details                                                                                                            15

Executive Summary
In this month’s Bulletin, we update our economic forecasts following the extension of Level 5 restrictions. While all indications are that the
domestic economic recovery will be strong and durable when it does commence, the timeframe for this recovery is lengthening. Progress on
vaccinations is critical to the outlook. After a disappointing start, the pace of vaccinations is now accelerating and a significant step up is
expected through Q2. Recent commentary and targets have been encouraging, although we are mindful that these targets are contingent on the
arrival of adequate supplies. In the housing market, the ongoing supply-demand imbalance has been exacerbated by the pandemic. Homebuyer
demand is rebounding strongly but housing supply has been badly hit by the ongoing shutdown. We are therefore revising our forecast for house
price growth this year to 4%.
Investec Corporate Finance conducts a deep dive on the significant spike in agricultural commodity prices over the past year and examines its
implications. Investec Treasury looks at the recent rallies in sterling and oil and our lending desk rounds-up early-year activity in the high-end
residential market.

                                                                        1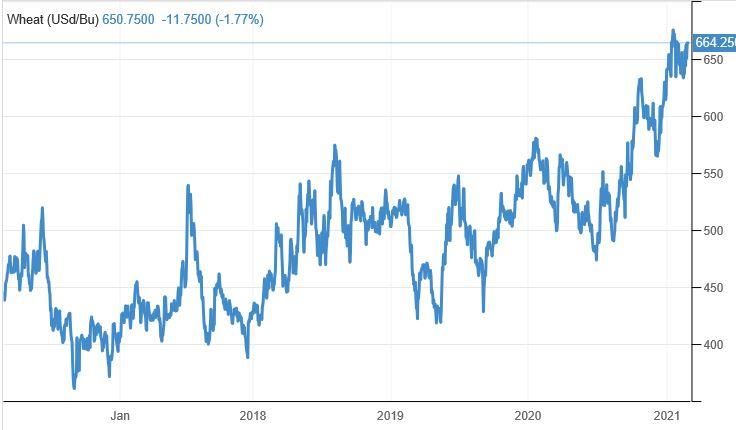
Economic Update: Ireland
New economic forecasts – a slower recovery as reopenings delayed
Economic Forecasts: Key Points
The economic outlook is entirely framed by COVID-19 at present. While we still expect an enduring domestic recovery to commence this year, we
now anticipate that it will be the later stages of Q3 before it comprehensively takes hold given the slower pace of economic reopenings than hoped
for at the start of the year. 5 April is now the earliest date for phased reopenings, but we expect the government to maintain its cautious approach.
Although the timeframe for a domestic recovery has lengthened, all indications are that it will be strong and durable when it does commence.
Remarkably robust income tax receipts attest to the resiliency of household earnings and the unprecedented build-up of household deposits means
that the domestic consumer will have a lot of firepower resting in its low-yielding deposit account once restrictions are lifted and confidence returns.
Reflecting the delayed nature of the recovery, we are downgrading our forecast for Modified Domestic Demand (MDD), our preferred measure of
domestic economic activity, this year to +2.5% (from +5.1% in December). However we now expect MDD to expand by 5.0% in 2022. Similarly, our
Personal Consumption forecast for 2021 is lowered from +6.8% to +3.0%, but we expect the consumer rebound to build momentum next year and
we forecast growth of 7.3% in 2022. GDP growth of 3.7% and 4.4% is forecast for this year and next, although this metric is heavily influenced by
multinational-dominated export sectors.
Progress on vaccinations is critical to the outlook. After a disappointing start, the pace of vaccinations is now accelerating and a significant step up
is expected through Q2. Recent commentary and targets have been encouraging, although we are mindful that targets are contingent on supplies.
In the housing market, remarkable price stability through much of 2020 is giving way to upward price pressures. Homebuyer demand is rebounding
strongly and a record volume of mortgage approvals in Q4 provides a robust base for 2021 activity. Housing supply however has been badly hit by
the ongoing shutdown. We are lowering our forecast for housing completions this year by 8% to 19,500 and upgrading our forecast for house price
growth to 4% (from 1%).
2017 2018 2019 2020F 2021F 2022F
GDP 9.1% 8.5% 5.6% 3.4% 3.7% 4.4%
Modified Domestic Demand 3.0% 2.5% 3.5% -5.4% 2.5% 5.0%
Personal Consumption 2.4% 2.8% 3.2% -8.6% 3.0% 7.3%
General Gov’t Balance/GDP -0.3% 0.1% 0.5% -5.3% -5.4% -3.5%
Residential Property Prices (y/y, Dec) 12.1% 6.3% 0.3% 2.2% 4.0% 3.5%
Mortgage Lending €7.3bn €8.7bn €9.5bn €8.4bn €9.5bn €10.5bn
Housing Completions 14,355 17,916 21,087 20,676 19,500 24,000
2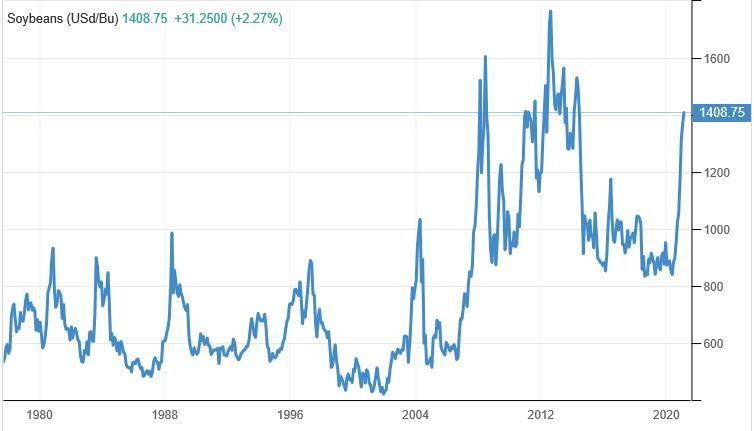
Economic Update: Ireland
Timeframe for domestic economic recovery is lengthening
The economic outlook is entirely framed by COVID-19 at present. While we still expect an
enduring domestic recovery to commence this year, we now anticipate that it will be the COVID-19 daily cases (7-day average)
later stages of Q3 before it comprehensively takes hold given the slower pace of economic
7,000
reopenings than hoped for at the start of the year.
6,000
Caution is still the order of the day 5,000
A combination of a deceleration in the decline of new virus cases, concerns about new 4,000
variants, vaccination supply issues and a cautious government approach has led to the 3,000
extension of Level 5 restrictions until at least 5 April. Even the reopening of the construction 2,000
industry, which had been mooted for early March, has been delayed. Timelines remain
1,000
frustratingly vague, encapsulated by the Taoiseach’s recent comment about hospitality not
0
opening before mid-summer.
This is perhaps understandable given the range of variables at play, but the approach now
stands in stark contrast to the four-stage reopening plan unveiled by the UK government
this week. 17 May, when indoor hospitality and sporting venues may reopen, and 21 June, Source: gov.ie
when legal limits on social contact are set to be removed, will be milestone dates there. The
UK’s stellar progress with its vaccination programme (see page 5) is now paying dividends.
Despite envious glances across the Irish Sea, we expect the Irish government to maintain COVID-adjusted unemployment rate
its cautious approach and its decisions to be informed by the calamitous easing of 32%
restrictions in December and the view that a second such mistake will not be as easily 30%
excused. A reassuring fiscal situation (tax receipts have been robust and were just -3.6% in 28%
2020), affords the government the ability to be cautious while maintaining financial supports. 26%
24%
Downgrading the current year outlook 22%
20%
We are therefore downgrading our forecast for Modified Domestic Demand, our 18%
preferred measure of domestic economic activity, this year to +2.5% (from +5.1% in 16%
December). Reflecting the delayed nature of the recovery, we forecast MDD to 14%
expand by 5.0% in 2022. We expect GDP growth of 3.7% and 4.4% this year and next, 12%
but it needs to be remembered that GDP in Ireland is heavily-weighted towards
multinational-dominated export sectors. Growth in these sectors propelled Irish GDP higher
in 2020 (+3.4% by our estimate). Of course, it almost doesn’t need stating that all forecasts Source: DEASP, CSO, Investec
carry a high degree of uncertainty at present.
3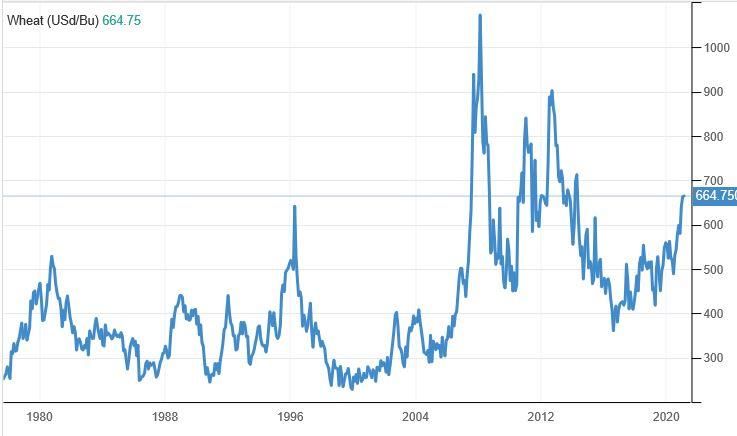
Economic Update: Ireland
Consumer to lead the domestic recovery
Consumer to lead the recovery following a prolonged period of enforced saving
Unprecedented growth in household deposits
Although the timeframe for a domestic economic recovery has lengthened, all indications
are that it will be strong and durable when it does commence. In a typical post-recession 14
recovery, positive momentum can be slow initially and take time to build as economic 12
imbalances are righted (we don’t have to look too far back in history for such an example
Year-on-year, %
10
in Ireland). However, this hasn’t been a typical recession in any sense, and there are a 8
number of reasons to believe this recovery will be much swifter and stronger than usual. 6
As has been cited in many quarters, household deposits accumulated at an 4
unprecedented pace last year as consumer shock took hold, spending opportunities 2
diminished and uncertainty reigned. Personal consumption was 14% (€7.2bn) lower y/y in 0
Q2-Q3, while household deposits in the banking system grew by 13% (€14.2bn) in the -2
Sep
Sep
Sep
Sep
Sep
Sep
Sep
Sep
Jan
May
Jan
May
Jan
May
Jan
May
Jan
May
Jan
May
Jan
May
Jan
May
year to December. Remarkably resilient income tax receipts attest to the resiliency of
household earnings despite the large hit to employment, and government income supports
2013 2014 2015 2016 2017 2018 2019 2020
have gone a long way in supporting those that have found themselves out of work. Once
restrictions are lifted and confidence returns, the domestic consumer will have a lot of Source: CBI
firepower resting in its low-yielding deposit account.
That’s not to say that there won’t be any hangover and that all of the potential firepower Personal Consumption (2016 = 100)
will be quickly converted to spending. Clearly not everyone who has been without work will
be able to immediately resume employment and the number of businesses that won’t 112
reopen is impossible to quantify at this stage. Recent research from the Central Bank of 110
Ireland also showed that forced savings from the pandemic were concentrated amongst 108
higher income households that typically spend a lower proportion of additional income, 106
which may dampen the forthcoming spending boom. 104
We are also mindful that the consumer that emerges post-crisis could well be more 102
cautious than the one that was blissfully unaware of the threat of a global pandemic a 100
short time ago. However this may only be significant if it was thought that vaccinations 98
were not going to put a permanent end to the COVID scourge. 96
2016 2017 2018 2019 2020F 2021F 2022F
Although we are downgrading our Personal Consumption forecast for 2021 from
Source: CSO, Investec forecasts
6.8% to 3.0% as a result of the delayed recovery, we expect the consumer rebound
to build momentum next year and we forecast growth of 7.3% in 2022.
4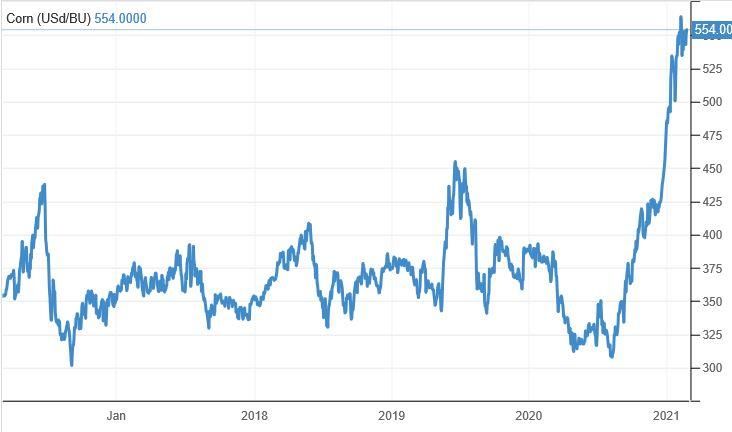
Economic Update: Ireland
Vaccination rollout is critical and it is now picking up pace
Targets imply a significant step up in vaccination rates from April
It has become apparent in recent months that vaccinations are the only lasting way out of the Vaccination progress as at 20 Feb
crisis. This was made abundantly clear by the rampant spread of the virus in December when
30
restrictions were eased. This is also why the sense of jubilation that broke out late last year with
the multitude of positive news on vaccination developments that brought the end point of the
Doses per 100 people
25
pandemic into sight has since been tempered. Production difficulties, debates about efficacy,
20
and concerns about the emergence of new strains have collectively pushed this end point a little
further away than initially hoped. 15
After a disappointing start, progress is now accelerating. Irish authorities had administered 350k 10
doses by 20 February, equating to 7 doses per 100 people, a little ahead of the EU average,
and a further 100k are scheduled this week. Authorities hope to increase this run rate to 5
250k/week from April. Should this be achieved, and the 250k/week rate be maintained through 0
Q2, the country could reach c.80 doses per 100 people by the end of June (note that this is not UK US Ireland EU Germany France
the same as 80% population coverage given the need for two doses). Encouragingly, there is Source: Our World in Data
scope for an even better outturn should the J&J one-shot vaccine be promptly approved by EU
authorities. Mindful of recent disappointments however, and the large amount of unknowns, we Illustrative vaccination rollout in Ireland
are reluctant to formulate specific vaccination estimates.
100
Lessons from other countries suggest hospitality reopenings could commence during the
90
summer months – in line with comments from An Taoiseach
Doses per 100 people
80
Where that leaves Ireland in terms of economic reopenings remains frustratingly unclear. The 70 achieved projected
emergence of more contagious strains of the virus has caused much alarm and we have seen 60
that vaccine supplies can be disrupted. Few would dispute that the vaccine rollout has been the 50
best part of the UK’s response to the pandemic and it has now administered almost 30 doses 40
per 100 people. Extrapolating from current vaccination rates, the UK could have administered 30
c.80 doses per 100 people by the time it plans to reopen indoor hospitality on 17 May and 100+ 20
doses by the time social curbs are ended. Current targets in Ireland suggest 80 doses per 100 10
people could be reached by the start of Q3, although these targets carry plenty of caveats. 0
Looking further afield, Israel, the world leader in COVID vaccinations, has just begun to emerge
from a strict lockdown in recent days. It has already administered more than 80 vaccines per Note: based on stated targets by HSE officials, specifically the
100 people and around half of its population has received at least one dose. 250k/week target for Q2
5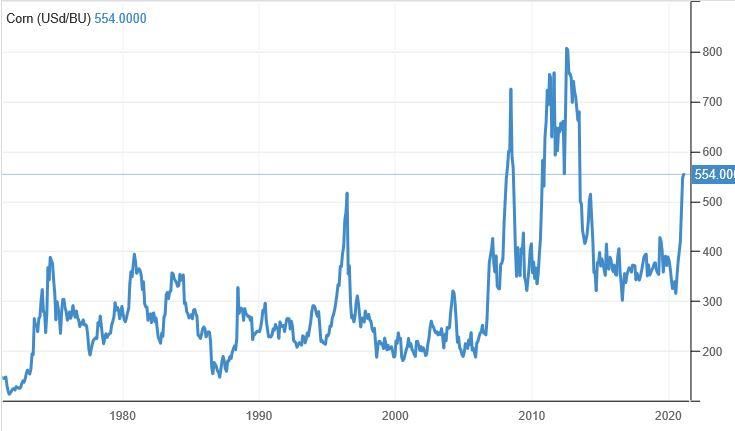
Economic Update: Ireland
Residential market – construction shutdown to fuel price growth in 2021
Residential prices now moving higher after weathering the storm
Residential prices – annual change
One of the surprising things of the past year has been the resiliency of the residential
property market. Prices were more stable in 2020 than in any of the previous 15 years 3.0
despite the turmoil of the pandemic. 2.5
2.0
This stability has now begun to give way to upward price pressure. 1.5
1.0
Prices increased by 1.8% in Q4 2020, the largest quarterly increase since Q3 2018, and
%
0.5
there are a number of indicators that suggest price inflation will persist through 2021. 0.0
-0.5
The size of the average mortgage approval in Q4 was 5% higher than a year earlier and
-1.0
data from both the daft.ie and myhome.ie websites show that the average price of a newly- -1.5
listed home in Q4 was 6-7% higher than in the same period of 2019.
The volume of mortgage activity also highlights the resiliency of underlying demand –
mortgage approvals of €3.5bn in Q4 were more than 10% higher than any other quarter in
Source: CSO
the past 10 years. Government initiatives, such as the expanded Help to Buy scheme and
the forthcoming shared equity scheme, will further serve to fortify demand and expand the
pool of potential homebuyers.
Housing supply hit by ongoing construction shutdown Housing completions (units)
Against this backdrop of robust demand, the key driving force in the property market 25,000
remains the chronic undersupply of new housing, and this is being exacerbated by the 22,500
pandemic. Developers over the past year have focused their efforts on completing already-
started units and this approach has paid dividends – total completions of 20,676 units last 20,000
year was within 2% of the total in 2019. 17,500
While this was a very encouraging outturn, the outlook for this year is less promising. New 15,000
housing starts were -17% last year, and the majority of the construction industry will have 12,500
been shuttered for at least a quarter of the year when it is permitted to resume activities,
10,000
and there is no guarantee that this will be in April.
2017 2018 2019 2020 2021F 2022F
We are therefore lowering our forecast for housing completions this year by 8% to Source: CSO, Investec
19,500. On foot of the ongoing supply-demand imbalance, we are also upgrading our
forecast for house price growth this year to 4% (from 1%).
6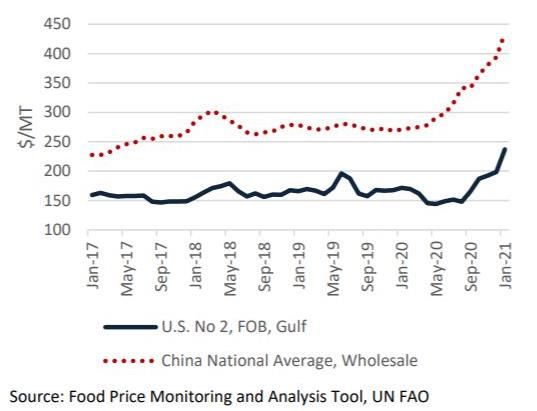
Investec Corporate Finance
Soft Commodities – signs of inflation stirring down on the farm
• In the shadows of business news headlines about record breaking stock markets, bitcoin, and negative interest rates, some market price movements of
  equal (if not more) importance to the real economy and our client base have gone relatively unreported.

• The price movements in question are the staggering moves since the middle of last year in some of the most important agricultural or soft commodities;
  exchange traded prices for vegetable oils up by a quarter, milling wheat up by a third, sugar up by half, soyabeans up by two-thirds, and corn (maize) up
  by three-quarters. Even for what tend to be volatile commodities, these are enormous price movements by historical standards (see historical charts for
  soyabeans, corn, and wheat on CBOT).

• As with crude oil and other hard commodities, markets in agricultural commodities were severely discommoded for a number of months in mid-2020 due
  to shipping and storage disruption for physical traders, and “risk-off” positioning for financial arbitrageurs.
• So a better comparison therefore is between the market now and before the onset of the pandemic this time last year and, with the exception of sugar
  and dairy (which are broadly flat year-on-year), prices for most other agricultural commodities are very significantly higher than pre-COVID levels. The
  Chicago Board of Trade (CBOT) spot price of milling wheat is up by a fifth, while corn and soya are up by half.

• Because of the lagged effects of forward buying as a means of hedging volatility, these prices have yet to feed through fully into the price of animal feed
  and plant based food ingredients, and ultimately into retail prices for food products.

                                                             Soybean Price (CBOT Futures)

                                                                                                2017

                                                                                                                     Source: United States Department of Agriculture

                                                                               7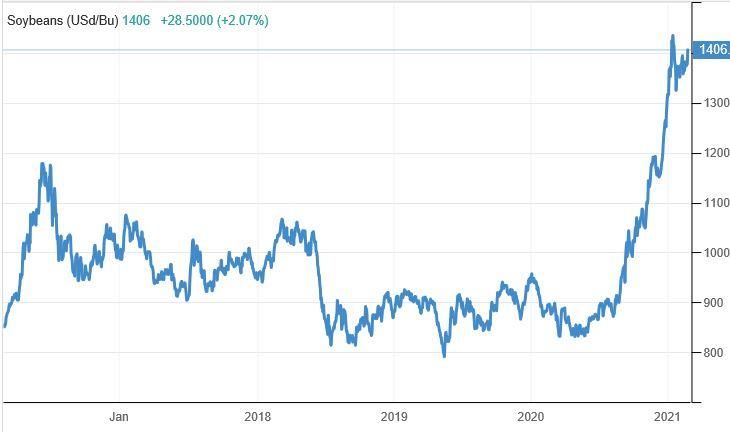
Investec Corporate Finance
Soft Commodities – signs of inflation stirring down on the farm
• With wheat, corn and soyabean prices now at levels not seen since 2014, the impact on margins for tillage farmers, livestock farmers and food
  processors over the next 18 months could be quite significant. In fact, other than the period 2011-2014, and a short period in 2008, these crops are now
  touching prices that have not been seen for decades.

• So is this yet another speculative bubble caused by the floods of cheap money printing by central banks worldwide, or are there fundamental factors at
  play like floods of rain, droughts and diseases that normally drive commodity prices? The answer is probably a combination of both.

The Fundamentals
The virus
Arguably the single biggest factor driving price volatility over the past two years was indeed a virus – not so much the coronavirus but more the African
Swine Fever virus (AFS). This devastating virus swept across the Chinese pig industry from early 2019 and wiped out more than 50% of that nations pig
breeding herd. Pork represents about 70% of all meat consumed in China and the country accounted for 50% of global pork output in 2018, the year prior
to AFS. Herd destocking reduced China’s share of global pork output to about one-third by 2020, in the process wiping out over 60m tonnes of annual
animal feed demand (mostly corn and soya). Conscious of the perilous risk of food price inflation, the Chinese government has supported a massive
investment programme in developing bio-secure (often multi-storey) intensive pig farms (Genus plc which supplies much of the genetics for these new
high-tech farms has seen its share price rise by almost 150%, helped in no small way by this phenomenal demand for new breeding stock). This
investment has led to rapid rebuilding of the pig herd and a consequent rebound in demand for locally grown and imported animal feed ingredients, and
especially for corn and soyabeans.

                                                         Corn (Maize) Price (CBOT Futures)

                                                                                            2017
                                                                                                                   Source: United States Department of Agriculture

                                                                             8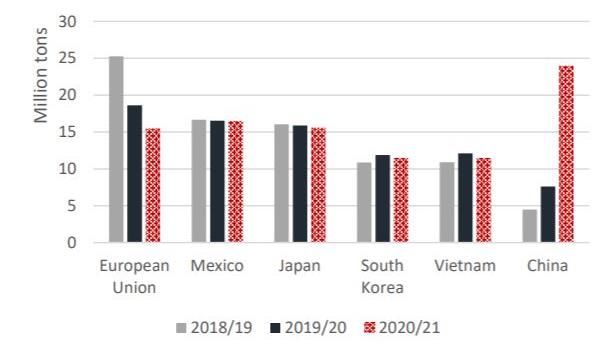
Investec Corporate Finance
Soft Commodities – signs of inflation stirring down on the farm
Global crop stock levels
Resurgent demand from China in the face of dwindling global stock levels has combined to provide very strong fundamental support for agricultural
commodities, most notably corn and soyabeans. The US Department of Agriculture (USDA) projects end of season corn stocks globally to be 15% below 2019
levels and almost 20% lower when Chinese domestic production is excluded. The declines for soya are even more dramatic, at - 25% and -47% respectively
versus the end of the 2019 soya season. And compounding the price squeeze even further were strikes by port workers in Argentina, and the imposition of
export tariffs by Russia and Ukraine which have diminished grain exports from the important Black Sea region.

Speculation by financial investors and hedge funds
Agricultural commodities futures and options trade actively on exchanges like the CBOT, NYSE’s ICE and Euronext’s MATIF. MATIF’s contract lot is for 50
tonnes, which for milling wheat for May 31 delivery means a single contract is currently priced at €12,000. This week the open interest (i.e. live contracts) was
451,000 which equated to 22.5 million tonnes – more than twice the total 2020 UK wheat crop (which incidentally was the lowest year since 1978, with planted
acreage down 25% due to low prices and poor planting conditions). This level of activity in the commodity derivatives market would suggest a lot of speculative
activity and is hardly surprising given the low opportunity cost of capital paired with the strong fundamentals of supply and demand mentioned earlier. Euronext
data shows that financial investors’ (as opposed to commercial users) share of futures markets has gone up from 20% over many years to 45% currently.

Oil price
Historically, soft commodity prices have been correlated with crude oil prices – a factor often explained by increased buying during “times of plenty“ by oil-state
government agencies. But two other factors also play an important indirect role; gas prices determine the cost of producing nitrogen, which is a key fertilizer
input, and crude price levels determine the profitability and therefore production volumes of renewable fuels made from harvestable crop like biodiesel from
canola / oilseed rape, and ethanol from corn (over 40% of the US corn crop goes for ethanol fermentation).

                                                                 Wheat Price (CBOT Futures)

                                                                                                 2017
                                                                                                                       Source: United States Department of Agriculture

                                                                                9
Investec Corporate Finance
Soft Commodities – signs of inflation stirring down on the farm
What will be the impact in 2021?
• Stronger markets for commodities should lead to higher farmgate prices, which is clearly good news for arable farmers who have had to endure low prices
for the past six years (and good news too for suppliers to the sector like Origin Enterprises, Nutrien, and Yara).
• But increasing crop prices present a challenging outlook for livestock farmers who buy animal feed which largely comprises cereal grains which provide
energy and, blended with oil/protein crop extracts, provide protein. Such compound feed increased in price by about 10% in recent months, and looks set to
rise by a further 10% in coming quarters (depending on crop yields in the southern hemisphere and new season plantings in the northern hemisphere).
• The poultry industry is normally the first to pass cost increases through to retail and food service customers (this pricing-power stems from the vertically
integrated nature of the business and its advanced degree of industry consolidation, with typically just three major producers in each market). A rule of
thumb is that €5 per tonne of feed equates to 1 cent per egg, everything else being equal – taking feed price increases of recent months and those
anticipated between now and summer, the price of a dozen eggs would be €1.44 higher, an increase of 30%-40%. Chicken similarly.
• But other more fragmented sectors like processed foods, bakery, and pig meat will likely have to suffer margin pressures throughout the supply chain for
several quarters due to typical lead-lag effects of pushing price increases through the system. Indeed we hear accounts that many retailers are taking a very
tough line on price negotiations in Q1 2021, telling suppliers that they need to recover margin conceded in 2020 when they accepted price increases in the
rush to keep shelves stocked, but didn’t pass these higher cost prices on in full to the shopping basket selling price. Many food suppliers who enjoyed the
twin benefits of bumper volume and wider margins with their retail customers in 2020 may need to prepare for pressure on both fronts in the year ahead.
Soybean and Corn Global Stocks Top Importers of Corn (Oct-Sep) U.S. and China Corn Prices
140
Million Tonnes
120
100
80
60
40
20
0
2017/18 2018/19 2019/20 2020/21
Soybean excl China
Global Corn excl China
Sources: United States Department of Agriculture, FAO, Trading Economics
10Investec Treasury: Currencies
Sterling gets a shot in the arm
16-month EUR/GBP chart
Source: Bloomberg
• One-way traffic: Much to the delight of Irish exporters to the UK and sterling sellers in general, with the exception of a few wobbles, it has been one-way traffic
for the pound over the last two months. Much more than its peers in the G10 currency space, historically sterling does not sit well with uncertainty and with all
the catastrophic doubt surrounding a possible ‘no-deal’ scenario, the pound was always going to relish a positive Brexit outcome. After four and a half arduous
years, politicians, financial markets and the public alike were all more than content to turn the screeching Brexit din down to a barely audible hum after the
EU/UK clinched the elusive deal on Christmas Eve.
cont. overleaf…
11Investec Treasury: Currencies
Sterling gets a shot in the arm
• No neg from the Old Lady: The always-vigilant Bank of England had been keenly watching the latter parts of the EU/UK Brexit negotiations from the sidelines.
They had also been quite vocal in the fact that they were ready to crack open a fresh round of stimulus in the event of a ‘no deal’ Brexit. As that ‘no deal’ risk
subsided so too did the dovish BoE rhetoric. More crucially for the pound however, the chatter around the BoE introducing negative interest rates as part of any
new stimulus plan began to dissipate. Through January and February, some more senior members of the BoE MPC were at pains to stress that the ominous
threat of negative interest rates, while always an option, were not to be part of their mandate in the short to medium term.
• Article 16 debacle: But no sooner had the bitter EU/UK Brexit acrimony of the previous fifty-four months been put to bed, than they were at each other’s
throats again. Just over a month later (Jan 29th), as the world gazed on in envy at what was looking likely to be a hugely impressive UK vaccine rollout
programme, a visibly disgruntled and terribly ill-advised EU triggered and (wisely) aborted the highly contentious NI article 16 protocol. In what appears now to
be a petulant fit of jealousy, the EU had sought to impose the emergency clause to ensure that COVID-19 vaccines had export authorisations to the UK before
departing EU factories. Most definitely not the EU’s finest moment. As a result, the single currency was sold off across a basket of currencies in the preceding
days, taking the EUR/GBP rate below the £0.88 level for the first time in nine months. It appears that the EU were right to be envious; that same UK vaccine
rollout programme has turned out to be the third most successful on the planet behind Israel and the UAE. Nearly 28% (18m people) of the UK population have
been vaccinated in the last ten weeks. The UK government hit its initial target of offering a vaccine to all those in its top four priority groups by 15 February. This
is in stark contrast to most of the EU sovereign nations who have only vaccinated between 5% and 7% of their populace.
• On Tuesday (23rd Feb), the same day that UK PM Johnson pledged that the UK would be free of all COVID-19 related restrictions by late June, German
Chancellor, Angela Merkel, warned that any reopening of the German economy should be weighed up with a serious dose of caution. Without doubt, these
divergent predicaments are the main reason sterling has rallied nearly 7% to fresh twelve-month highs against the euro (£0.8550).
• Sterling is certainly having its ‘moment in the sun’ but we wonder how sustainable this will be. In the event EU vaccinations do catch up and we feel they will
(sooner rather than later), the current weight of importance attached to vaccine roll-outs will surely diminish. As the UK and the EU economies begin to emerge
from their respective level of restrictions and return to some semblance of normality, the current haze surrounding all things Brexit related should also lift. When
that happens, a newly isolated, medicinally supported UK may not to be in as healthy a state as it currently appears to be. The average EUR/GBP rate for the
last twelve months is currently in/around £0.8950. With that in mind and as per chart above, it would be prudent for sterling sellers to try to take advantage of
these very attractive technical levels in the £0.83/£0.86 region.
12Investec Treasury: Commodities
A polar vortex and a drop in US inventory drive oil prices higher
Brent Crude Front Contract
• Brent crude oil has continued higher, touching a high of
$66.80/barrel this month. The latest leg upward has been
driven by the polar vortex that originated above the US-
Canada border but stretched into Texas. Texas accounts
for around 40% of US crude oil production and 25% of its
natural gas production. The temperatures experienced last
week were the lowest in over 30 years, with some areas
even breaking century-old records.
• At its worst, oil production was reduced by as much as
4million barrels/day. The effect of the freezing temperatures
on production is likely to be short-lived, but there has also
been a demand side effect with fewer drivers on icy roads.
Refineries too have been impacted with reduced pipeline
flows and power outages but it is hard to be sure what the
overall effect will be. We saw a significant fall in US
inventory numbers last week of 7 million barrels helping to
keep price higher.
Source: Bloomberg
• OPEC are meeting again next week. Going into the meeting we have the usual argument between Saudi Arabia and Russia – Saudi wants to be cautious
whereas Russia wants to increase output. The Saudis will say that the market has been helped by their extra unilateral cut but they won’t want to stick with
that if others increase production. If the Saudis do increase production by 1 million barrels/day and others also follow suit, it will knock market confidence.
• In other news Iran has reached a compromise with the UN’s weapon inspection team which could be a positive sign in ultimately restoring its oil production.
Iran had been threatening to stop weapons inspections unless US sanctions were lifted, but has decided to allow them to continue for three months. Iran had
been complying with its side of the bargain, whereas it was Trump that pulled out unilaterally. With the new administration in the US, Iran clearly sees there
is a possibility of negotiation and Biden has been clear about this. Interestingly Iran will be attending the next OPEC-plus meeting of the Joint Ministerial
Monitoring Committee ahead of the OPEC meeting, even though it is exempt from cuts. Restoration of output in Iran will be a headache for OPEC as it could
add 2 million barrels/day, although it could take a while.
13Investec Private Finance Ireland Limited
High-end residential property market
• The residential property market over €2M is our preferred space to lend into at
present alongside well located CRE.
• It is encouraging to see the following residential sales noted on the property
price register for 2021 YTD.
€2.8M Belmont, Kerrymount Avenue, Foxrock
€2.5M Glenart, Richmond Avenue South, Dartry
€3.5M 5 Temple Villas, Rathmines
€5.0M, 27 The Barrington, Lansdowne Place
€5.8M High Cross, 40 Temple Road, Dartry
€2.8M 7 De Vesci Terrace, Monkstown
€2.3M 63 Sydney Parade Avenue, Sandymount
€2.0M Sandycove Lodge, Dun Laoghaire
€3.1M 7 Palmerston Park, Rathmines
€2.5M 43 Sandymount Avenue, Sandymount Merrion Lodge, 135 Mount Merrion Avenue, Blackrock.
€2.8M 63 Park Avenue, Sandymount Recently brought to market by Knight Frank for €2.25M.
€2.3M 60 Nutley Avenue, Ballsbridge
€2.3M 26 The Barrington, Lansdowne Place
• Residential property prices rose for the seventh successive month in
December on a m/m basis and, confounding all expectations, prices at the end
of 2020 were 2.2% higher than a year earlier. The figures were released by
the CSO in the latest RPPI release, the most authoritative record of price
changes.
• We have been highlighting the emerging upward pressure on residential
prices for some time. Illustrating this positive momentum, all of the 2.2%
annual gain came in H2 last year, following a flat outturn in H1. Indeed, the
m/m price gain of 0.8% in December was a 30-month high.
• Taking a deeper look at the data, price growth remains stronger outside of
Dublin than in the capital (+3.1% vs. +1.2% y/y), although positive momentum
25 Raglan Road, for sale with Lisney asking €3.5M.
has strengthened in both markets in recent months.
14Contact Details
Corporate Finance
Liam Booth Shane Lawlor Tommy Conway Jonathan Simmons Eoin Kennedy
liam.booth@investec.ie shane.lawlor@investec.ie tommy.conway@investec.ie jonathan.simmons eoin.kennedy@investec.ie
@investec.ie
T: +353 1 421 0345 T: +353 1 421 0347 T: +353 1 421 0358 T: +353 1 421 0351 T: +353 1 421 0386
M: +353 86 2841805 M: +353 86 8073904 M: +353 87 6187842 M: +353 87 6370984 M: +353 87 986 3426
Treasury
Aisling Dodgson Philip Ahearne Peter Ellis Gearoid Keegan Alan Harrison Mark O’Brien
aisling.dodgson philip.ahearne@investec.ie peter.ellis@investec.ie gearoid.keegan@investec.ie alan.harrison@investec.ie mark.obrien@investec.ie
@investec.ie
T: +353 1 421 0084 T: +353 1 421 0128 T: +353 1 421 0223 T: +353 1 421 0098 T: +353 1 421 0086 T: +353 1 421 0091
Investec Private Finance Ireland Limited (IPFIL)
John McWeeney David Gilligan Helen Fitzgerald
john.mcweeney david.gilligan@investec.ie helen.fitzgerald@investec.ie
@investec.ie
T: +353 1 421 0005 T: +353 1 421 0433 T: +353 1 421 0050
Economics Ventures
Ronan Dunphy Leo Hamill
ronan.dunphy@investec.ie leo.Hamill@investec.ie
T: +353 1 421 0468 T: +353 1 421 0431
Chief Executive Officer
Michael Cullen
michael.cullen@investec.ie
T: +353 1 421 0074
15Disclaimer Investec Europe Limited and Investec Private Finance Ireland Limited have issued and are jointly responsible for this publication. Investec Europe Limited (Investec Europe) trading as Investec Europe is regulated by the Central Bank of Ireland. Registered in Ireland Number 222173. Registered office The Harcourt Building, Harcourt Street, Dublin 2, D02 F721. Investec Private Finance Ireland Limited trading as Investec (Investec) is regulated by the Central Bank of Ireland. Registered in Ireland Number 222489. Registered office The Harcourt Building, Harcourt Street, Dublin 2, D02 F721. This publication should be regarded as being for information only and should not be considered as an offer or solicitation to sell, buy or subscribe to any financial instruments, securities or any derivative instrument, or any other rights pertaining thereto (together, “investments”). Neither Investec Europe nor Investec express any opinion as to the present or future value or price of any investments referred to in this publication. This publication may not be reproduced without the consent of Investec Europe or Investec. The information contained in this publication has been compiled from sources believed to be reliable, but, neither Investec Europe, Investec, nor any of its directors, officers, or employees accepts liability for any loss arising from the use hereof or makes any representations as to its accuracy and completeness. The information contained in this publication is valid as at the date of this publication. This information is subject to change without notice, its accuracy is not guaranteed, it may be incomplete or condensed and it may not contain all material information concerning the matters discussed herein. This publication does not constitute investment advice and has been prepared without regard to individual financial circumstances, objectives or particular needs of recipients. Readers should seek their own financial, tax, legal, regulatory and other advice regarding the appropriateness or otherwise of investing in any investments or pursuing any investment strategies. Investec Europe and Investec operate exclusively on an execution only basis. An investment in any of the investments discussed in this publication may result in some or all of the money invested being lost. Past performance is not a reliable guide to future performance. To the extent that this publication is deemed to contain any forecasts as to the performance of any investments, the reader is warned that forecasts are not a reliable indicator of future performance. The value of any investments can fall as well as rise. Foreign currency denominated investments are subject to fluctuations in exchange rates that may have a positive or adverse effect on the value, price or income of such investments. Certain transactions, including those involving futures, options and other derivative instruments, can give rise to substantial risk and are not suitable for all investors. Investec Europe and Investec (or its directors, officers or employees) may to the extent permitted by law, own or have a position in the investments (including derivative instruments or any other rights pertaining thereto) of any issuer or related company referred to herein, and may add to or dispose of any such position or may make a market or act as a principal in any transaction in such investments or financial transactions. Investec Europe’s conflicts of interest policy is available at https://www.investec.com/en_ie/legal/IE/terms-and-policies.html
You can also read