INVESTOR PRESENTATION - AUGUST 2017 - cloudfront.net
←
→
Page content transcription
If your browser does not render page correctly, please read the page content below
INVESTOR PRESENTATION
      AUGUST 2017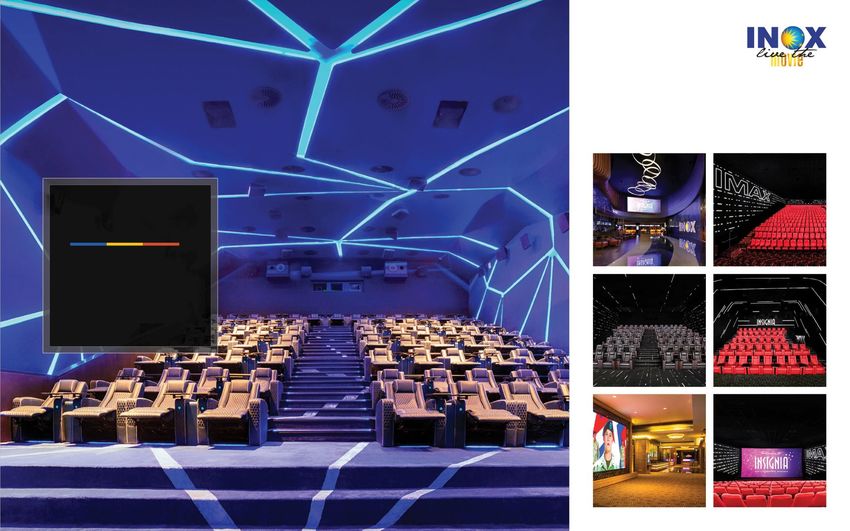
DISCLAIMER

This presentation and the following discussion may contain “forward looking statements” by Inox Leisure Limited (“ILL” or “the
Company”) that are not historical in nature. These forward looking statements, which may include statements relating to
future state of affairs, results of operations, financial condition, business prospects, plans and objectives, are based on the
current beliefs, assumptions, expectations, estimates, and projections of the management of ILL about the business, industry
and markets in which ILL operates.

These statements are not guarantees of future performance, and are subject to known and unknown risks, uncertainties, and
other factors, some of which are beyond ILL’s control and difficult to predict, that could cause actual results, performance or
achievements to differ materially from those in the forward looking statements.

Such statements are not, and should not be construed, as a representation as to future performance or achievements of ILL. In
particular, such statements should not be regarded as a projection of future performance of ILL. It should be noted that the
actual performance or achievements of ILL may vary significantly from such statements.

                                                                                                                                  2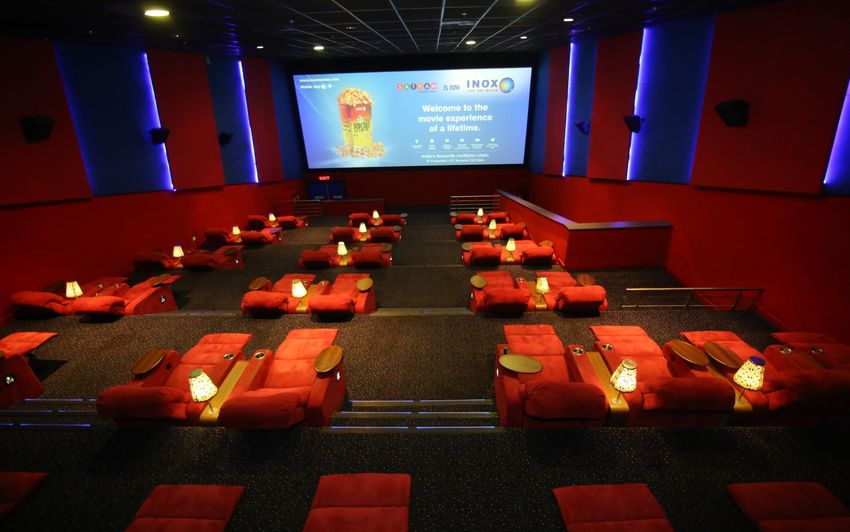
▪   INDUSTRY OVERVIEW

             ▪   COMPANY OVERVIEW

             ▪   COMPETITIVE ADVANTAGE &
                 OUTLOOK
DISCUSSION
SUMMARY      ▪   Q1 FY18 RESULT UPDATE

             ▪   ANNEXURE

                   ▪   PER SCREEN ECONOMICS

                   ▪   SHAREHOLDING STRUCTURE

                   ▪   DETAILED FINANCIALS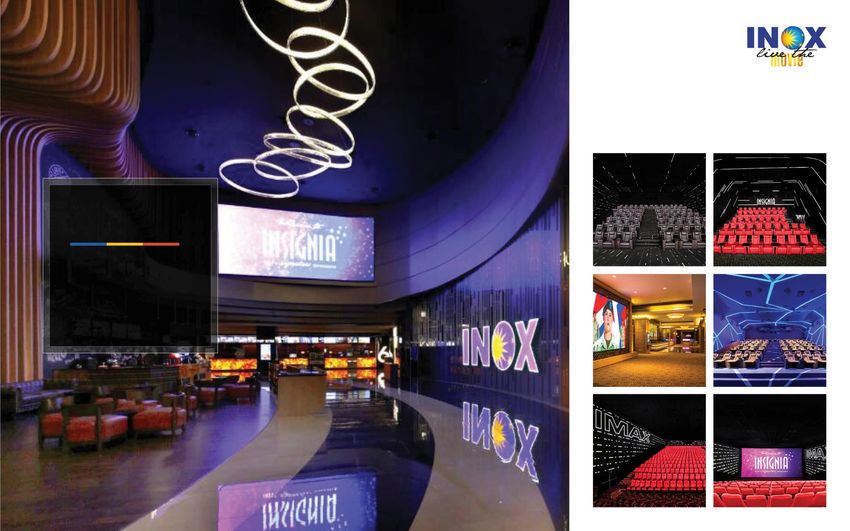
INDUSTRY
OVERVIEW
INDUSTRY                    STRONG FUNDAMENTALS & HUGE GROWTH POTENTIAL
 OVERVIEW

    2nd HIGHEST NUMBER OF THEATRE FOOTFALLS IN THE WORLD                                                       HIGHEST NUMBER OF FILM RELEASES IN THE WORLD
      2,178                                                                Footfalls in Million
                                                                                                         1,602
                1,930

                         1,364
                                                                                                                 745
                                                                                                                              554     476
                                                                                                                                               279        324       241
                                      208      197     176                                                                                                                      204   182       166
                                                                171     169        156     146

      China     India      US        France   Mexico   UK      Japan   S. Korea Germany Russia           India   China        Japan   US      France      UK      Germany S. Korea    Spain     Italy

                                                             HOWEVER, INDIA’S SCREEN DENSITY IS ONE OF THE LOWEST
                                                                                                                                                                     Screens / Million population
              125

                                95
                                                80
                                                               60             57
                                                                                             40
                                                                                                        26               25
                                                                                                                                       16                12                10               8

              US            France             Spain           UK         Germany        South Korea   Japan        Taiwan            China            Thailand           Brazil        India

Source: CRISIL Report, FICCI Whitepaper on Screen Density in India
                                                                                                                                                                                                    5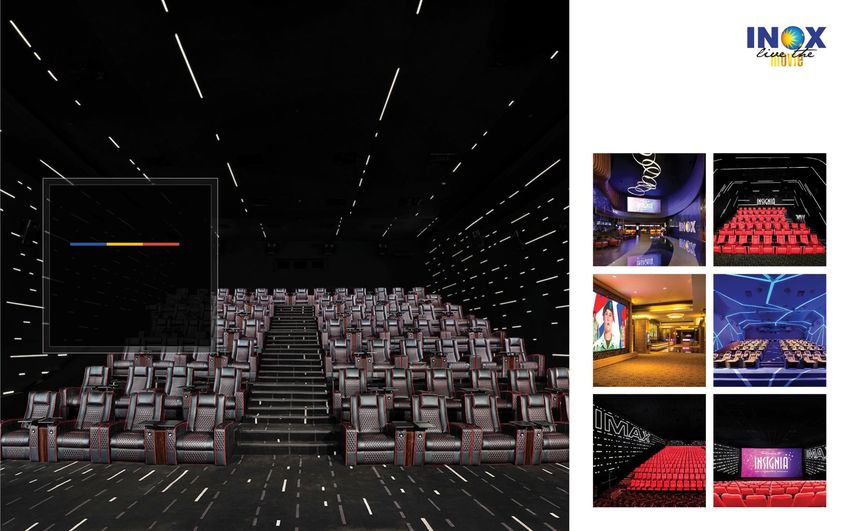
INDUSTRY                  STEADY PERFORMANCE AND RESILIENCE
OVERVIEW

                                           INDIAN FILM INDUSTRY DISPLAYS STEADY PERFORMANCE TRENDS
In Rs. Billion
                                                                                                                     CAGR 7.7%
                                                                                                                                                             206.6
                                                                                                                                            191.6
                                       CAGR 6.1%                                                                              178.2
                                                                                           155.0             166.0
                                                        138.2            142.3
                           125.3         126.4
        112.4

                                                                                                             111.8             117.9        124.2             131.2
                            93.4         93.5            101.4            99.8             106.6
         85.1

         2012               2013         2014           2015              2016             2017E             2018E              2019E       2020E              2021E
                 Domestic Theatrical        Overseas Theatrical             Home Video                 Cable & Satellite Rights         Ancilliary Revenue Streams

                                   DOMESTIC THEATRICALS CONTINUE TO REMAIN THE MAJOR REVENUE CONTRIBUTOR

       75.7%              74.5%          74.0%          73.4%            70.1%            68.8%            67.4%              66.2%         64.8%            63.5%

        2012                2013         2014            2015             2016             2017E            2018E             2019E        2020E             2021E
                                                         % Share of Domestic Theatricals in Total Film Industry Revenues

Source: FICCI-KPMG 2017 Report
                                                                                                                                                                       6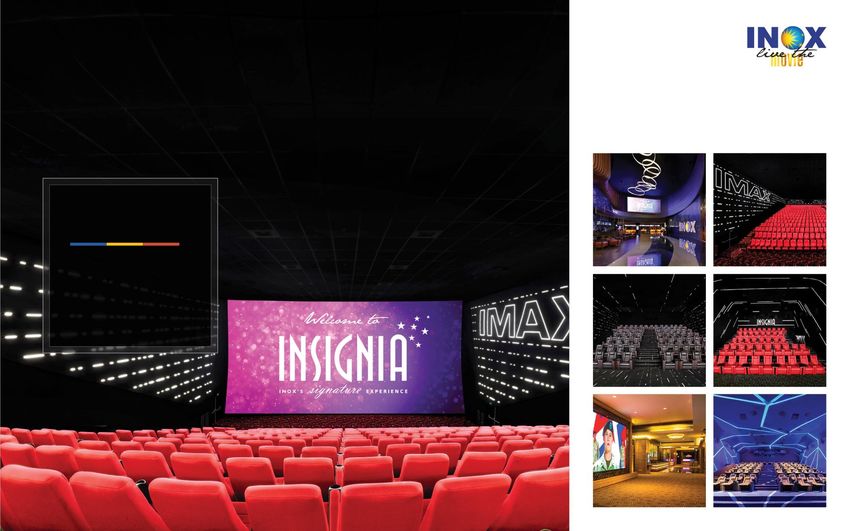
INDUSTRY                    MULTIPLEXES WITNESSING RAPID GROWTH
 OVERVIEW

                                         NUMBER OF SCREENS
                                                                                                       FACTORS DRIVING GROWTH IN MULTIPLEXES:
     9,308         9,121
                                 8,685        8,451
                                                          8,002
                                                                                                       ▪ Superior location, destination and parking
                                                                      6,000     6000        6000         facilities.

                                                                                                       ▪ State of art equipment (high quality video
                                                 1,500        1,630
                                                                        2,134       2,225      2,343     and audio), superior interiors, ambience
          1,075        1,225        1,350
                                                                                                         and service.
        2010         2011         2012         2013         2014       2015      2016        Mar-17    ▪ Multiple screens in one location offer a
                            Single Screens                            Multiplexes                        wider variety of content to the patrons.
                                                                                                         Further, different screen sizes provide
                            Multiplexes currently account for                                            programming flexibility. This results in
                                                                                                         higher occupancy ratios.
                            ~ 30% market share of the screens,
                                       however account for                                             ▪ Strong demographics, rising disposable
                                                                                                         incomes and discretionary spends.
                      more than 40% of box office collections

Source: CRISIL Report, FICCI-KMPG Report 2017, Industry Sources
                                                                                                                                                      7
INDUSTRY            MULTIPLEX INDUSTRY IS IN CONSOLIDATION PHASE
OVERVIEW

                         The Indian multiplex industry has undergone significant consolidation over last decade.
  Industry leaders have grown not only through organic screen additions, but also through acquisition of smaller regional
                                        multiplex chains and single screen players.
                    As a result of this consolidation, the top four players account for ~ 70% of multiplex screens.

                               597

                                                            476
                                                                                                         NUMBER OF SCREENS

                                                                                       330                            312
                                                   239

                   142

                                                                                 3                            4

                         PVR                         INOX                        Carnival                     Cinepolis
                                                              FY11   Aug-17
* As on 16th Aug 2017
                                                                                                                            8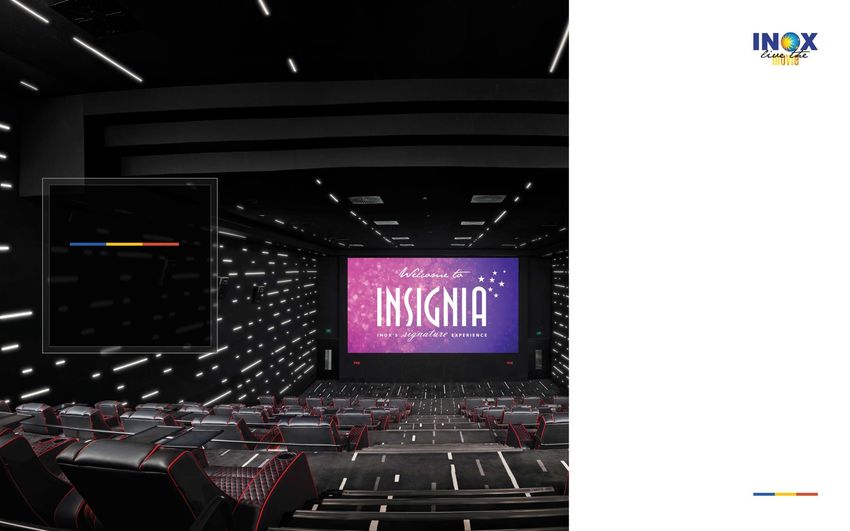
INDUSTRY                      INCREASING NUMBER OF INR 1BN + MOVIES
 OVERVIEW

                                                             WIDER SCREEN RELEASES
                                                                                                                                           6,500
                                                                                                    5,200                      5,300
                                                                                                                    4,500
                                                                              3,446    3,359
                                                        2,638      3,014
                               2,065          2,101
                    1,598                                                                                                                                 INCREASING NUMBER OF
     1,000
                                                                                                                                                          MOVIES ARE GENERATING
     3 Idiots      Dabaang Bodyguard Ek Tha Tiger Dabaang 2       Chennai    Dhoom 3    Kick          P.K         Bajrangi    Dangal    Bahubali 2 -
     (2009)         (2010)   (2011)     (2012)     (2012)         Express     (2013)   (2014)       (2014)        Bhaijaan    (2016)        The
                                                                                                                                                           MORE THAN RS 1 BN IN
                                                                   (2013)                                          (2015)               Conclusion
                                                                                                                                          (2017)        NET BOX OFFICE COLLECTIONS
                                                                                                                                                                DRIVEN BY
                                               HIGHER NUMBER OF INR 1 BN + MOVIES                                                                         WIDER SCREEN RELEASES
                                                                                                                                                                   AND
                                                                                                2                                                       IMPROVING CONTENT QUALITY
                                                                                 2                                            2
                                                                                                              2                              1
                                                                    9
                                                                                 6              7                             6
          1                                            5                                                      5                              5
                         1              2
        2008            2009           2010           2011         2012        2013          2014            2015            2016      Jan-17 to Jul-
                                                                                                                                            17
                                                                INR 1 BN +      INR 2 BN +
Source: Industry
                                                                                                                                                                                  9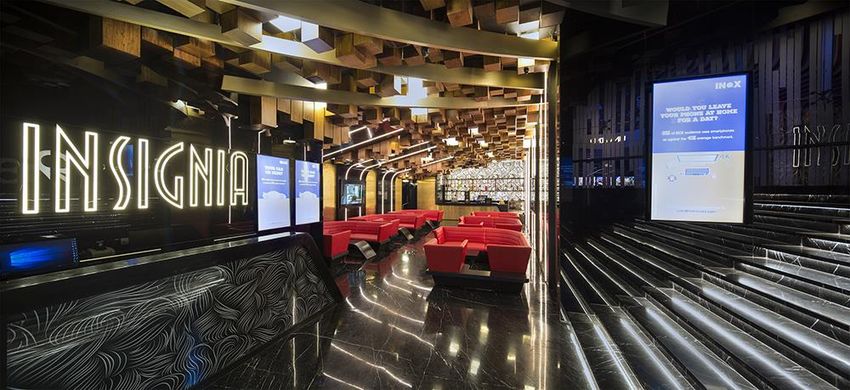
COMPANYOVERVIEW
COMPANY
 OVERVIEW

                    10
TRACK RECORD OF AGGRESSIVE EXPANSION
118 119
107
96 468 476
420
79
72 372
68
63
310
279
257
239
32
26
22
14 119
6 9 91
2 3 76
51
35
8 12 25
FY03 FY04 FY05 FY06 FY07 FY08 FY09 FY10 FY11 FY12 FY13 FY14 FY15 FY16 FY17 Jul-17
Screens Properties
ON AN AVERAGE ADDITION OF 3 SCREENS EVERY MONTH OVER THE LAST DECADE
Note: Includes Acquisition of 1. Calcutta Cine Prime Limited in FY08, 2. Fame India in FY11, 3. Satyam Cineplexes in FY15COMPANY PAN INDIA PRESENCE
OVERVIEW
ONE OF THE LARGEST MULTIPLEX CHAIN OPERATOR IN INDIA
PUNJAB | 1 Property | 6 Screens
UTTAR PRADESH | 5 Properties | 21 Screens
19
States
DELHI | 4 Properties | 13 Screens JHARKHAND | 1 Property | 4 Screens
HARYANA | 5 Properties | 16 Screens 58
RAJASTHAN | 13 Properties | 43 Screens
Cities
MADHYA PRADESH | 4 Properties | 16 Screens Assam | 1 Properties | 2 Screens 119
GUJARAT | 16 Properties | 67 Screens WEST BENGAL | 14 Properties | 55 Screens Properties
ODISHA | 1 Property | 3 Screens
MAHARASHTRA | 25 Properties | 109 Screens
CHHATTISGARH | 2 Properties | 8 Screens 476
GOA | 4 Property | 14 Screens Screens
TELANGANA | 2 Properties | 11 Screens
KARNATAKA |10 Properties | 40 Screens
ANDHRA PRADESH | 7 Properties | 28 Screens
119,395
KERALA |1 Property | 6 Screens TAMIL NADU | 3 Properties | 14 Screens Seats
*Includes 8 management properties with 29 screens and 7,370 seats
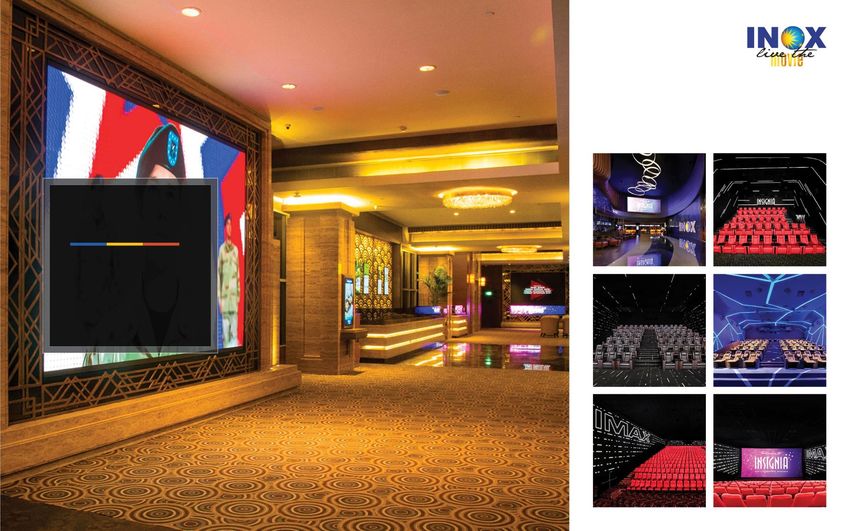
12COMPANY MARQUEE PROPERTIES
OVERVIEW
Kolkata Bengaluru
Quest Malleshwaram
Hyderabad Mumbai
GVK Malad
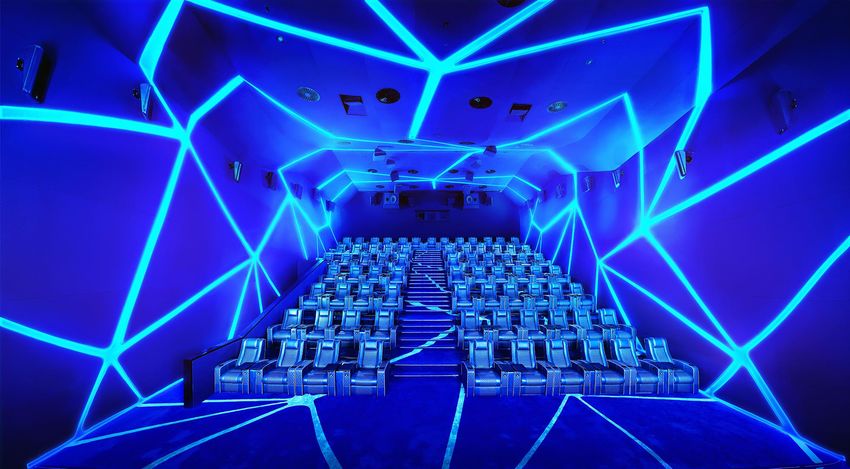
13INSIGNIA – LUXURY MOVIE WATCHING EXPERIENCE
14INOX INSIGNIA
15INOX INSIGNIA
INSIGNIA Presence      Properties   Screens
                                                                  Gujarat                     3           3
                                                                  Mumbai                      6           8
                                                                  Bengaluru                   2           2
     Insignia Screens                                             Pune                        2           3
                                                  16      17      Kolkata                     2           3
     Insignia Properties                   13
                             10     11                            Amritsar                    1           1
 7           7         8                                          Greater Noida               1           1
                                                  20      21
                                                                  Total                      17          21
                                           15
                             11     12                            FY18 Pipeline of INSIGNIA Screens
 7           7         8
                                                                  Mumbai                               5
                                                                  Navi Mumbai                          1
                                                                  Delhi                                3
FY11        FY12      FY13   FY14   FY15   FY16   FY17   Aug-17   Total                                9
COMPANY FINANCIAL SUMMARY
OVERVIEW
Financial Summary is as per IGAAP for FY13 to FY15 and as per IND-AS for FY16 and FY17.
Revenues for FY13 to FY15 are shown net of entertainment tax, consistent with the revenues under IND-AS for FY16 and FY17
REVENUES EBITDA & EBITDA MARGIN PAT & PAT MARGIN
14.8% 16.0% 16.3% 7.0%
13.7% 12.0% 4.8%
2.8% 2.2% 2.5%
1,160.6 1,220.7 81.0
189.1
895.4
762.8 146.1
663.2 122.0 122.7
98.0 36.9 30.6
18.5 20.0
FY13 FY14 FY15 FY16 FY17 FY13 FY14 FY15 FY16 FY17 FY13 FY14 FY15 FY16 FY17
EBITDA EBITDA Margin % PAT PAT Margin %
REVENUES - SEGMENT BREAKUP LEVERAGE ANALYSIS RETURN METRICS
0.9
4.9% 7.9% 8.0% 7.8% 7.6%
0.6 0.5 0.6 16.8%
0.4
4.9% 14.9%
6.5% 9.1% 7.8% 7.9%
21.4% 11.5%
21.3% 21.3% 22.9% 23.3% 10.3%
9.4%
6.1% 7.3%
676.2 522.3 552.5 5.7% 5.7%
68.9% 64.3% 61.6% 61.4% 61.3% 324.6 390.9 3.8%
281.0 242.2 241.2 267.0 317.0
FY13 FY14 FY15 FY16 FY17 FY13 FY14 FY15 FY16 FY17 FY13 FY14 FY15 FY16 FY17
NBOC F&B Advertising Others Debt Equity Debt to Equity ROCE % ROE %
ROE: PAT/Avg. Equity, ROCE: EBIT/Avg. Capital Employed [(Capital Employed = Equity + Total Debt) In Rs Crore
18COMPANY OPERATIONAL SUMMARY
OVERVIEW
FOOTFALLS & OCCUPANCY RATE F & B - SPEND PER HEAD (SPH) (Rs) ADV REV PER OPERATING SCREEN (Rs Lakhs)
28% 28% 25% 29% 28%
58 62 25.1 24.6
55 22.0
534 537 47 49 18.5
386 411 13.7
353
FY13 FY14 FY15 FY16 FY17 FY13 FY14 FY15 FY16 FY17 FY13 FY14 FY15 FY16 FY17
Footfalls (Lakhs) Occupancy (%)
AVERAGE TICKET PRICE (ATP) (Rs) F & B – NET CONTRIBUTION (%) OTHER REV PER OPERATING SCREEN (Rs Lakhs)
178
74.1% 75.0% 76.0% 23.0
71.3% 22.5 21.9
170 70.0% 19.2
164
160 13.7
156
FY13 FY14 FY15 FY16 FY17 FY13 FY14 FY15 FY16 FY17 FY13 FY14 FY15 FY16 FY17
Note: All the above charts exclude managed properties.
19COMPANY OPERATIONAL SUMMARY
OVERVIEW
Operational Summary is as per IGAAP for FY13 to FY15 and as per IND-AS for FY16 and FY17
ENTERTAINMENT TAX (%) FILM DISTRIBUTOR SHARE (%)
44.3% 44.3% 43.8% 43.9% 44.4%
26.8% 26.8% 36.2% 36.4%
22.3% 22.0% 35.9% 34.6% 35.0%
21.6% 21.1% 21.1%
18.3% 17.8% 18.0%
FY13 FY14 FY15 FY16 FY17 FY13 FY14 FY15 FY16 FY17
Entertainment Tax - % on NBOC Entertainment Tax - % on GBOC Distributor Share on NBOC Distributor Share on GBOC
OTHER OVERHEADS PER OPERATING SCREEN (Rs Lakhs)
145.8 157.0 162.5
132.5 138.3
47.5 52.7
40.4 43.4
39.8
40.8 45.5 42.9
35.4 39.2
39.3 40.2 41.3 44.0 45.6
18.1 18.5 20.3 20.1 21.2
FY13 FY14 FY15 FY16 FY17
NBOC (Net Box Office Collections) Employee Benefits Lease Rental & Hire Charges
GBOC (Gross Box Office Collections) CAM, Power & Fuel, R&M Other Overheads
20COMPETITIVE
COMPETITIVE
ADVANTAGE
ADVANTAGES
AND
& OUTLOOK
OUTLOOK
21COMPETITIVE COMPETITIVE ADVANTAGES
ADVANTAGES
Recognised And Trusted Corporate Group
Under-leveraged Balance Sheet With Further Scope For Dilution
Well Diversified Presence Across India
Strong New Screens Pipeline
State Of The Art Technology, Unmatched Service And Ambience
Strong Brand Partnerships
22COMPETITIVE RECOGNISED AND TRUSTED CORPORATE GROUP
ADVANTAGES
USD $3 Billion Inox Group
90 Year track record of 10,000+ employees at 150+ Distribution network spread
diversified across 7 different
consistent business growth business units across India over 50+ countries
businesses
Listed Companies Other Key Companies
Gujarat Fluorochemicals Inox Leisure Inox FMCG Inox Air Products Inox India Private Inox Renewables
Inox Wind Limited
Limited Limited Private Limited Private Limited Limited Limited
▪ Largest producer of ▪ Fully integrated player in ▪ One of the largest ▪ Launched in January 2016, ▪ 50:50 joint venture with ▪ Largest producer of ▪ Engaged in the business
chloromethanes, the wind energy market multiplex chain in India it is focussed on FMCG Air Products Inc., USA cryogenic liquid storage of setting up and
refrigerants and business encompassing and transport tanks in operating of wind farms
▪ State-of-the-art ▪ In the business of setting ▪ Largest producer of
Polytetrafluoroethylene in F&B and non-F&B India
manufacturing plants near up, operating and industrial gases in India ▪ Existing operating
India categories.
Ahmedabad (Gujarat) and managing a national chain ▪ Offers comprehensive capacity of ~ 260 MW in
at Una (Himachal Pradesh) of multiplexes under the ▪ INOX FMCG products ▪ 40 plants spread
▪ Pioneer of carbon credits in solutions in cryogenic states of Rajasthan,
and new facility in Madhya brand name ‘INOX’ branded as “Inox Muchos” throughout the country
India storage, vaporization and Maharashtra, Tamil Nadu
Pradesh. Madhya Pradesh are retailed through
▪ Present in 58 cities with distribution engineering and Madhya Pradesh
facility one of the largest in Modern Trade, General
119 multiplexes and 476
Asia
screens
Trade and HORECA ▪ Has operations in India,
Institutions. USA, Canada,
▪ Ability to provide end-to-
end turnkey solutions for Netherlands and Brazil
wind farms
23COMPETITIVE UNDER-LEVERAGED BALANCE SHEET
ADVANTAGES
Particulars (Rs Cr) March 2017 March 2016
Share Capital 96.2 96.2
Reserves & Surplus 489.0 458.8
Interest in Inox Benefit Trust, at Strong Balance Sheet Low Leverage
-32.7 -32.7 Net D/E: 0.55x
cost
Total Shareholder funds 552.5 522.3
Non-Controlling Interest 0.0 0.0
Total Equity 552.5 522.3 Treasury Stock in Inox Rs. 107 cr at
Total Debt 317.0 267.0
Other Non-Current Liabilities 96.0 95.6
Benefit Trust Current Market
Total Sources of Funds 965.5 884.9 Price *
Fixed Assets 765.3 704.2
Other Non-Current Assets 273.5 230.7
Promoters Stake 48.7%
Current Assets 105.3 117.2
Less: Current Liabilities 178.5 167.2
Net Current Assets -73.3 -50.0
Total Assets 965.5 884.9
Key Balance sheet Ratios March 2017 March 2016
Net Debt : Equity 0.55 0.46 Potential To Grow Aggressively Without
Return on Equity (ROE) 5.7% 16.8%
Return on Capital Employed Any Stress On Balance Sheet
7.3% 14.9%
(ROCE)
ROE: PAT/Avg. Equity, ROCE: EBIT/Avg. Capital Employed [(Capital Employed = Equity + Total Debt) * As on 16th August 2017
24COMPETITIVE PAN INDIA PRESENCE
ADVANTAGES
58 Cities 119 Properties
East, 19
Well Diversified East, 9 North, 28
Distribution of Multiplexes North, 17
across India
South, 23
West, 20
West, 49
South, 12
Access to
Wide Variety of
Regional Content
476 Screens 1,19,395 Seats North, East,
25,173 18,805
East, 72
North, 99
Lower Dependency
on Hindi and English South,
South, 99 23,174 West,
Content 52,243
West, 206
Includes 8 management properties with 29 screens and 7,370 seats
25COMPETITIVE NEW SCREENS PIPELINE
ADVANTAGES
FY18 – PIPELINE
Properties Screens Seats
Properties Screens Seats
Pune (Opened on 26th April) 4 662 FY17 118 468 1,18,285
Greater Noida (Opened on 14th July) 5 1,223
Additions April 17 to July 17 2 9 1,885
Mumbai 5 154
Coimbatore 9 2,088 Expected – FY18 (August 17
9 39 6,577
to March 18)
Cuttack 4 846
Kolhapur 4 870 FY18 128* 515* 1,25,972*
Gurgaon 3 619
Additions post FY18 79 461 85,955
Navi Mumbai 4 779
Delhi 3 109 LEADING TO 207 976 2,11,927
Bhubaneswar 3 612
* Note;
Mysore 4 500 1. 1 property with 1 screen and 612 seats reduced at Bengaluru Shankarnag due to
Total – 11 Properties 48 8,462 Completion of the Lease Tenure
2. 112 seats reduced in Bharuch Bluechip in Gujarat due to conversion into recliner
seats
3. 51 seats reduced in Malleshwaram, Bengaluru due to renovation
STRONG VISIBILITY FROM NEW SCREENS PIPELINE BACKED BY SIGNED AGREEMENTS
26COMPETITIVE STATE OF THE ART TECHNOLOGY, UNMATCHED SERVICE & AMBIENCE
ADVANTAGES
FOCUS ON STRONG TECHNOLOGY, UNMATCHED SERVICE AND AMBIENCE
Focus on technology:
▪ ILL is the first multiplex chain to implement SAP HANA with all integrated functions
▪ Focus on ensuring transparency with regulatory agencies and distributors through daily performance analysis reports
▪ The Network Operations Centre (NOC) in Mumbai enables continuous monitoring, control and reporting of information on all digital systems
across the country. Advertisers can track their advertisement screening at various multiplexes on real-time basis leading to improved transparency
and higher advertising revenues for ILL
▪ ILL have signed the single largest deal with IMAX in India to provide truly encaptivating and completely immersive viewing experience
Focus on high quality video and audio:
▪ ILL owns the high quality DCI Compliant 2K & 4K Digital Projection Systems across all the screens in India
▪ High-definition picture quality, strong 3D capabilities and high frame rate (HFR) (can go up to 60 fps)
▪ ILL has been one of the early adopters of Dolby ATMOS sound technology. Excellent acoustic systems and distortion free sound
Focus on service and ambience:
▪ Focus on providing world class ambience.
▪ ILL with its in-app F&B ordering and Qbuster service, is able to considerably reduce its queue size and transaction time
▪ Emphasis on safety, comfort and convenience
27COMPETITIVE STRONG BRAND PRESENCE
ADVANTAGES
BFSI FMCG CONSUMER DURABLES AUTOMOBILES GEC ECOMMERCE OTHERS
&TELECOMM.
17%
28COMPETITIVE CONTENT PIPELINE – AUGUST 2017
ADVANTAGES
Jab Harry Met Sejal Toilet – Ek Prem Katha The Emoji Movie 3D
Release Date: 4th August 2017 Release Date: 11th August 2017 Release Date: 11th August 2017
Cast: Shahrukh Khan, Anushka Cast: Akshay Kumar, Bhumi Pednekar, Cast: T.J. Miller, James Corden,
Sharma Anupam Kher Steven Wright
Director: Imtiaz Ali Director: Shree Narayan Singh Director: Tony Leondis
Banner: Red Chillies Entertainment Banner: Viacom 18 Banner: Sony Pictures Animation
Annabelle: Creation Partition : 1947 A Gentleman
Release Date: 11th August 2017 Release Date: 18th August 2017 Release Date: 25th August 2017
Cast: Miranda Otto, Stephanie Cast: Huma Qureshi, Manish Dayal, Cast: Sidharth Malhotra, Jacqueline
Sigman, Anthony LaPaglia Gillian Anderson, Hugh Bonneville Fernandez
Director: David Sandberg Director: Gurinder Chadha Director: Krishna D.K., Raj Nidimoru
Banner: New Line Cinema, Atomic Banner: Reliance Entertainment Banner: Fox Star Studios
Monster Productions, The Safran
Company
29COMPETITIVE CONTENT PIPELINE – SEPTEMBER 2017
ADVANTAGES
Baadshaho Kaalakaandi Simran
Release Date: 1st September 2017 Release Date: 8th September 2017 Release Date: 15th September 2017
Cast: Ajay Devgan, Emraan Hashmi, Cast: Saif Ali Khan, Akshay Oberoi, Cast: Kangana Ranaut
Ileana D’Cruz, Esha Gupta, Vidyut Kunaal Roy Kapoor, Amyra Dastur Director: Hansal Mehta
Jamwal Director: Akshat Verma Banner: T Series, Paramhans
Director: Milan Luthria Banner: Cinestaan Film Company Pvt. Creations Entertainments
Banner: Vertex Motion Pictures Ltd.
Lucknow Central KINGSMAN THE GOLDEN CIRCLE JUDWAA 2
(IMAX)
Release Date: 15th September 2017 Release Date: 29th September 2017
Cast: Farhan Akhtar, Diana Penty, Release Date: 22nd September 2017 Cast: Varun Dhawan, Jacqueline
Ronit Roy Cast: Taron Egerton, Julianne Moore Fernandez, Tapsee Pannu
Directors: Ranjit Tiwary Director: Matthew Vaughn Director: David Dhawan
Banner: 20th Century Fox Banner: Fox Star Studios
30COMPETITIVE CONTENT PIPELINE – OCTOBER 2017
ADVANTAGES
Chef Blade Runner 2049 The Lego Ninjago Movie (3D)
Release Date: 6th October 2017 Release Date: 6th October 2017 Release Date: 6th October 2017
Cast: Saif Ali Khan Cast: Ryan Gosling, Harrison Ford Cast: Jackie Chan, Dave Franco,
Director: Raja Krishna Menon Director: Denis Villeneuve Michael Peña
Banner: T-Series Banner: Warner Bros. Pictures Director: Charlie Bean, Bob Logan,
Paul Fisher
Banner: Warner Bros. Pictures
Geostorm (3D IMAX) Secret Supperstar Golmaal Again
Release Date: 27th October 2017 Release Date: TBA Release Date: TBA
Cast: Gerard Butler, Abbie Cornish, Cast: Aamir Khan, Meher Vij Cast: Ajay Devgan, Kareena Kapoor,
Ed Harris Director: Advait Chandan Tusshar Kapoor, Arshad Warsi
Directors: Dean Devlin Banner: Aamir Khan Productions Director: Rohit Shetty
Banner: Warner Bros., Skydance Banner: Phantom Films
Media, Electric Entertainment
31Q1 FY18 RESULT UPDATE
RESULT                Q1 FY18 – RESULT HIGHLIGHTS
 UPDATE

                                                                   Q1 FY18 YoY ANALYSIS
                                                                                                                           In Rs. Crore

                   REVENUES *                                     EBITDA ** and EBITDA MARGIN         PAT and PAT MARGIN

                                                                                                                      8.3%
                                                                                         19.6%       7.4%
                                    387.4                               18.4%
           336.9
                                                                                          75.9                        32.1
                                                                        62.1
                                                                                                     25.0

                      15 %                                                        22 %                        29 %

         Q1 FY17                  Q1 FY18                          Q1 FY17               Q1 FY18    Q1 FY17          Q1 FY18

                                                                         EBIDTA          EBIDTA %       PAT           PAT %

Note: * Net Revenue from Operations, ** EBIDTA excluding Other Income
                                                                                                                                 33
RESULT Q1 FY18 – RESULT ANALYSIS
UPDATE
Q1 FY18 YoY ANALYSIS In Rs. Crore
REVENUES * BREAKUP
387.4
336.9 26.7 Q1 FY18 Revenues increased YoY driven by –
24 % 33.4
21.5
21.3
80.7 57 %
88.2 ✓ Superior Quality of Content
9% ✓ Increased spend on F&B
213.5 239.2
12 %
✓ Strong growth in Advertisement
Revenue
Q1 FY17 Q1 FY18
% Share Q1 FY17 Q1 FY18
Net Box Office 63.4% 61.7%
Food & Beverages 23.9% 22.8%
Advertising 6.3% 8.6%
Other Operating Revenues 6.4% 6.9%
Note: * Net Revenue from Operations
34RESULT TOP 5 FILMS
UPDATE
Half Girlfriend – Dost
Baahubali – The
Q1 FY18 Fast & Furious 8 Tubelight Hindi Medium Se Zyada Girlfriend Se
Conclusion
Kam
Footfalls (Lakhs) 61.25 9.38 7.32 8.69 5.94
GBOC (Rs Crore) 128.74 18.41 17.23 14.96 10.75
Top 5 films accounted for 63% of Q1 FY18 GBOC revenues (41% in Q1 FY17)
GBOC – Gross Box Office Collection
35RESULT KEY OPERATIONAL METRICS
UPDATE
FOOTFALLS AND OCCUPANCY RATE FOOTFALLS AND OCCUPANCY RATE - COMPARABLE PROPERTIES
31% 31% 31% 32%
155 158 149 144
2% 4%
Q1 FY17 Q1 FY18 Q1 FY17 Q1 FY18
Footfalls (Lakhs) Occupancy (%) Footfalls (Lakhs) Occupancy (%)
Footfalls with Management Properties
Q1 FY18: 168 lakhs
AVERAGE TICKET PRICE (ATP) (RS) AVERAGE TICKET PRICE (ATP) (RS) OF COMPARABLE PROPERTIES
193
194
174 175
11 % 10 %
Q1 FY17 Q1 FY18 Q1 FY17 Q1 FY18
All the above charts exclude managed properties
36RESULT KEY OPERATIONAL METRICS
UPDATE
FOOD & BEVERAGES - SPEND PER HEAD (SPH) (RS) FOOD & BEVERAGES - NET CONTRIBUTION (%)
77% 77%
61 65
6%
Q1 FY17 Q1 FY18 Q1 FY17 Q1 FY18
ADVERTISING REVENUES OTHER OPERATING REVENUES
26.7
33.4 21.5
21.3
57 % 24 %
Q1 FY17 Q1 FY18 Q1 FY17 Q1 FY18
Advertising Revenues (Rs Cr) Other Operating Revenues (Rs Cr)
37RESULT KEY OPERATIONAL METRICS
UPDATE
ENTERTAINMENT TAX - % FILM DISTRIBUTOR SHARE (%)
26.2% 26.6% 42.3% 43.7%
20.8% 21.0% 33.5% 34.5%
Q1 FY17 Q1 FY18 Q1 FY17 Q1 FY18
Entertainment Tax - % of NBOC Entertainment Tax - % of GBOC Distributor Share on NBOC Distributor Share on GBOC
Entertainment Average Residual OTHER OVERHEADS PER OPERATING SCREEN (RS LAKHS)
Properties Screens Seats
Tax Period
40.9 42.5
4%
Full Tax 95 384 96,518
12.2 13.0
Exempted 16 63 15,507 3 yrs
11.4 12.2
Above figures exclude management properties
11.8 12.1
5.5 5.3
Q1 FY17 Q1 FY18
Other Overheads CAM, Power & Fuel, R&M
NBOC (Net Box Office Collections) , GBOC (Gross Box Office Collections) Lease Rent & Hire Charges Employee Benefits
38ANNEXURE
ANNEXURE            PER SCREEN ECONOMICS

                                                                                        Per Screen Economics is as per IND-AS and post GST impact
Per Screen Economics: (In Rs Lakhs)                                   Per Screen Economics:
ATP (Rs)                                                      178     % Breakup of Revenues
SPH (Rs)                                                       62      Net Box Office Collections (NBOC)                             62% - 63%
Occupancy (%)                                                 30%      Food & Beverages                                              23% - 24%
                                                                       Advertising Income                                              8% - 9%
Revenue from Operations                                      314.0     Other Income                                                    7% - 8%
 Net Box Office Revenue (NBOC)                               196.1
 Food & Beverages                                             71.7    Per Screen Economics: (In Rs Lakhs)
 Advertising Income                                           23.6    Fixed Costs - ~ 57% - 58% of total costs                           141.6
 Other Revenues                                               22.6    Contribution (Sales – Variable costs)                              205.8
Costs:                                                                Breakeven Contribution (to cover fixed costs)                      141.6
 Distributors' Share @ 44% of NBOC                            86.3    Breakeven Revenues                                                 216.0
 Other Exhibition Cost                                          2.5   Breakeven NBOC                                                     134.9
 Food & Beverages Cost                                        19.4    Breakeven Occupancy %                                              21.0%
 Lease Rental & Hire Charges                                  45.6
 CAM, Power & Fuel, R&M                                       42.9    Per Screen Economics:
 Employee Benefits Expense (excluding corporate overheads)    13.0    ▪ Long term steady occupancy levels of ~ 30% and stable ATP.
 Other Overheads                                              40.1
EBITDA                                                        64.2    ▪ Gradually improving share of F&B and advertising revenues.
EBITDA Margin %                                              20.4%    ▪ EBITDA margins per screen of ~ 20% - 21%.
Depreciation                                                  19.2
EBIT                                                          45.0    ▪ ROCE per screen of ~ 15% - 20%.
Gross Capex                                                  250.0    ▪ Significant scope for improvement in ROCE per screen driven by
Working Capital                                                 0.0
                                                                        increasing share of F&B revenues (~ 75% contribution) and
Capital Employed                                             250.0
                                                                        advertising revenues (~ 95% contribution) in the future.
ROCE %                                                       18.0%

                                                                                                                                          40
ANNEXURE SHAREHOLDING STRUCTURE
Share Price Performance Market Data As on 16.08.17 (BSE)
300 Market capitalization (Rs Cr) 2,368.0
250 Price (Rs.) 245.5
200 No. of shares outstanding (Cr) 9.6
150 Face Value (Rs.) 10.0
Feb-17 Mar-17 Apr-17 May-17 Jun-17 Jul-17
52 week High-Low (Rs.) 305.85 – 193.00
Source: BSE
% Shareholding – June 2017 Key Institutional Investors – June 2017 % Holding
Public / DSP Blackrock MF 6.19%
Others, 13.92
Promoter & Goldman Sachs India 3.39%
Inox Benefit Morgan Stanley 3.38%
Promoter
Trust, 4.51
Group, 48.70 Birla Sunlife MF 3.22%
Reliance MF 3.22%
DII, 17.75 Kuwait Investment Authority Fund 3.01%
ICICI Prudential MF 1.95%
Aadi Financial Advisors LLP 1.49%
FII, 15.12
TATA MF 1.17%
Sundaram MF 1.14%
Source: Company * Shares held under Inox Benefit Trust reflect the Treasury Shares Source: Company
41ANNEXURE CONSOLIDATED P&L STATEMENT
Particulars (In Rs Cr) Q1 FY18 Q1 FY17 YoY % Q4 FY17 QoQ % FY17
Revenue from Operations 387.4 336.9 15.0% 288.5 34.3% 1,220.7
Exhibition Cost (Distributor Share) 107.1 95.0 12.7% 79.8 34.2% 345.3
Food & Beverages Cost 20.5 18.4 11.3% 15.2 34.5% 68.1
Employee Benefits Expense 23.0 21.6 6.0% 21.6 6.3% 86.4
Lease Rental & Hire Charges 52.2 46.5 12.3% 48.4 7.8% 185.8
CAM, Power & Fuel, R&M 52.6 45.0 16.9% 43.6 20.6% 174.5
Other Expenses 56.3 48.3 16.5% 54.8 2.7% 214.6
EBITDA 75.9 62.1 22.2% 25.1 202.2% 146.1
EBITDA Margin % 19.6% 18.4% 115 bps 8.7% 1,088 bps 12.0%
Depreciation & Amortisation 21.5 20.3 6.2% 21.6 -0.4% 84.1
Impairment Loss on PP&E 0.6 0.0 - 1.3 -53.9% 1.3
Other Income 2.3 2.5 -6.3% 2.3 1.1% 9.1
Finance Cost 7.2 5.8 24.3% 7.2 0.0% 25.3
Exceptional Items 0.0 0.0 - 0.0 - 0.0
Share of Profit from Joint Ventures 0.0 0.0 - 0.0 - 0.1
PBT 48.9 38.5 26.9% -2.6 - 44.6
Current Tax 17.8 13.8 29.1% -2.3 - 14.7
Deferred Tax -1.1 -0.3 - 0.9 - 0.9
Tax pertaining to earlier years 0.0 0.0 - -1.6 - -1.6
PAT 32.1 25.0 28.6% 0.3 - 30.6
PAT Margin % 8.3% 7.4% 88 bps 0.1% 818 bps 2.5%
Earnings Per Share (EPS) 3.49 2.72 28.3% 0.04 - 3.33
42ANNEXURE CONSOLIDATED BALANCE SHEET
Particulars (In Rs Cr) March 2017 March 2016 Particulars (In Rs Cr) March 2017 March 2016
Equity Share Capital 96.2 96.2 Non-Current Assets:
Other Equity 489.0 458.8 Property, Plant & Equipment 672.8 618.1
Interest in Inox Benefit Trust, at cost -32.7 -32.7 Capital work-in-progress 62.6 55.7
Goodwill 17.5 17.9
Equity attributable to owners of
552.5 522.3 Other Intangible Assets 12.4 12.5
the company
Investments in Joint Ventures 0.1 0.0
Non-Controlling Interest 0.0 0.0
Other Investments 1.2 1.3
Total Equity 552.5 522.3 Loans 69.0 58.7
Non-current liabilities: Other Financial Assets 71.8 56.0
Borrowings 291.9 216.9 Deferred Tax Assets (Net) 48.3 56.2
Other Financial Liabilities 3.1 2.4 Other Non Current Assets 77.6 51.7
Other Non-current Liabilities 82.9 85.4 Tax Assets (Net) 5.5 6.8
Provisions 10.0 7.8 Total Non Current Assets 1,038.8 934.9
Total of Non-Current Liabilities 388.0 312.5 Current Assets:
Current Liabilities: Other Investments 10.7 15.2
Inventories 9.1 6.9
Borrowings 0.0 25.1
Trade Receivables 46.6 51.6
Trade Payables 88.4 73.3
Cash and Bank Balances 9.8 22.7
Other Financial Liabilities 64.8 60.3
Bank Balances Other than above 3.4 4.5
Other Current Liabilities 36.0 38.3 Loans 4.4 0.2
Provisions 14.4 14.3 Other Financial Assets 0.3 1.8
Current Tax Liabilities (Net) 0.0 5.9 Other Current Assets 21.0 14.2
Total of Current Liabilities 203.6 217.3 Total Current Assets 105.3 117.1
Total Equity & Liabilities 1,144.1 1,052.1 Total Assets 1,144.1 1,052.1
43THANK YOU
Nayana Borthakur Vatsal Mehta / Nilesh Dalvi
AVP - Brand & Corporate Communication FOR FURTHER QUERIES IR Consultant
Contact No: +91 22 4062 6900 Contact No:+91 9712129581 / 9819289131
Email: contact@inoxmovies.com Email ID: vatsal.mehta@dickensonir.com
nilesh.dalvi@dickensonir.com
44You can also read


