Investor Presentation H1 2021 Update - www.lancashiregroup.com - Lancashire Group
←
→
Page content transcription
If your browser does not render page correctly, please read the page content below
Investor Presentation
H1 2021 Update
www.lancashiregroup.com
Safe harbor statements
NOTE REGARDING FORWARD-LOOKING STATEMENTS:
CERTAIN STATEMENTS AND INDICATIVE PROJECTIONS (WHICH MAY INCLUDE MODELLED LOSS SCENARIOS) MADE IN THIS PRESENTATION OR OTHERWISE THAT ARE NOT BASED ON CURRENT OR HISTORICAL FACTS ARE
FORWARD-LOOKING IN NATURE INCLUDING, WITHOUT LIMITATION, STATEMENTS CONTAINING THE WORDS “BELIEVES”, “AIMS”, “ANTICIPATES”, “PLANS”, “PROJECTS”, “FORECASTS”, “GUIDANCE”, “INTENDS”,
“EXPECTS”, “ESTIMATES”, “PREDICTS”, “MAY”, “CAN”, “LIKELY”, “WILL”, “SEEKS”, “SHOULD”, OR, IN EACH CASE, THEIR NEGATIVE OR COMPARABLE TERMINOLOGY. SUCH FORWARD-LOOKING STATEMENTS INVOLVE
KNOWN AND UNKNOWN RISKS, UNCERTAINTIES AND OTHER IMPORTANT FACTORS THAT COULD CAUSE THE ACTUAL RESULTS, PERFORMANCE OR ACHIEVEMENTS OF THE GROUP TO BE MATERIALLY DIFFERENT FROM
FUTURE RESULTS, PERFORMANCE OR ACHIEVEMENTS EXPRESSED OR IMPLIED BY SUCH FORWARD-LOOKING STATEMENTS. FOR A DESCRIPTION OF SOME OF THESE FACTORS, SEE THE GROUP’S ANNUAL REPORT AND
ACCOUNTS FOR THE YEAR ENDED 31 DECEMBER 2020. ALL FORWARD-LOOKING STATEMENTS IN THIS PRESENTATION OR OTHERWISE SPEAK ONLY AS AT THE DATE OF PUBLICATION. LANCASHIRE EXPRESSLY DISCLAIMS
ANY OBLIGATION OR UNDERTAKING (SAVE AS REQUIRED TO COMPLY WITH ANY LEGAL OR REGULATORY OBLIGATIONS INCLUDING THE RULES OF THE LONDON STOCK EXCHANGE) TO DISSEMINATE ANY UPDATES OR
REVISIONS TO ANY FORWARD-LOOKING STATEMENT TO REFLECT ANY CHANGES IN THE GROUP’S EXPECTATIONS OR CIRCUMSTANCES ON WHICH ANY SUCH STATEMENT IS BASED. ALL SUBSEQUENT WRITTEN AND ORAL
FORWARD-LOOKING STATEMENTS ATTRIBUTABLE TO THE GROUP OR INDIVIDUALS ACTING ON BEHALF OF THE GROUP ARE EXPRESSLY QUALIFIED IN THEIR ENTIRETY BY THIS NOTE. PROSPECTIVE INVESTORS SHOULD
SPECIFICALLY CONSIDER THE FACTORS IDENTIFIED IN THIS PRESENTATION WHICH COULD CAUSE ACTUAL RESULTS TO DIFFER BEFORE MAKING AN INVESTMENT DECISION.

NOTE REGARDING ALTERNATIVE PERFORMANCE MEASURES:
THE GROUP USES ALTERNATIVE PERFORMANCE MEASURES TO HELP EXPLAIN BUSINESS PERFORMANCE AND FINANCIAL POSITION. THESE MEASURES HAVE BEEN CALCULATED CONSISTENTLY WITH THOSE AS DISCLOSED
IN THE GROUP’S ANNUAL REPORT AND ACCOUNTS FOR THE YEAR ENDED 31 DECEMBER 2020.

NOTE REGARDING RPI METHODOLOGY:
THE RENEWAL PRICE INDEX (“RPI”) IS AN INTERNAL METHODOLOGY THAT MANAGEMENT USES TO TRACK TRENDS IN PREMIUM RATES OF A PORTFOLIO OF INSURANCE AND REINSURANCE CONTRACTS. THE RPI WRITTEN
IN THE RESPECTIVE SEGMENTS IS CALCULATED ON A PER CONTRACT BASIS AND REFLECTS MANAGEMENT’S ASSESSMENT OF RELATIVE CHANGES IN PRICE, TERMS, CONDITIONS AND LIMITS AND IS WEIGHTED BY
PREMIUM VOLUME. THE CALCULATION INVOLVES A DEGREE OF JUDGEMENT IN RELATION TO COMPARABILITY OF CONTRACTS AND THE ASSESSMENT NOTED ABOVE. TO ENHANCE THE RPI METHODOLOGY,
MANAGEMENT MAY REVISE THE METHODOLOGY AND ASSUMPTIONS UNDERLYING THE RPI, SO THE TRENDS IN PREMIUM RATES REFLECTED IN THE RPI MAY NOT BE COMPARABLE OVER TIME. CONSIDERATION IS ONLY
GIVEN TO RENEWALS OF A COMPARABLE NATURE SO IT DOES NOT REFLECT EVERY CONTRACT IN THE PORTFOLIO OF CONTRACTS OR, FOR EXAMPLE, NEW BUSINESS LINES WITHIN A SEGMENT. THE FUTURE
PROFITABILITY OF THE PORTFOLIO OF CONTRACTS WITHIN THE RPI IS DEPENDENT UPON MANY FACTORS BESIDES THE TRENDS IN PREMIUM RATES.

NOTE REGARDING COVID-19 LOSS:
OUR COVID-19 LOSS PRIMARILY RELATES TO EXPOSURES WITHIN OUR PROPERTY AND CASUALTY REINSURANCE SEGMENT. GIVEN THE ONGOING NATURE OF THE COVID-19 PANDEMIC AND THE UNCERTAIN IMPACT ON
THE INSURANCE INDUSTRY, THE GROUP’S ACTUAL ULTIMATE LOSS MAY VARY, PERHAPS MATERIALLY, FROM THE CURRENT ESTIMATE. THE FINAL SETTLEMENT OF ALL OF THESE CLAIMS IS LIKELY TO TAKE PLACE OVER A
CONSIDERABLE PERIOD OF TIME. LANCASHIRE DOES NOT WRITE THE FOLLOWING LINES OF BUSINESS: TRAVEL INSURANCE; TRADE CREDIT; AND LONG-TERM LIFE AND PRIOR TO THE COVID-19 PANDEMIC DID NOT
WRITE DIRECTORS’ AND OFFICERS’ LIABILITY OR MEDICAL MALPRACTICE. THE GROUP UNDERWRITES A SMALL NUMBER OF EVENT CANCELLATION CONTRACTS AND HAS MINIMAL EXPOSURE THROUGH MORTGAGE,
ACCIDENT AND HEALTH BUSINESS.

 2
H1 2021 highlights

    • Strongest H1 for gross premium written since inception
         • GPW of $697.2 million in H1 2021, 40.7% growth versus H1 2020.
         • Rate increases remain strong, with RPI of 111%.
    • Strong underwriting performance despite Winter Storm Uri losses
         • Combined ratio of 80.7% and underwriting profit of $127.1 million.
         • Winter Storm Uri losses of $44.8 million (net of reinsurance and reinstatement premiums).
         • No change to our estimate of COVID-19 related losses.
    • Further hiring of new teams, continuing to build out Lancashire’s book of business.
    • We remain strongly capitalised and are continuing to put more capital to work
        • Completed long-term debt refinancing in H1 2021. Debt to tangible capital ratio 24.2%.
        • Regulatory ECR ratio of 254% at 31 March 2021.
        • Capital headroom remains for further growth in 2021 and beyond.
    • Interim dividend of $0.05 per common share declared on 27 July 2021.

3
Strong premium growth in H1 2021
Gross premiums written ($m) and cumulative RPI for the half year 2017 to 2021
Total Property and casualty insurance
Property and casualty reinsurance
$800 150% $120 150%
$400 150%
$700
140% $350 $100 140%
$600 140%
130% $300 $80 130%
$500 130%
$250
$400 120% $60 120%
$200 120%
$300
110% $40 110%
$150
$200 110%
100% $100 $20 100%
$100
100%
$50
$0 90% $0 90%
2017 2018 2019 2020 2021 $0 90% 2017 2018 2019 2020 2021
2017 2018 2019 2020 2021
Aviation Energy Marine
$70 150% $120 150% $60 140%
$60 140% $100 140% $50 130%
$50 $40
130% $80 130%
120%
$40
120% $60 120% $30
$30 110%
110% $40 110% $20
$20
$10 100%
$10 100% $20 100%
$0 90% $0 90% $0 90%
2017 2018 2019 2020 2021 2017 2018 2019 2020 2021 2017 2018 2019 2020 2021
4H1 2021 income statement
Twelve
Six months Six months months
2021 2020 2020
$m $m $m
Gross premiums written 697.2 495.5 814.1
Outwards reinsurance premiums (269.3) (213.0) (294.7)
Net premiums written 427.9 282.5 519.4
Net premiums earned 315.3 230.8 475.8
Insurance losses and loss adjustment expenses (136.2) (159.2) (363.6)
Insurance losses and loss adjustment expenses recoverable 15.1 26.8 79.8
Net acquisition expenses (67.1) (59.0) (115.0)
Underwriting profit 127.1 39.4 77.0
Net investment income, including realised gains & losses 21.9 10.0 48.3
Share of profit of associate 0.3 1.1 10.7
Other income 7.0 3.5 15.3
Financing costs (30.7) (11.0) (20.1)
Net foreign exchange gains (losses) 1.6 (3.9) 1.4
Equity based compensation (7.0) (7.0) (12.3)
General and administrative expenses (66.1) (55.1) (114.4)
Net profit (loss) before tax 54.1 (23.0) 5.9
Tax charge (6.2) (3.0) (1.4)
Net profit (loss) after tax 47.9 (26.0) 4.5
Non-controlling interest (0.2) - (0.3)
Other comprehensive (losses) income (14.1) 11.3 20.1
Comprehensive income (loss) - attributable to Lancashire 33.6 (14.7) 24.3
Net loss ratio 38.4% 57.4% 59.6%
Net acquisition ratio 21.3% 25.6% 24.2%
G&A expense ratio 21.0% 23.9% 24.0%
Combined ratio 80.7% 106.9% 107.8%
5 Change in FCBVS 2.4% 7.2% 10.2%H1 2021 loss environment
• Net Loss ratio of 38.4% for the first half of 2021.
• Winter Storm Uri losses of $44.8 million (net of reinsurance and reinstatement premium).
• No material change to our estimated COVID-19 related losses.
• Prior year favourable development of $53.6 million (see table).
Accident year PY Development
($m)
2016 AY & prior 16.7
2017 AY 12.9
2018 AY (1.6)
2019 AY 1.8
2020 AY 23.8
Total 53.6
Note: Large losses – risk losses of $5 million or more.
6BSCR Coverage ratio development
• The Q1 2021 coverage ratio of 254% incorporates additional regulatory capital from the Q1 debt
issuance. We retain meaningful regulatory headroom to fund further growth.
• The stress scenario incorporates a net loss cat event – representative of our 1 in 100 GoM PML
at 30 June 2021.
Note: The Q1 2021 BSCR coverage ratio is as submitted to the BMA and is calculated on a best efforts basis.
7Investments: conservative portfolio structure – quality
Asset Allocation Credit Quality
total investment portfolio fixed maturities and managed cash
Corporate and other loans
5%
Alternative investments Cash and short term
9% 24% AA, 35%
A, 27%
Structured
products
9%
Duration
1.8 years
Sovereign
17%
Corporate
bonds
AAA, 17% BBB, 15%
30%
Sub-sovereign/Municipals
6% BB or below, 6%
• Total investment portfolio at 30 June 2021 = $2,541 million (incl. operating cash of $289 million).
• Total fixed maturities and managed cash at 30 June 2021 = $2,023.2 million.
• Average credit rating of A+ (fixed maturities and managed cash).
8Outlook - positioned for growth
• Our core strategy has not changed – navigate the insurance cycle, manage the business for the
long term, ignore the herd and be bold when we see true opportunity.
• After years of soft market conditions corrective action has led to multi-year rate hardening across
the majority of our underwriting portfolio.
• We have emerged from the soft market in a strong position and therefore have the ability to grow
as the underwriting opportunity continues to improve.
• Disciplined growth is important now to balance returns over the longer term. Growth will allow
Lancashire to mitigate the weaker years through portfolio optimisation, reducing risk levels where
appropriate and we expect this to enhance returns over the cycle.
• We will continue to grow while the opportunity persists as we look to maximise returns for
shareholders in an attractive rating environment. We expect further growth to be supported in
2022 from existing and new teams.
9APPENDIX www.lancashiregroup.com
Changing business mix drives changes in the attritional loss ratio
     • When Lancashire began writing business in 2005/6 around 80% of our premiums related to low
       attrition/high volatility risk exposure.
     • As we integrated Lancashire Syndicates from 2014, the low attrition/high volatility exposure premiums
       reduced to approximately 60%.
     • The softer part of the cycle in some specialty lines saw an increase in low attrition/high volatility
       exposure to approximately 70% in 2017.
     • Since 2018, we have been growing products with medium/high attrition and lower volatility exposures.
     • As our premiums can and have changed significantly year-on-year, the balance of higher vs lower
       attritional loss ratio business can also change dramatically.
     • The key for us remains a focus on Change in FCBVS, a measure we aim to maximise each year.

                                                     GPW by level of attrition
               100%

               80%
                                                             Low attrition
               60%

               40%

               20%                                           High attrition
                0%
                  2006   2007   2008   2009   2010   2011   2012   2013   2014   2015   2016   2017   2018   2019   2020

11
Business mix benefits
• The relative loss ratio split between attritional/large/catastrophe varies by business line.
• More attritional business generally has a lower capital requirement. The underlying combined ratio
may be higher than catastrophe business, but the return on capital is positive and accretive to
Change in FCBVS.
• We continue to be flexible in the balance of business between high and low attritional business,
dependent on market conditions. Therefore, the 2021 year-end attritional loss ratio is expected to
be within the previously announced range of 35-40%.
• We tend to reserve more conservatively on new lines while we get comfortable with underwriting
and claims performance.
EXAMPLES Property Cat Exposed Traditional Specialty New specialty lines
Property catastrophe Upstream energy
Product Aviation deductible
reinsurance construction
Capital requirement High Medium Low
Catastrophe exposure High Medium Low
Large loss frequency Low High Low
Attritional losses Low Medium High
Volatility of returns High Medium Low
Typical attritional loss ratio Sub 20% 20%-50% Above 50%
12Claims inflation is not a major concern for Lancashire
• We write a predominantly short-tail book, with the bulk of our policies renewing every year.
• Policies renew through the year, not just on January 1st.
• Clients provide regularly updated schedules of insured values where required.
• Catastrophe modelling includes (our) inflation loading.
• A weak relationship between claims inflation and economic inflation (see chart below).
• Short-term demand driven spikes in materials/labour reflected in our wider attritional loss ratio
guidance.
Tenuous link between claims inflation and economic inflation
8.0%
6.0%
4.0%
2.0%
0.0%
2008 2009 2010 2011 2012 2013 2014 2015 2016 2017 2018 2019 2020
-2.0%
-4.0%
US claim cost indices CPI PPI
Source: WTW, Bloomberg
13Our approach to capital
• Two of our three long-stated strategic priorities relate to capital: Effectively Balance Risk and Return
and Operate Nimbly Through the Cycle
• We have a track record of active capital management, returning or raising capital where
appropriate given expected underwriting returns.
• Since inception we have returned $2.9bn to shareholders, approximately 144% of our current
market capitalisation of £1.535bn ($2.103bn) as at 21 July 2021.
• We raised $340 million additional equity share capital in June 2020 and refinanced our long-term
debt capital in March 2021 to enable us to write more business in a hardening market.
• We monitor capital and headroom against internal, rating agency and regulatory requirements. Of these
the AM BCAR capital requirement under their ‘Cat Stress’ capital model is the most restrictive.
Preferred headroom is
indicative. Management’s
preferred headroom target is
flexible depending on market
opportunities & conditions
(1) 2021 proforma capital requirements are estimated on a mean loss basis. Capital requirements are as follows: AM Best VaR 99.6 ‘cat stress’ model, S&P
‘AA’, BSCR – the BMA new methodology and internal, based on our forecast exposures.
14Maintaining a strong capital position
• We maintain a conservative capital position such that we can withstand a significant catastrophe event
and still retain our ratings and regulatory solvency position.
• Our key capital driver is the AM Best ‘cat stress’ model, which is more penal than the published standard
model as it reduces available capital by a 1 in 100 year All Perils Worldwide PML. We monitor headroom
against the BCAR tolerance of 10% at the 99.6 confidence level to maintain our capital assessment as
“strongest” by AM Best.
• Our successful H1 2021 debt issuance has increased the efficiency of our capital position as our new Tier
2 subordinated debt is fully allowable as regulatory and S&P capital.
AM Best capital adequacy ratios (insurance industry under standard model)1
BMA Regulatory Capital Requirements Q1 2021 Q1 2021 2020 2020 2019 2019
90
80 $m % $m % $m %
70
Total statutory economic capital and surplus 1,892 1,470 1,117
60
50 Enhanced capital requirement 745 254% 668 220% 496 225%
40
30
Best's Capital Best's Capital Best's Capital Best's Capital Coverage ratio of the available statutory capital and surplus. Calculated
Adequacy Ratio (VaR Adequacy Ratio (VaR Adequacy Ratio (VaR Adequacy Ratio (VaR
under the BMA’s BSCR calculation methodology. Q2 2021 BSCR
95%) 99%) 99.5%) 99.6%)
(1) Insurance industry average includes: Fidelis, Partner Re, Hamilton Insurance Group, Arch, Hiscox, coverage ratio not yet available.
Everest Re, Axis, aspen, Hanover Insurance Group, Beazley, Greenlight, Renaissance Re, Argo and Axa
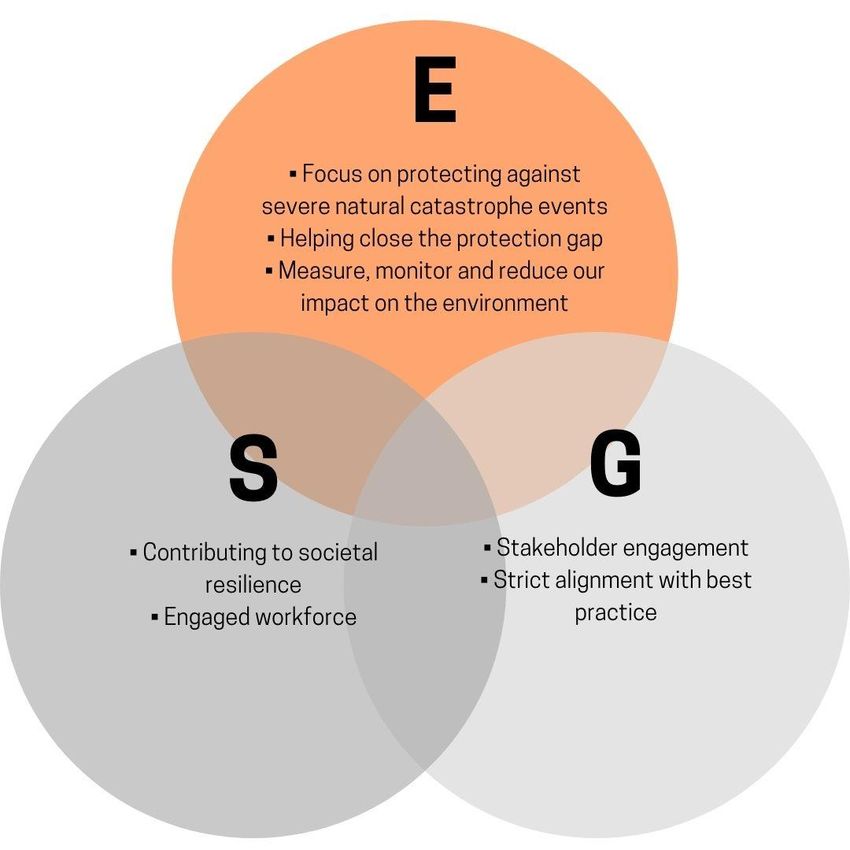
15 Lancashire AverageESG - a central part of our strategy since inception
Environmental & Social Environmental
• Societal resilience through the • Monitoring and management of
provision of insurance products catastrophe exposures
to aid recovery from natural • Low carbon emissions per employee
catastrophe and man-made • GHG emissions calculated annually and
events reported in the annual report and accounts
• Lancashire Foundation • Streamlined Energy & Carbon Reporting
(SECR)
Social Environmental & Governance
• Engaged workforce • Signatory to the UNEP FI
through staff surveys, Principles of Sustainable
D&I survey and a risk Insurance
culture survey • Adoption of the TCFD
• D&I working group framework
• Living Wage employer • Participation on industry
• Suppliers expected to climate change committees
comply with living wage and working groups
guidance
• Lancashire Foundation
• Graduate scheme Governance
• Compliance with the
requirements of the UK
Corporate Governance Code
Social & Governance • Ethical behavior with AML,
• Strong female representation Bribery, Financial Crime and
at the senior management Whistleblowing policies in
and board level place with annual training
16 providedFor more information:
Investor Relations Media Contacts
Jelena Bjelanovic FTI Consulting
Lancashire Holdings Limited 200 Aldersgate,
29th Floor, Aldersgate Street,
20 Fenchurch Street,
London, EC1A 4HD
London, EC3M 3BY
Telephone: +44 (0) 20 7264 4066 Email: Tom.Blackwell@fticonsulting.com
Fax: +44 (0) 20 7264 4077
Email: jelena.bjelanovic@lancashiregroup.com
Registered and Head Office, Bermuda London Office, UK
Lancashire Holdings Limited Lancashire Holdings Limited
Power House, 29th Floor,
7 Par-la-Ville Road, 20 Fenchurch Street,
Hamilton HM 11, London, EC3M 3BY
Bermuda Telephone: + 44 (0) 20 7264 4000
Telephone: + 1 (441) 278-8950 Fax: + 44 (0) 20 7264 4077
Fax: + 1 (441) 278-8951 Email: info@lancashiregroup.com
Email: info@lancashiregroup.com
17You can also read