Can Neutrophil-to-Lymphocyte or Platelet- to-Lymphocyte Ratio Be Used to Predict Postoperative Nausea and Vomiting in Breast Reduction? - Cureus
←
→
Page content transcription
If your browser does not render page correctly, please read the page content below
Open Access Original
                                         Article                                                DOI: 10.7759/cureus.7237

                                         Can Neutrophil-to-Lymphocyte or Platelet-
                                         to-Lymphocyte Ratio Be Used to Predict
                                         Postoperative Nausea and Vomiting in
                                         Breast Reduction?
                                         Onur Karaca 1 , Guvenc Dogan 2

                                         1. Anesthesiology and Reanimation, Aksaray University, Aksaray, TUR 2. Anesthesiology, Hitit
                                         University, Erol Olcok Training and Research Hospital, Corum, TUR

                                         Corresponding author: Onur Karaca, asalkaraca@gmail.com

                                         Abstract
                                         Background/Objective
                                         Postoperative nausea and vomiting (PONV) is one of the most frequently seen complications in
                                         the postoperative period. In several studies, the neutrophil-lymphocyte ratio (NLR) or the
                                         thrombocyte-lymphocyte ratio (PLR) has been suggested as a parameter to be used in the
                                         diagnosis of inflammatory diseases. However, the literature provides no information about this
                                         relationship for breast reduction. This study aims to investigate whether preoperative NLR
                                         or PLR was an indicator of PONV and identify its relationship with antiemetic use.

                                         Methods
                                         In this study, hemogram values and antiemetic amounts taken within 24 hours were obtained
                                         retrospectively by scanning the files of the patients received breast reduction diagnosis and
                                         operation. The confounder effect was controlled using the Propensity Score Matching analysis
                                         to distribute the case-control groups similarly. The Receiver Operating Characteristic (ROC)
                                         analysis was used to determine whether NLR and PLR could be a prognostic indicator for PONV
                                         prediction. Sensitivity and specificity values were calculated after the ROC analysis to
                                         determine the success of the cut-off points.

                                         Results
                                         The success of NLR and PLR in discriminating PONV was found to be statistically significant
                                         (cut-off: 1.97, area under the curve (AUC)=0.697, p=0.001, cut-off: 137.2, AUC=0.743; p
Introduction
Postoperative nausea and vomiting (PONV) is defined as gagging or nausea-vomiting within
the postoperative 24 hours [1-4].
The prevalence of nausea and vomiting changes according to the surgical cases performed
under general anesthesia and, generally, its incidence is reported to be between 30% and 80%
[2-4]. Nausea and vomiting are among the important problems that commonly occur in the
postoperative period and that decreases patient satisfaction [5]. Anesthesia medicine developed
in recent years decreases these effects significantly; in fact, some of the anesthesia medicine
given intravenously before extubation aims to prevent this problem [6].
Despite the developments in the management of nausea and vomiting and new antiemetic
medicine, postoperative nausea and vomiting remain to be an important problem for patients
[2,4]. Several risk factors play an important role in PONV development [7-8]. PONV-related
important risk factors include patient-related, anesthetic, and surgical factors. The most
important patient-related risk factor is being female; and the other factors include having a
history of nausea and vomiting in the postoperative period, not smoking, motion sickness
history, and young age. Anesthetic factors that play a role in PONV development include the
use of inhalation anesthesia (volatile), duration of anesthesia, use of postoperative opioids,
liquid anesthetics (isoflurane, desflurane, sevoflurane), and gas anesthetics (nitric oxide (N 2O),
nitrous oxide) [2,9]. The type of surgery is reported to be an important risk factor in PONV
development. PONV incidence is reported to be higher in some operation types (abdominal
surgeries) depending on long-time exposure to anesthesia and the use of high dose opioids
[2,10-11].
There are various factors related to the risk of nausea and vomiting, and inflammation increases
this risk. In several studies, the neutrophil-lymphocyte ratio (NLR) or the thrombocyte-
lymphocyte ratio (PLR) has been suggested as a parameter to be used in the diagnosis and
follow-up of the inflammatory diseases [12-15]. However, although this relationship has been
reported in only a limited number of studies for rhinoplasty in the literature, the literature
provides no information about this relationship for breast reduction operations. This study
aims to investigate whether preoperative NLR or PLR was an indicator of PONV and identify its
relationship with antiemetic use.
Materials And Methods
In this study, hemogram values and antiemetic amounts (metoclopramide) taken within 24
hours postoperatively were obtained retrospectively by scanning the files of the patients who
applied to the Plastic, Reconstructive and Aesthetic Surgery polyclinic and were scheduled for a
breast reduction operation. Patients aged between 18 and 65 years, who underwent elective
mammoplasty in the I-II risk group according to the American Society of Anesthesiologists
(ASA) were involved in the study. None of the patients received a preoperative blood
transfusion, and the patients had no history of gastrointestinal system disorders, uncontrolled
systemic diseases, or antiemetic and anticholinergic medicine use. Patients who were treated
with pre/perioperative steroids and antiemetics and who underwent intraoperative local
anesthesia were excluded from the study. All patients’ oral intake was restricted eight hours
before the operation. All the operations were performed by the same surgeon.
Electrocardiography, peripheral oxygen saturation, noninvasive blood pressure, end-tidal
carbon dioxide pressure, and body temperature monitoring were conducted in all patients. The
anesthesia induction of all patients was conducted with 2-3 mg kg-1 propofol, 0.6-0.8 mg kg-1
rocuronium bromide, and 1 µg kg-1 remifentanil. In the maintenance of anesthesia, 2%-2.5%
sevoflurane was given with a 50% air/O2 mixture, and 0.05-0.2 µg kg-1 min-1 remifentanil
2020 Karaca et al. Cureus 12(3): e7237. DOI 10.7759/cureus.7237 2 of 9infusion and rocuronium bromide as a muscle relaxant as needed were used. After the surgical
procedure, for postoperative analgesia, 1 g metamizole sodium was used and all patients in
whom sugammadex was used to reverse neuromuscular blockade, and the patients were
transferred to the post-anesthesia care unit (PACU) after extubation.
Ethics committee approval dated 2019 and numbered 115 was obtained from the Ethics
Committee of Hitit University, and the study followed the Declaration of Helsinki.
Sample size estimations (Priori power analysis) and power
analysis
The sample size was calculated using G-power (Version 3.1; (Heinrich-Heine-Universität
Düsseldorf, Düsseldorf, Germany)) package programming. The sample size was calculated for
the student's t-test, which was used for testing the main hypothesis of the present study. It was
found that 72 individuals, 36 in two different groups, needed to be involved in the study in
order to reveal the significant differences in the groups (NLR ≥ 2 and NLR < 2) using 80% power
(1-β=0.80), α=0.05 error (95% confidence interval), and 0.6 effect size with a one-sided
hypothesis.
Statistical analysis and control of confounding effect in study
design
As all the patients in the groups were female, gender did not have a confounding role. The
confounder effect was controlled using the Propensity Score Matching (PSM) analysis in order
to distribute the case-control groups similarly in terms of statistical comparisons. Prior to the
study, the confounder between the case-control groups was matched in terms of the
continuous variables, age, body mass index (BMI), smoking, and additional diseases. Propensity
scores were predicted using the combined estimator (ensemble learning: a combination of
logistic regression and machine learning algorithms) developed by Demir E (2019) [16]. A
matching analysis was performed using the Nearest Neighbor Matching method. The case-
control ratio was matched equally as 1:1 in the matching analysis. After the matching analysis
based on the propensity score, the control of the balance was evaluated using the overall chi-
square balance test [17]. Before the matching, there were 75 patients in the NLR < 2 group and
46 patients in the NLR ≥ 2 group. After the matching, analyses were performed with a total of
92 patients' data, with 46 patients distributed to two different groups equally according to
confounder variables. A matching analysis was performed in the R package with the "Matching"
library, and graphic drawings were done with the “ggplot 2” library [18].
The statistical analysis was performed using the SPSS (Version 22.0, SPSS Inc., Chicago, IL,
USA) package program. Descriptive statistics were reported as mean ± standard deviation (SD)
or median (minimum-maximum) according to data normality distribution for continuous
variables. Descriptive statistics of categorical data were presented as numbers and percentages.
The normality distribution of the data was evaluated by the Kolmogorov-Smirnov and Shapiro-
Wilk tests.
The patients that had NLR hemogram values below and above 2 based on the cut-off point
suggested in the literature were divided into two groups; antiemetic use averages and nausea
and vomiting ratios within 24 hours were compared statistically. Demographic characteristics
and antiemetic use comparisons of the independent two groups (NLR ≥ 2 and NLR < 2) were
performed using the student's t-test or nonparametric Mann Whitney U test according to data
distribution; PONV ratio comparisons were done using the chi-square test. In addition, whether
NLR and PLR could be a prognostic indicator for PONV was investigated using the receiver
operating characteristic (ROC) curve. The area under the ROC curve (AUC) was evaluated as 0.9-
2020 Karaca et al. Cureus 12(3): e7237. DOI 10.7759/cureus.7237 3 of 91: Excellent, 0.8-0.9: Good, 0.7-0.8: Fair, 0.6-0.7: Poor, and 0.5-0.6: Fail. After the ROC analysis,
the Youden index (maximum sensitivity and specificity) was used in order to identify the best
cut-off point. When it was significant, sensitivity, specificity, positive-negative predictive
values, and likelihood ratio (+) values were calculated using the cut-off points after the ROC
analysis in order to identify the distinguishing power of the indicator. The statistical
significance level was accepted as p < 0.05.
Results
All the patients in the study were female. After the matching, the groups were distributed
similarly in terms of age, BMI, surgery duration, ratios of smoking, and ASA (p=0.243, p=0.405,
p= 0.119, p=0.656, p=0.524, respectively; Table 1). Group 1 preoperative NLR average: 1.59±0.36
was significantly lower than Group 2 NLR average: 3.99±1.57 (p < 0.001).
n Age (years) BMI Duration of surgery Smoking (Yes/No) ASA (I/II) VAS
Group 1 (NLRPostoperative nausea-vomiting
n Antiemetic use in 24 h (mg) P-value P-value
No Only Nausea Vomiting
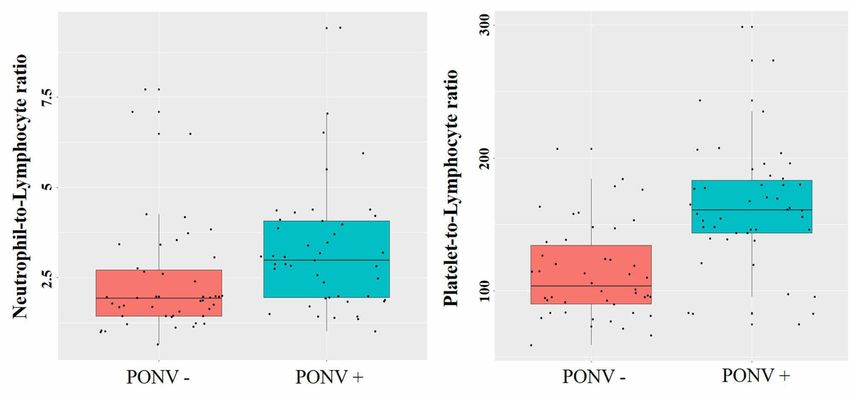
Group 1 (NLRFIGURE 2: Box plots of neutrophil-to-lymphocyte and platelet-
to-lymphocyte ratio according to the postoperative nausea and
vomiting groups
(a) Box plot of neutrophil-to-lymphocyte (b) platelet-to-lymphocyte ratio
NLR PLR
AUC (95 % CI) 0.697 (0.588-0.805) 0.743 (0.639-0.847)
P-values 0.001lymphocyte ratio, plateletcrit, and hyperemesis gravidarum (HG). The results of the study
showed that the platelet-to-lymphocyte ratio and plateletcrit were effective inflammatory
indicators in predicting HG presence, and they stated that thrombocyte levels could be used in
identifying HG severity [19].
Arpacı et al. (2017) investigated the relationship between NLR and PONV in patients who
underwent maxillofacial surgery and reported that PONV risk increased significantly in
patients with a higher NLR. By stating that NLR could easily be calculated with data obtained
from a full blood count and might be an indicator for PONV, they claimed that antiemetic
prophylaxis could be given after the evaluation of the NLR ratio [20].
In their study conducted with 80 patients, Altun et al. (2019) grouped the patients
retrospectively according to their NLR values below and above 2. They compared nausea
vomiting at recovery, antiemetic requirement at recovery, and at 24 h postoperatively between
the groups and reported statistically significant differences. The results showed that NLR
values over 2 calculated in the preoperative period could be an indicator of PONV risk, and they
claimed that antiemetic prophylaxis could be given according to this value [3]. The present
study indicates similar results; it was found that antiemetic use in 24 h and nausea/vomiting
ratios were significantly higher in the group with higher NLR values. However, in addition to
the study conducted by Altun et al., the present study also investigated a new cut-off point with
the ROC curve, and calculated sensitivity, specificity, PPV, and NPV values for the success of
NLR. The success of NLR in discriminating PONV for the 1.97 cut-off point was found to be
statistically significant. The cut-off point recommended as 2 for NLR in literature is in line with
the 1.97 cut-off point we obtained as a result of the ROC curve.
The superiority of the present study among the ones in literature is that it shows that PLR could
be used as a prognostic indicator in nausea/vomiting. A limited number of studies in the
literature has investigated NLR, but no studies have been found to have the success of the
PONV prediction of PLR. As for this study, a new cut-off point for PLR has been
investigated and the success of PLR in discriminating PONV for the 137.2 cut-off point was
found to be statistically significant. In addition, the sensitivity of PLR (77.8%) in discriminating
PONV for this cut-off point was found to be higher in comparison to NLR (73.3%). The
comparison of area values of NLR and PLR under the ROC curve showed that the success of PLR
in predicting PONV was higher than NLR. According to ROC AUCs, NLR predicted fair and PLT
predicted good PONV.
The limitation of the present study is that it was designed retrospectively as case-control.
However, a matching analysis based on propensity score has been widely used in the literature
recently. The analysis enables the similar distribution of the confounders, which decreases the
bias in retrospective studies. The success of particularly PLR in predicting PONV could be
investigated in new prospective studies to be designed.
Conclusions
In our study, we showed that NLR and PLR can be predictors of PONV estimation. Based on our
results, we have demonstrated that PLR is more sensitive and specific in predicting this
complication. We think that these hemogram parameters should be taken into account in order
to prevent this important and difficult to predict complication and to take necessary measures.
Additional Information
Disclosures
Human subjects: Consent was obtained by all participants in this study. Hitit University
2020 Karaca et al. Cureus 12(3): e7237. DOI 10.7759/cureus.7237 7 of 9Ethical Board issued approval 2019-115. Animal subjects: All authors have confirmed that this
study did not involve animal subjects or tissue. Conflicts of interest: In compliance with the
ICMJE uniform disclosure form, all authors declare the following: Payment/services info: All
authors have declared that no financial support was received from any organization for the
submitted work. Financial relationships: All authors have declared that they have no
financial relationships at present or within the previous three years with any organizations that
might have an interest in the submitted work. Other relationships: All authors have declared
that there are no other relationships or activities that could appear to have influenced the
submitted work.
References
1. Therneau IW, Martin EE, Sprung J, Kellogg TA, Schroeder, DR, Weingarten TN: The role of
aprepitant in prevention of postoperative nausea and vomiting after bariatric surgery.
Obesity. 2018, 29:37-43. 10.1007/s11695-019-03767-x
2. Aktaş YY, Gürçayır D, Atalay C: Evidence-based practices for the management of
postoperative nausea and vomiting [Article in Turkish]. Dicle Medical Journal. 2018, 45:341-
351. 10.5798/dicletip.457268
3. Altun AY, Demirel İ, Bolat E, Özcan S, Altun S, Aksu A, Beştaş A: The relationship between
the preoperative neutrophil-to-lymphocyte ratio and postoperative nausea and vomiting in
patients undergoing septorhinoplasty surgery. Aesthetic Plast Surg. 2019, 43:861-865.
10.1007/s00266-019-01325-5
4. McCracken G, Houston P, Lefebvre G: Guideline for the management of postoperative nausea
and vomiting. J Obstet Gynaecol Can. 2008, 209:600-607. 10.1016/s1701-2163(16)32895-x
5. Myles PS, Williams DL, Hendrata M, Anderson H, Weeks AM: Patient satisfaction after
anaesthesia and surgery: results of a prospective survey of 10811 patients. Br J Anaesth. 2000,
84:6-10. 10.1093/oxfordjournals.bja.a013383
6. Castro AL, Kendall MC: Acetaminophen to reduce postoperative nausea and vomiting in
patients undergoing strabismus surgery. Agri. 2019, 31:111. 10.5505/agri.2018.31644
7. Carlisle J, Stevenson CA: Drugs for preventing postoperative nausea and vomiting . Cochrane
Database Syst Rev. 2006, 3:004125. 10.1002/14651858.CD004125.pub2
8. Gan TJ, Diemunsch P, Habib AS, et al.: Consensus guidelines for the management of
postoperative nausea and vomiting. Anesth Analg. 2014, 118:85-113.
10.1213/ANE.0000000000000002
9. Apfel CC, Heidrich FM, Jukar-Rao S, et al.: Evidence-based analysis of risk factors for
postoperative nausea and vomiting. Br J Anaesth. 2012, 109:742-753. 10.1093/bja/aes276
10. Sharan AD, Riley J, Falowski S, et al.: Association of opioid usage with spinal cord stimulation
outcomes. Pain Med. 2017, 19:699-707. 10.1093/pm/pnx262
11. Dasgupta N, Funk MJ, Proescholdbell S, Hirsch A, Ribisl KM, Marshall S: Cohort study of the
impact of high-dose opioid analgesics on overdose mortality. Pain Med. 2016, 17:85-98.
10.1111/pme.12907
12. Turkmen K, Erdur FM, Ozcicek F, et al.: Platelet‐to‐lymphocyte ratio better predicts
inflammation than neutrophil‐to‐lymphocyte ratio in end‐stage renal disease patients.
Hemodialysis. 2013, 17:391-396. 10.1111/hdi.12040
13. Shimoyama Y, Umegaki O, Agui T, Kadono N, Minami T: Neutrophil to lymphocyte ratio and
platelet to lymphocyte ratio are superior to other inflammation-based prognostic scores in
predicting the mortality of patients with gastrointestinal perforation. JA Clin Rep. 2017, 3:49.
10.1186/s40981-017-0118-1
14. Zhang Y, Lu JJ, Du YP, Feng CX, Wang LQ, Chen MB: Prognostic value of neutrophil-to-
lymphocyte ratio and platelet-to-lymphocyte ratio in gastric cancer. Medicine. 2018,
97:e0144. 10.1097/MD.0000000000010144
15. Eryigit U, Cakmak VA, Sahin A, Tatli O, Pasli S, Gazioglu G, Karaca Y: The diagnostic value of
the neutrophil-lymphocyte ratio in distinguishing between subarachnoid hemorrhage and
migraine. Am J Emerg Med. 2017, 35:1276-1280. 10.1016/j.ajem.2017.03.063
16. Demir E: Development of New Propensity Score Estimation Models with Machine Learning
Algorithms for Optimal Matching Analysis in Non-Randomized Clinical Trials. 2019 (ed):
Ankara; 2019.
2020 Karaca et al. Cureus 12(3): e7237. DOI 10.7759/cureus.7237 8 of 917. RItools: randomization inference tools. (2010). http://www.jakebowers.org/RItools.html.
18. Sekhon JS: Multivariate and propensity score matching software with automated balance
optimization: the matching package for R. J Stat Softw. 2011, 42:1-52. 10.18637/jss.v042.i07
19. Tayfur C, Burcu DC, Gulten O, et al.: Association between platelet to lymphocyte ratio,
plateletcrit and the presence and severity of hyperemesis gravidarum. J Obstet Gynaecol Re.
2017, 43:498-504. 10.1111/jog.13228
20. Arpaci AH, Işik B, Ilhan E, Erdem E: Association of postoperative nausea and vomiting
incidence with neutrophil-lymphocyte ratio in ambulatory maxillofacial surgery. J Oral
Maxillofac Surg. 2017, 75:1367-1371. 10.1016/j.joms.2016.12.036
2020 Karaca et al. Cureus 12(3): e7237. DOI 10.7759/cureus.7237 9 of 9You can also read