INVESTOR PRESENTATION - Peter Hoetzinger, Co CEO & President May 2022
←
→
Page content transcription
If your browser does not render page correctly, please read the page content below
INVESTOR PRESENTATION
    Peter Hoetzinger, Co CEO & President
                              May 2022
Key Investment Highlights

§   Founded in 1992, Century Casinos is a multi-channel gaming
    company with focus on drive-to U.S. markets

§   Casinos located in attractive markets with limited new
    competition risk

§   Regional and local customer base. Majority of revenue
    comes from guests who live within a one-hour drive of our
    casinos

§   Century’s management team owns 13% of CNTY and has
    100+ years experience having operated 100+ casinos in 20+
    countries

§   Substantial growth drivers:

       ü Acquisition of Nugget Casino Resort in Reno, NV
       ü Caruthersville, MO, casino going land-based
       ü Hotel development at casino in Cape Girardeau, MO
       ü High cash flow conversion

                                                                 1
Multi-Channel North American Gaming Company

 Land-based Casinos (USA and Canada)

                                              Reno, Nevada
Use land-based casinos to get more online
customers. The online world and the land-
 based casino world co-exist successfully.

    Racinos and On/Off-Track Betting

Give online customers a better experience
and social excitement when they visit land-
         based casino properties

Sportsbook (Retail & Online) and iGaming

     The different experiences are
complementary and enhance each other.

                                                             2
Century’s Property Footprint
Diversified Local Gaming Footprint in Drive-to Markets

                                                         3
Overview of Century Properties

                      Century            Century           Mountaineer                                             2 Casinos and
                                                                                Century           Century                               8 Properties
                     Casino &           Casino &             Casino,                                                  2 Racing                               Nugget
Property                                                                      Casino Cape          Casino                                throughout
                    Hotel Central      Hotel Cripple       Racetrack &                                             Entertainment                          Casino Resort
                                                                               Girardeau        Caruthersville                             Poland
                        City              Creek              Resort                                                  Properties
                                                             New                 Cape                              Edmonton and
                    Central City,     Cripple Creek,                                            Caruthersville,
Location                                                  Cumberland,          Girardeau,                            Calgary,              Poland         Reno, Nevada
                     Colorado           Colorado                                                  Missouri
                                                          West Virginia         Missouri                             Canada
Acquisition                                                 December           December           December
                     July 2006           July 1996                                                                      Varies             Varies                Varies
Date                                                          2019               2019               2019

Ownership                                                                                                                                 66.6%            OpCo 100%
                       Owned              Owned              Leased              Leased             Leased             Owned3
Structure                                                                                                                                Ownership         PropCo 50%

Slots                    441                385               1,104               848                 526               2,461               526                   859

Tables                    8                  6                  35                 23                  9                  33                121                   29

VLTs                     —                   —                  —                  —                   —                  74                 —                    —

Hotel Rooms              26                  21                357                 —                   —                  26                 —                   1,382

2021
Revenue1,2               $25                $20                $115               $74                 $49                $81                $82                  $100
($mm)
2021 Adj.
EBITDA1,2                $8                  $9                $20                $35                 $24                $21                 $9                   $33
($mm)

        Total Pro Forma Revenue and Adjusted EBITDA for FY2021 is $489mm and $131mm, respectively

1. Represents 2019 Revenue and Adjusted EBITDA for Canada and Poland. 2. Includes Century Casino Calgary. The Casino operations were sold on December 1,
2020 and the related land and building were sold on February 10, 2022. 3. Racetrack land is leased and Century Downs is 75% owned. Note: Stats as of March 31,          4
2022. Adjusted EBITDA is a non-GAAP financial measure. See Appendix for the definition and reconciliation of Adjusted EBITDA.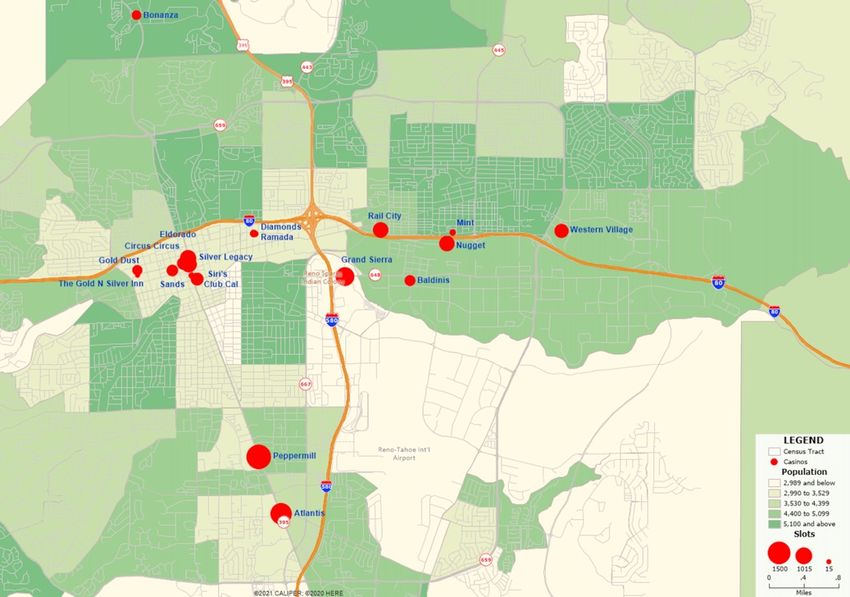
Diversified Gaming Company with Focus on Local and
Regional U.S. Markets

                                                                                         Pending acquisition in        Pro Forma
                                                                                         Reno/Sparks, Nevada

        # of Properties                               17 Properties                               1 Property                18 Properties

      # of Slot Machines                                    6,282                                     859                          7,141

       # of Table Games                                      233                                       29                           262

       # of Hotel Rooms                                      430                                     1,382                         1,812

                                                         Canada                                                                  Canada
                                                           9%                                                                      7%
                                                Poland                                                                  Poland
                                                 2%                                                                      2%

  Pro Forma Geographic
 Concentration of Property
  Adjusted 2021 EBITDA1
                                                                        United                                United                       United
                                                                        States                                States                       States
                                                                         89%                                  100%                          91%

Property information and Adjusted EBITDA excludes Corporate and Other segment.
1. Adjusted EBITDA is a non-GAAP measure. See Appendix for the definition and reconciliation of Adjusted EBITDA.                                    5
Diverse Regional Exposure in Stable, Mature Gaming
Markets in the U.S.

§ Exposure to attractive regional markets proven to be                                               Colorado GGR
   resilient throughout the pandemic
        – 2021 GGR levels materially up versus 2019                               $811     $828        $842    $834              $976
           across all markets served in the U.S.                                                                        $560

        – Sustainable future growth underpinned by strong
           market fundamentals and structural regulatory                          20 16    20 17       20 18   20 19    20 20    20 21
           changes
                                                                                                     Missouri GGR
§ Colorado well-positioned for long-term growth                                                       $1.754                     $1.897
                                                                                  $1.715   $1.738              $1.730
      – Introduction of sports betting in 2020                                                                          $1.264

      – Removal of $100 betting limits and approval of
           new casino games in November 2020
        – Denver and Colorado Springs MSAs driven by                              20 16    20 17       20 18   20 19    20 20    20 21
           attractive demographic trends that outpace U.S.
           averages                                                                                 West Virginia GGR
§ Missouri benefits from loyal hyperlocal customer base                           $639                 $613    $618              $644
                                                                                           $587
      – Track record of stability with strong growth in                                                                 $431
           2021
§ Reno-Sparks well positioned for future growth                                   20 16    20 17       20 18   20 19    20 20    20 21
     – Proximity to outdoor recreational attractions
           aligns well with post-pandemic trends                                           Washoe County, Nevada GGR
        – Blue chip employers such as Tesla and Google
           driving attractive socioeconomic trends                                $810     $829        $866    $857              $1.016
                                                                                                                        $676

                                                                                  20 16    20 17       20 18   20 19    20 20    20 21

1. Implemented in May 2021
Source: UNLV Gaming Research, Nevada Gaming Control Board | Note: $ in millions                                                      6
Stable Historical Performance of Regional GGR in the U.S.

                Stable growth since 2001 and resilient to macroeconomic changes including oil prices and CPI

                                                                       U.S. Regional GGR ($bn)
$50.0
                                                                                                                                                                               $ 47
                                                                                                                                                               $ 39    $ 40
                                                                                                                                               $ 35    $ 37
$40.0

                                                                                                                     $ 32     $ 34     $ 34
                                                         $ 31   $ 30           $ 29       $ 30     $ 31     $ 31
                                           $ 27   $ 29                 $ 29
$30.0

                 $ 24     $ 24     $ 26
        $ 22
$20.0

$10.0

 $0.0

        2001     2002     2003     2004   2005    2006   2007   2008   2009    2010   2011       2012       2013     2014     2015     2016    2017    2018    2019    2020    2021
                                                                WTI Crude Oil Price (US$ / Barrel)
$ 150

$ 120

 $ 90

 $ 60

 $ 30

  $0
 2000          2001     2002     2003   2004   2005   2006   2007   2008    2009   2010     2011     2012     2013     2014     2015    2016    2017    2018    2019    2020    2021
                                                                           CPI Index YoY % Change
 8.0 %
 8.0 %

 6.0 %
 6.0 %

 4.0
 4.0 %
     %

 2.0
 2.0 %
     %

 0.0
 0.0 %
     %

(2.0)%
(2.0)%
  20002001
         20012002
                20022003
                       20032004
                              20042005
                                     20052006
                                           20062007
                                                 2007 2008
                                                        2008 2009
                                                               2009 2010
                                                                      2010 2011
                                                                             2011 2012
                                                                                    2012 2013
                                                                                           2013 2014
                                                                                                  2014 2015
                                                                                                         2015 2016
                                                                                                                2016 2017
                                                                                                                       2017 2018
                                                                                                                              2018 2019
                                                                                                                                    2019 2020
                                                                                                                                          2020 2021
                                                                                                                                                2021

 Source: UNLV Gaming Research and Bloomberg. Note: Regional GGR represents U.S. excluding Las Vegas GGR.                                                                         7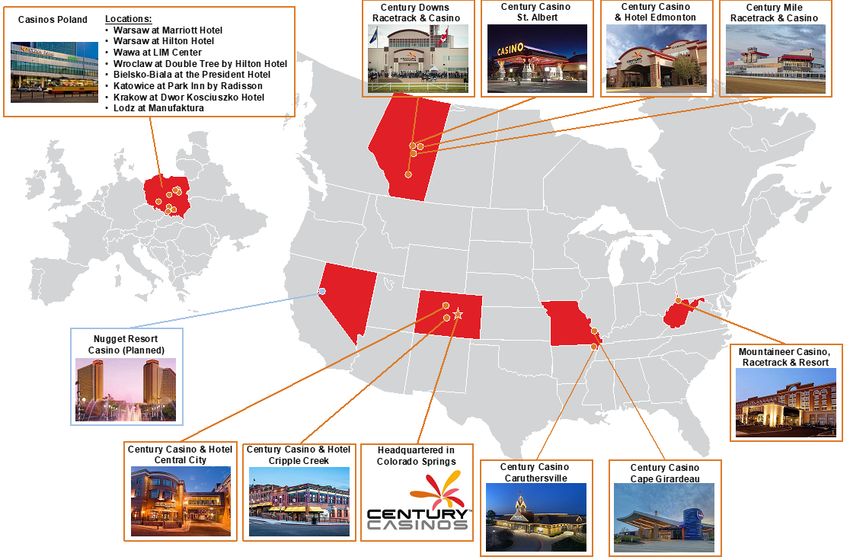
U.S.
OPERATIONS
 OVERVIEW
Colorado Region Market Overview and Asset Summary
Central City and Cripple Creek

Asset                                                   Property Highlights                                        Key Stats1
                                    § Central City is located just 45 minutes west of Denver,        Casino Sq. Footage           22,640
                                       Colorado
                                    § Easily accessible from highway I-70                            Slot Machines                 441
                                    § Voted Denver’s Best Casino since 2012                          Tables                         8
                                    § Online sports betting through Tipico Sportsbook
                                       partnership                                                   Hotel Rooms                    26

                                    § Cripple Creek is located ~45 miles from Colorado Springs       Casino Sq. Footage           19,610
                                    § State-of-the art slot machines, exciting table games
                                                                                                     Slot Machines                 385
                                    § Spacious and comfortable hotel rooms have been voted
                                       Best Casino Hotel in Cripple Creek
                                                                                                     Tables                         6
                                    § Online sports betting through Circa Sports and Bet365
                                       partnerships                                                  Hotel Rooms                    21

                        Competitive Landscape                                            Market Demographics and Stability
                                                                            § Central City and Cripple Creek serve the Denver and
                                                                               Colorado Springs MSAs, respectively, both of which are
                                                                               exhibiting strong geographic and economic trends
                                                                            § Both markets include local and tourist visitorship
                                                                            § Historically strong GGR trends with strong upside due to
                                                                               recent regulatory actions to remove betting limits and
                                                                               legalize online sports betting
                                                                            § The state benefits from positive demographic trends, with
                                                                               population growth outpacing the U.S. average by ~60 bps
                                                                               and a median household income of $72.3k vs a US average
                                                                               of $62.8k as of December 2021

Source: U.S. Census Bureau | 1. As of March 31, 2022.                                                                                    9
Colorado Region Results
Central City and Cripple Creek
Net Operating Revenue
14 ,0
12,1 12,4
12 ,0 11,3
10,3 10,4
9,4 9,5
10 ,0
8,0 6,7
6,0
4,0
2,0
2,0
0,0
Q1 Q2 Q3 Q4
20 20 20 21 20 22
Adjusted EBITDA
6,0
4,8 4,8 5,0
5,0
3,9
4,0 3,4
3,1 3,3
3,0
2,0
0,8
1,0 0,3
0,0
Q1 Q2 Q3 Q4
20 20 20 21 20 22
10Missouri Region Market Overview and Asset Summary
Cape Girardeau and Caruthersville
Asset Property Highlights Key Stats1
§ Cape Girardeau is situated in downtown Cape Girardeau Casino Sq. Footage 41,530
§ The property opened in October 2012 with the 13th and final
gaming license in Missouri Slot Machines 848
§ Property includes an entertainment center, and a ~7,700
square ft. event center with seating for up to 600 Tables 23
§ Plans in place to build a hotel adjacent to and connected
with casino Hotel Rooms N/A
§ Caruthersville is an iconic riverboat casino that makes its Casino Sq. Footage 21,000
home on the banks of the Mississippi River
§ RV Park open year-round and located by the water Slot Machines 526
§ Banquet space for private parties and larger corporate
group events as well as a pavilion Tables 9
§ Plans to in place to move casino to non-floating facility
and build a hotel Hotel Rooms N/A
Competitive Landscape Market Demographics and Stability
§ Cape Girardeau and Caruthersville are hyperlocal, drive-to
markets with loyal customer bases
§ Missouri is one of the largest regional gaming markets with
~$1.9bn of gaming revenue in 2021
§ GGR growth since 2019 for the Out-of-State market in
Missouri was 22% with the broader Missouri market growingMissouri Region Results
Cape Girardeau and Caruthersville
Net Operating Revenue
40 ,0
34,1
35 ,0 31,0
28,7 29,7 28,3
30 ,0
23,9 24,5
25 ,0 21,6
20 ,0
15 ,0
9,6
10 ,0
5,0
0,0
Q1 Q2 Q3 Q4
20 20 20 21 20 22
Adjusted EBITDA
20 ,0
18 ,0 17,2
15,4
16 ,0
12,8 13,4 12,8
14 ,0
12 ,0 10,4
9,7
10 ,0
8,0 6,1
6,0
4,0 2,3
2,0
0,0
Q1 Q2 Q3 Q4
20 20 20 21 20 22
12West Virginia Region Market Overview and Asset Summary
Mountaineer Casino
Asset Property Highlights Key Stats1
§ Mountaineer Casino is the area’s only full-service resort Casino Sq. Footage 72,380
and casino featuring world-class thoroughbred racing, an
18-hole golf course and 5,000-seat convention center
§ Located on the beautiful Ohio River in the northern Slot Machines 1,104
panhandle of West Virginia
§ Located on Route 2, near Chester WV, and is an easy drive
from many locations in Ohio, Pennsylvania, and West Tables 35
Virginia
§ Sports betting available through William Hill Caesars
Sportsbook partnership Hotel Rooms 357
Competitive Landscape Market Demographics and Stability
§ Mountaineer serves the Pittsburgh and eastern Ohio drive-
to markets, providing multiple revenue streams including
gaming, sports betting, lodging, entertainment, food and
beverage
§ West Virginia was an early adopter of internet gaming (fifth
state in the U.S.) which has drawn customers from
neighboring states
§ There are a maximum of 5 gaming licenses available in the
state with no additional licenses allowed2
§ The gaming market in West Virginia has expanded
substantially, with 40% GGR growth from 2019 to 2021
Source: U.S. BLS, UNLV Gaming Research, American Gaming Association “State of the States 2021” | 1. As of March 31, 2022. 2. Assumes no additional racetracks 13
open in the state.West Virginia Region Results
Mountaineer Casino
Net Operating Revenue
35 ,0 31,7
30,6
28,4 28,7
30 ,0 26,3
25,1 23,9 24,5
25 ,0
20 ,0
15 ,0 12,2
10 ,0
5,0
0,0
Q1 Q2 Q3 Q4
20 20 20 21 20 22
Adjusted EBITDA
7,0 6,2 5,9
6,0
4,8 4,5
5,0 4,3
4,0 3,6 3,3
3,0
1,8
2,0
1,0
0,0
-1,0 -0,5
Q1 Q2 Q3 Q4
20 20 20 21 20 22
14THE NUGGET CASINO RESORT, NV (PENDING ACQUISITION)
Transaction Overview

§ On February 23, 2022, Century announced a definitive agreement with
   Marnell Gaming, LLC to acquire 100% of Nugget OpCo and 50% of
   Nugget PropCo for a total of $195mm
        – Represents a blended purchase price multiple of ~7.8x LTM
            12/31/2021 Adj. EBITDA and is expected to close within 12 months
            pending receipt of regulatory approvals
        – Viewed separately, the acquisition of 50% of the PropCo represents
            a cap rate of 7.9% and the purchase of 100% of the OpCo is done
            at a multiple of 5.6x Adj. EBITDA
§ On April 1, 2022, Century closed on the PropCo acquisition and will now
   receive $7.5mm in annual rent (which is 50% of total rent payments)
§ Century also has a 5-year option to acquire the remaining 50% of PropCo
   for $105mm (plus 2% per annum)
§ For the LTM period ended 12/31/21, the Nugget generated revenue of
   $100mm and Adj. EBITDA of $33mm
§ We see upside to these numbers, mainly for three reasons:
     – during the first half of 2021, there were no conventions or concerts,
            which normally are a very profitable part of the Nugget’s business
        – we anticipate creating synergy effects when integrating the Nugget
            into our portfolio of North American operations
        – we already have identified various opportunities to improve the
            operations, mainly on the slot floor – the most profitable area of all

Note: Adjusted EBITDA is a non-GAAP financial measure. See Appendix for the definition and reconciliation of Adjusted EBITDA.   16
Nugget Casino Resort Property Overview
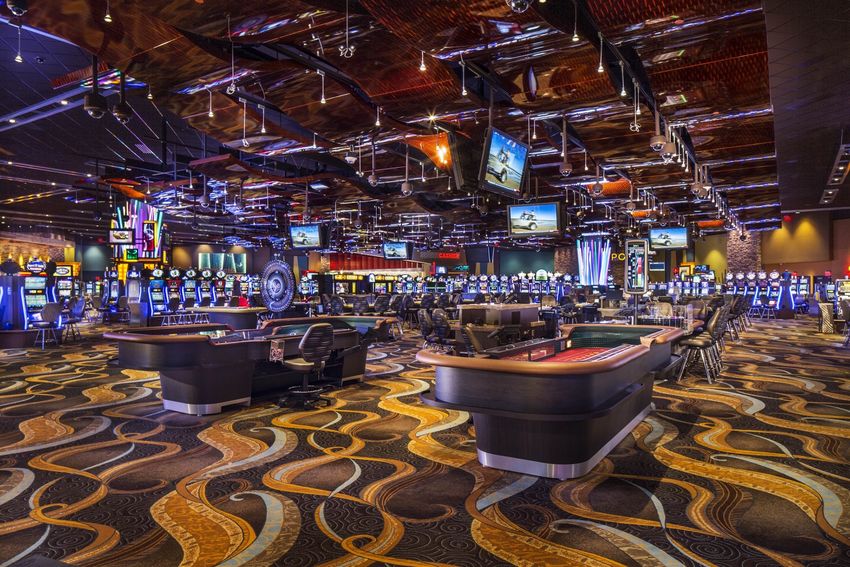
Key Highlights Property Stats
§ The newly remodeled Nugget Casino is conveniently Owned Land Acreage Casino Sq. Ft.
located on route I-80 with easy access from the airport
§ The full-service resort boasts a large gaming floor, two 29 50,200
hotel towers, a convention space, outdoor amphitheater,
and a wide variety of casual and fine dining options in Recent Renovation Slots
addition to several on-site bars and lounges
§ Reno/Sparks is a top 15 gaming market in the U.S. $90+mm 859
§ The Nugget has the 2nd largest convention center of any
hotel casino resort in Reno in addition to a state-of-the-art Full-time Equivalent Table Games
8,555-seat outdoor venue recently built Employees
§ The Reno-Tahoe airport is undergoing a $1.6bn master
expansion plan with recent non-stop service to JFK, 576 29
Houston and Austin
Rooms Restaurants
1,382 7
Convention Space Sq. Ft. Amphitheater Seats
110,000 8,555
2021 Revenue 2021 Adj. EBITDA (Margin)
$100mm $33mm (33%)
Source: American Gaming Association “State of the States 2021” 17Reno-Sparks, NV
Competitive Landscape
18Top 10 Reasons Why We Love the Nugget
1 EXISTING OPERATION 2 GREAT LOCATION ON I-80
Long operating history Unparalleled exposure to
No development risk, no construction delays 260,000 cars daily at nearby intersection
3 CONVENTION FACILITY 4 CAPITAL IMPROVEMENTS
2nd largest facility of any Reno casino Seller invested over $90mm in last five years
Sufficient number of rooms No major capex necessary
5 AMPHITHEATER 6 GROWTH OPPORTUNITIES
Brand new 8,555 seat amphitheater Growth opportunity to upgrade and
Excellent marketing opportunity increase gaming floor
7 PLAYER DATABASE 8 SYNERGY EFFECTS
Database of 80,000 active players Integrate stand-alone property into
Improve digital marketing portfolio of casinos
9 TRANSITION 10 MANAGEMENT TEAM
Great transition support from seller Excellent existing management team
19Reno-Sparks Developments Driving Significant Untapped
Potential in the Current Market
Area Highlights Reno-Sparks Average Per Room Per Day Statistics
§ Reno, known as the “Biggest Little City in the World” is
famous for its casinos, but is also known as a
$215 $222
destination for outdoor recreation with proximity to Lake
$196
Tahoe and several ski resorts
§ In 2021, 53% of revenue was generated through
casinos, 20% through food and beverage, 18% through $108 $113
$96
hotels, and the remaining 9% from miscellaneous income $87
$75 $81
$55
§ Current home to Tesla Gigafactory, Apple, Switch Data $35
$45
Center and Walmart Distribution
§ Population approaching 500,000 (15% growth from 2010 Slo t Revenu e Room Rate Food Sa les Be ve rage Sa les
to 2020 vs. national average of 7%) 20 18 20 19 20 20
Considerable Development Opportunities in the Area
Tesla Gigafactory presents an opportunity Google purchased 1,200+ acres in 2017, Blockchains LLC purchased 64,000 acres
to employee 20,000+ workers in the creating the capacity to hire tens of in 2018, with plans to build a blockchain-
Reno-Sparks area thousands of employees based community
Source: Nevada Gaming Control Board, UNLV Gaming Research, Reno.gov, Industry Research 20Continued Growth of Reno-Sparks Economy
Reno-Sparks Unemployment Rate
25.0 %
20.0 %
15.0 %
10.0 %
5.0 %
2.9 %
0.0 %
2016 2017 2018 2019 2020 2021
Washoe County Population Forecast Washoe County Personal Income Per Capita
: 3.94%
CAGR
G R : 1.04% ’21-’26 $ 87,751
’21-’26 C A $ 84,352
559,373 $ 81,082
554,134 $ 78,048
548,709 $ 75,105
543,087 $ 72,327
537,270
531,204
2021 2022 2023 2024 2025 2026 2021 2022 2023 2024 2025 2026
Source: Reno.gov, U.S. Bureau of Labor Statistics, MVE Reno-Sparks Market Overview, Washoe County Consensus Forecast, Industry Research 21FURTHER GROWTH DRIVERS
Century is Well-Positioned for the Next Stage of Growth

                  Century’s operating expertise has provided opportunities to make small yet
                               meaningful changes that have long-term impact
                            Recently Completed or in-Process Organic Growth Projects

§ Partnerships with established iGaming and sports betting operators including Rush Street and William Hill Caesars Sportsbook
       – Contracts include a minimum guaranteed amount and a revenue share above a set level
       – bet365 will go live in Colorado in second half of 2022
§ Introduction of player loyalty app and web portal across all U.S. properties
§ In West Virginia, multi-year slot floor upgrade to include adding electronic table games, investing in 200 new slot machines,
  modernization of the casino floor as well as updating hotel amenities, exterior and food venues

       – Already completed renovations include improvements to Mountaineer’s slot floor, notably a new VIP area, upgrades to
         center bar and updating floor layout, upgrades to the sports betting area and relocation of smoking casino section

                                                 Key Partnerships and Vendors

                                                                                                                              23
Century is Well-Positioned for the Next Stage of Growth
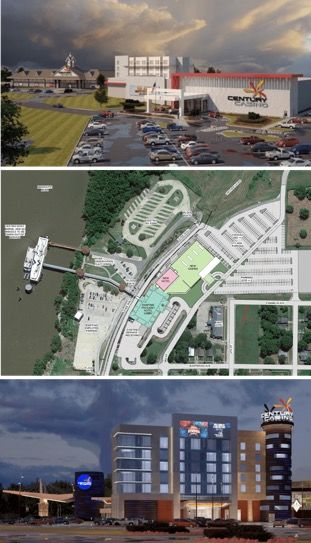
Missouri Projects
Caruthersville
§ Century purchased the neighboring two-story hotel and plans
extensive renovations Caruthersville
Non-Floating
– The new Century hotel will be the only hotel in Facility
downtown Caruthersville Rendering
§ Caruthersville is currently the only floating casino in Missouri
and has the opportunity to move to a non-floating facility
– Operational efficiencies
– 20% increase in gaming positions
– Increase catchment area
§ New project (including 75 hotel rooms in total) scheduled to Caruthersville
Site Plan
open to the public in early 2024 and expected to cost $47mm
Cape Girardeau
§ Century has announced plans to build a 70-room hotel at Cape
Girardeau
§ Located in the heart of downtown Cape Girardeau, the hotel will
be connected to the existing Century casino
§ Project will transform the property to a full resort, multi-day Cape
destination with gaming, various bars and dining venues, as Girardeau
well as conference, concert and event spaces Hotel
Rendering
§ The new project is scheduled to open to the public in late 2023
and is expected to cost $26mm
24KEY FINANCIALS
CNTY Consolidated Results
2018 – 2022 Quarterly

                                                      Net Operating Revenue
140,0
                                                                                              116,6
120,0                                                                                                                    107,3
                                103,1
100,0                                                        92,2                        95,7
                    87,7                                                                                            84,8
 80,0                      72,4                                                                              67,2
 60,0                                          52,4                               52,9
        40,6 45,6                       39,6          36,1
                                                                           43,6                       45,1
 40,0
 20,0
  0,0
                    Q1                                Q2                                 Q3                         Q4
                                               2018          2019   2020   2021      2022

                                                            Adjusted EBITDA
35,0                                                                                          33,1
30,0
                                23,8                        25,2                                                           24,9
25,0                                                                                 22,2
20,0                                                                                                                18,3
                         14,7
15,0
                  9,6                                                                                        9,8
10,0    6,6 6,7                                6,7                         6,4 7,1                    5,8
                                        4,7
 5,0
 0,0
-5,0                                                 -1,8
                  Q1                                  Q2                                 Q3                         Q4
                                               2018          2019   2020   2021      2022

                                                                                                                                  26
Summary of Pro Forma Historical Financial Performance
in millions
Key Highlights Revenue
§ Stable revenue growth across Century and the Nugget with $489,1
strong recovery post-COVID
$100,4
$361,2
§ Consistent Adj. EBITDA growth combined with margin $307,3
expansion $56,9
$254,4
$234,8
$89,1
$85,5
$80,7 $388,7
$304,3
$218,2
$154,1 $168,9
20 17 20 18 20 19 20 20 20 21
Adj. EBITDA and Margin Adj. EBITDA less Cash Rent on Master Lease
Margin:
17.1 % 16.1 % 15.4 % 16.4 % 26.7 %
$98,2
$130,8
Significant disruption at Nugget Casino
$25,5
from ~$90m in capex spend since 2016 $32,9
$59,2
$47,7 $32,8 $33,8 $35,5 $35,1
$40,3 $41,3 $10,8 $72,7
$97,9 $9,0
$17,4 $6,7 $10,4 $11,7
$14,2 $17,9
$48,4 $26,1 $26,5
$26,1 $23,4 $30,3 $23,4 $23,4
20 17 20 18 20 19 20 20 20 21 20 17 20 18 20 19 20 20 20 21
Century Nugget
27Broad Geographic and Asset Diversification
No single property accounts for more than 25% of Property Adj. EBITDA
§ Acquisition of the Nugget significantly increases Century’s scale
§ 25% increase in revenue
§ 33% increase in Adj. EBITDA
§ Further diversifies earnings on geographic and property-level basis (7 markets across North America and
Poland)
Current Pro Forma
2021 Adj. EBITDA1: $98mm 2021 Adj. EBITDA1: $131mm
4% 2% 3%2%
Cape Girardeau 5% 4%
Caruthersville 5% 25 %
By Property
7%
Nugget 32 %
7%
Mountaineer
Cripple Creek 9%
Central City
3%2% 14 %
Calgary 4% 25 %
5%
Edmonton 7%
17 %
Poland
19 % 14 %
22 % 17 % 23 %
23 %
1. Graphs and percent of total exclude Corporate and Other Adj. EBITDA. Canada is not presented by property. 28
Note: Adjusted EBITDA is a non-GAAP financial measure. See Appendix for the definition and reconciliation of Adjusted EBITDA.THANK YOU!
You can also read