INVESTOR PRESENTATION - Plaza Reit
←
→
Page content transcription
If your browser does not render page correctly, please read the page content below
INVESTOR
PRESENTATION

               2020
Who is Plaza?
Profile

             Existing Portfolio                                         Under Development                Pipeline

                274 properties                                                      17 projects          10 projects

                ~ 8.4M sq. ft.                                                   ~ 650,000 sq. ft.(1)   ~ 400,000 sq. ft.(1)

(1) at 100%. Certain projects under development are included in the existing portfolio
What makes PLAZA unique?

      Plaza focuses on per unit growth and NAV creation through accretive developments,
  1   redevelopments and proactive management of its existing portfolio.

      Plaza is fully internalized and able to develop/redevelop properties using in-house
      resources, such as a development and leasing team consisting of 25 skilled
  2   professionals with a combined 300 years of experience. Plaza does not buy
      properties from 3rd party developers or from related parties at low cap rates.

  3   Insiders hold a significant ownership position in Plaza.

  4   Plaza relies on its entrepreneurial abilities to adapt to changing market conditions.

      Plaza locks in consistent long-term returns by financing with long term debt, generally
  5   matched to lease maturities.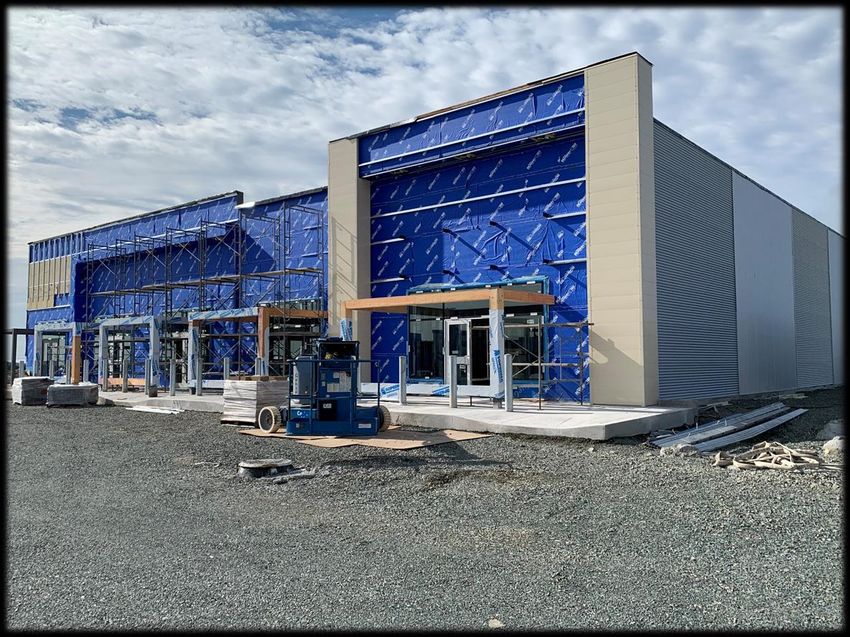
INVESMENT
HIGHLIGHTS

             2020
Investment Highlights
                        • One of Canada’s leading property owners,
                         developers and managers of retail real estate.

                        • Total assets, at Plaza’s consolidated interest, valued of
                          over $1.1 billion. Assets under management of +/- 1.65
                          Billion (all at 100%).

                        • Proven track record of accretive growth and value
                          creation over 20-year history.

                        • Development strategy and focus on per-unit NAV
                          and FFO growth. We have a strong history of
                          delivering value.

                        • Outstanding performance by targeting greenfield
                          and brownfield opportunities often overlooked by
                          competitors. As a result, we create access to
                          communities which are highly appealing to national
                          retailers.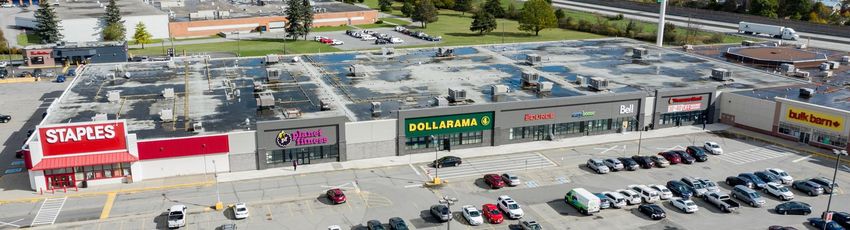
Investment Highlights

• Unique positioning as a developer and value
  creation REIT.

• Leveraging competitive advantage in Eastern
  Canada.

• Focus on value, convenience and specialty retail.

• Stable, high occupancy with National tenants
  comprising ~91% of revenue.

• Superior returns through property development.
Investment Highlights
Hypothetical Development
$000s

    Cost of Development          $50,000      $50,000    $50,000

       Unlevered Yield            7.00%       8.00%       9.00%

 Cap Rate upon completion         6.00%       6.50%       7.00%

    Cost of Development          $50,000      $50,000    $50,000

 Long term debt @ 65% LTV        ($37,917)   ($40,000)   ($41,786)

      Equity Investment          $12,083     $10,000     $8,214

   NOI upon completion            $3,500      $4,000      $4,500

Debt Service @ 3.75% interest,   ($2,100)    ($2,215)    ($2314)
         30-yr amort

         Cash Flow               $1,400       $1,785     $2,186

       Levered Return             11.6%       17.8%       26.6%

            Value                $58,333      $61,538    $64,286

        NAV Created              ($8,333)    ($11,538)   ($14,286)

  NAV Created - % of Cost          17%         23%         29%
Long-Term Mortgage Maturity Profile
       250,000,000                                                                               8.00%

                                                                                         52.2%   7.00%
       200,000,000
                                                                                                 6.00%

       150,000,000                                          4.98%
                                4.77%                                                            5.00%
                     4.62%
                                                                         4.34%
                                                4.08%
                                                                                                 4.00%
       100,000,000
                                                                                 3.99%
                     16.0%                                                                       3.00%
        50,000,000                              9.7%                     8.7%
                                 7.2%                        6.2%                                2.00%

                0                                                                                1.00%
                     2020        2021           2022         2023        2024        2025 and
                                                                                    thereafter
                       $ Maturing (left axis)           Weighted avg rate (right axis)
NOI by Region
2019

                                          60%
                2%               18%      Atlantic
                                          Canada
                West             Québec

                       20%
                       Ontario
PORTFOLIO
COMPOSITION
2020PLAZA’s Portfolio Composition
as at Dec. 31, 2019
Regional
Enclosed 3.9% Non-Retail
1.7%
7.1% Local
Single Tenant QSR 3.7%
6.9%
Single Tenant
Retail Strip
19.1 % 66.9% National
90.7%
National
90.7%
Base RentPLAZA’s Portfolio Composition
Revenue by Retail Category
Fashion,
Specialty Retail, 6%
Grocery/Liquor/ 13% Financial & other
Gas, 9% services,
6%
Pet Stores, 3%
Dollar Store & Treasure Hunt Other,
11% 4%
Restaurants & Entertainment, Pharmacy & Medical
Services,
18%
30%
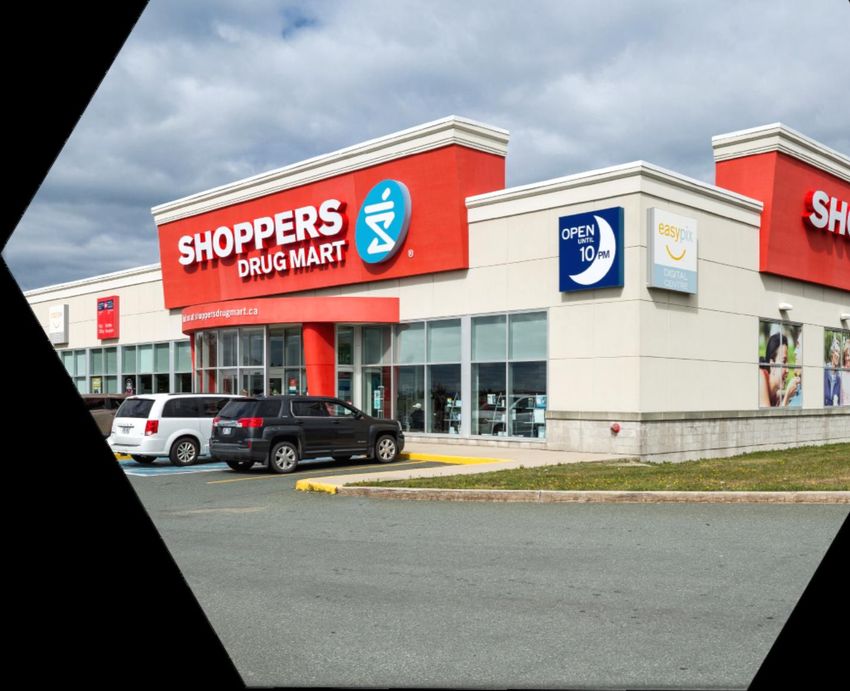
as at December 31, 2019Top 10 Retail Tenants
% of Base Rent Revenue(5)
25.1%
(1)
5.5%
(2)
5.1%
3.9%
(3)
3.5% (4)
3.3%
3.0%
1.8%
1.6%
1.5%
(1) Shoppers Drug Mart/Loblaw represents the following stores: Shoppers Drug Mart, No Frills, and Maxi.
(2) The majority is represented by 3 operators.
(3) Canadian Tire Group represents the following stores: Canadian Tire, Mark’s/L’Équipeur, Party City and Sport Chek.
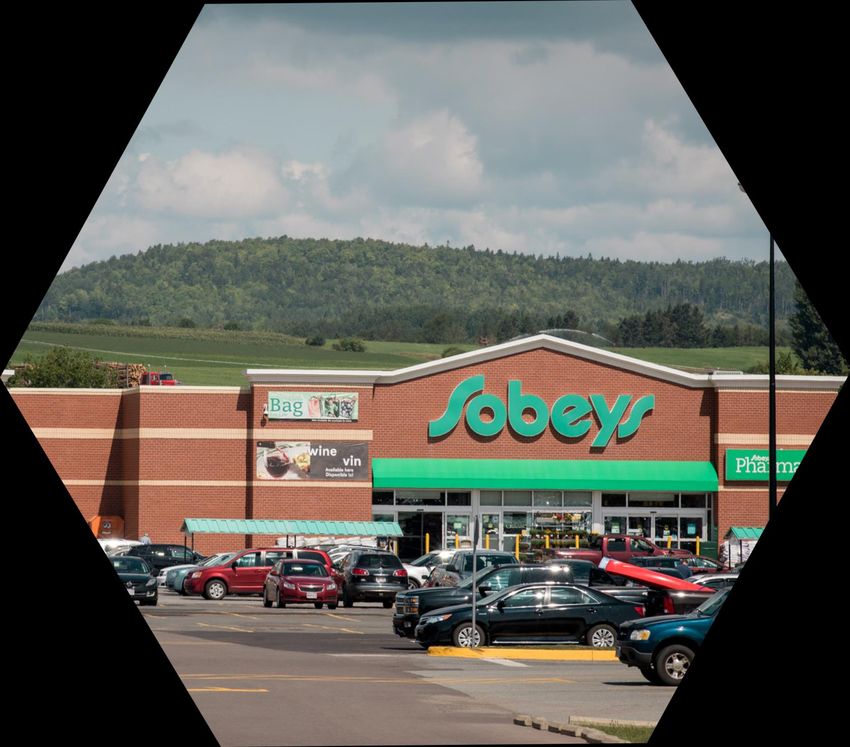
(4) Sobeys Group represents the following stores: Sobeys, IGA, Sobeys Fast Fuel and Lawtons.
(5) Excludes developments, redevelopments and non-consolidated investments.PLAZA Geography
West 3 Properties – 51,256 SF
Ontario 68 Properties – 1,690,869 SF
Québec 95 Properties – 2,146,617 SF
National
Atlantic 108 Properties – 4,495,022 SF 90.5%
TOTAL 274 Properties – 8,383,764 SF
areas noted at 100%REDEVELOPMENT
PROJECTS
2020Chain Lake Drive Plaza
Halifax, NS
BEFORE
REVELOPMENTGranite Drive Plaza New Minas, NS BEFORE REDEVELOPMENT
Quispamsis Town Centre
Quispamsis (Saint John), NB

  BEFORE                      FACADE REMODEL

                                               National
                                                90.5%
602 ave. Laure
Sept-Îles, QC
BEFORE FUTURE SQDC
Renderingboul. Talbot
Chicoutimi, QC
BEFORE
REDEVELOPMENT
RenderingPlaza J.P. Perrault
Sherbrooke, QC
BEFORE
REDEVELOPMENT
RenderingGates of Glen Shopping Centre
Brampton, ON
BEFORE
RenderingGates of Glen Shopping Centre Brampton, ON REDEVELOPMENT IN PROGRESS
Timiskaming Plaza
New Liskeard, ON
BEFORE
REDEVELOPMENT
IN PROGRESS
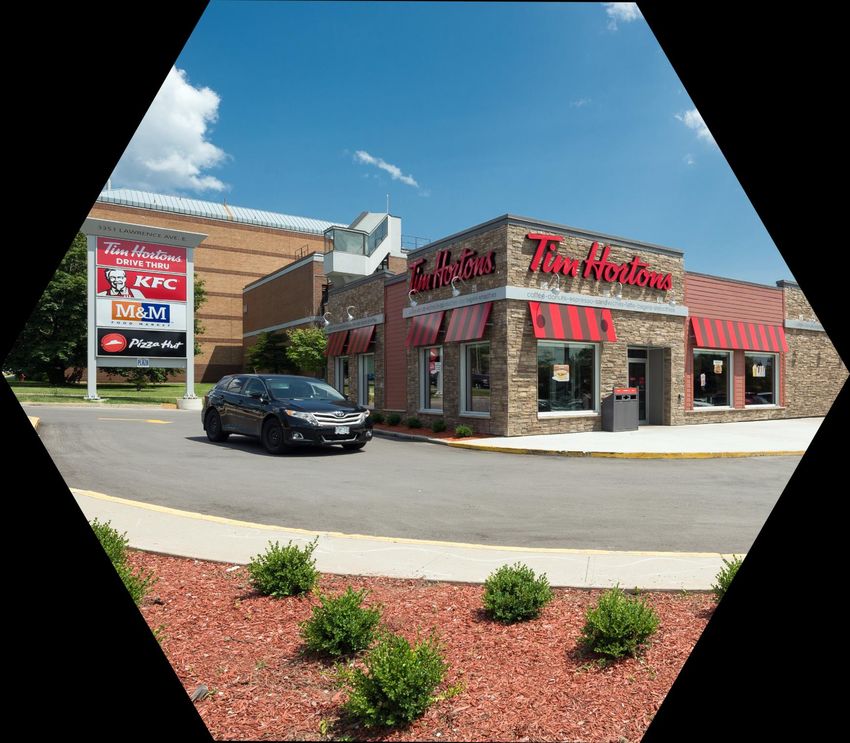
Rendering3351 Lawrence Ave. East
Scarborough, ON
BEFORE
REDEVELOPMENT
Rendering1000 Islands Plaza
Brockville, ON
BEFORE
REDEVELOPMENT
RenderingNEW CONSTRUCTION
PROJECTS
2020The Shoppes at Galway St.John’s, NL PRINCESS AUTO SCHOOL OF ROCK MICHAELS
The Shoppes at Galway
St.John’s, NL
Silver Fox Plaza
New Minas, NS
               PETSMART IN PROGRESS

                                      Rendering
Carson & Mapleton
Moncton, NB
MILESTONES
RenderingPlaza des Laurentides St-Jérôme, QC
Plaza des Laurentides
St-Jérôme, QC
Century Avenue
Missisauga, ON

   MOVATI ATHLETIC
You can also read