Investor Investor Presentation Presentation - Q4 2014 Q2 2014 - aw - RTS
←
→
Page content transcription
If your browser does not render page correctly, please read the page content below

Investor
 Investor Presentation
Presentation
        Q2 2014
Q4 2014

         aw
Forward Looking Statement

 These slides and any accompanying oral presentation
 by Intuitive Surgical, Inc. contain estimates and
 forward-looking statements. Actual results may differ
 materially from those expressed or implied as a result
 of certain risks and uncertainties. These risks and
 uncertainties are described in detail in the Company’s
 Securities and Exchange Commission filings.
Risks

  Serious complications may occur in any surgery,
  including da Vinci® Surgery, up to and including death.
  Individual surgical results may vary. Patients should
  talk to their doctor to decide if da Vinci Surgery is
  right for them. Patients and doctors should review all
  available information on non-surgical and surgical
  options in order to make an informed decision. Please
  also refer to http://www.daVinciSurgery.com/Safety
  for Important Safety Information.

Company Overview and
Introduction

Corporate Overview
Founded in 1995, IPO 2000
2013 Revenue - $2.27B, up 4% from 2012
Q3 YTD 2014 $1.53B vs. $1.69B Q3 YTD 2013
Approximately 523,000 da Vinci® procedures performed in
2013, up 16% from 2012
Q3 YTD 2014 Procedures up approximately 9%
3,174 da Vinci® System installed base as of 9/30/14
2,185 United States, 516 Europe, 473 Rest of World
Numerous FDA and International Regulatory Clearances
Primary Markets - Urology, Gynecology, General Surgery,
Cardiothoracic
.
Adoption of da Vinci® Surgery is Driven by
Patient Value

                        Efficacy
 Patient Value =
                     Invasiveness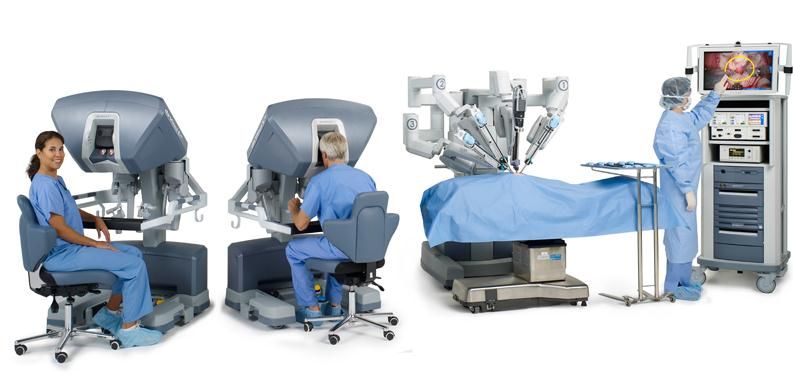
Recurring Revenue Model

                            Instruments &
                            Accessories
                            $700-$3,200
                            per procedure
                            2013 Rev $1,033M

                            Annual Service
                            Agreement

                            $100K - $170K/Year
da Vinci® Surgical System
$0.9M - $2.5M               2013 Rev = $397M

2013 Rev = $835M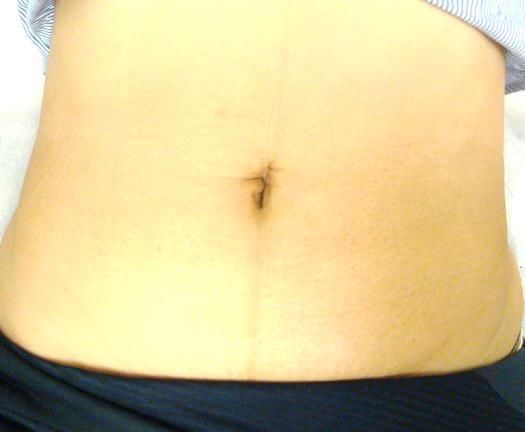
Toward Better Surgery – Our Strategy

Innovate to improve outcomes and shorten recovery time to
enable minimally invasive surgery as the standard of care in
complex procedures

Innovate in access, precise tissue interaction, and imaging
to improve upon conventional MIS procedures

Reduce the total treatment cost for surgery by reducing
complications, readmissions, and recovery time

Continue to build a high performance, responsive
organization
Procedures and Market
Opportunity
da Vinci® Target Procedures
Urology General Surgery
dV Colorectal Procedures
da Vinci® Prostatectomy – dVP Single-Site Cholecystectomy
dV Partial Nephrectomy
dV Cystectomy Cardiac
dV Mitral Valve Repair
dV Pyeloplasty dV Revascularization
Gynecology
Thoracic
da Vinci® Hysterectomy – dVH dV Lobectomy
dV Sacrocolpopexy
dV Myomectomy Head and Neck Surgery
dV Transoral Procedures
dV Endometriosis ResectionAnnual Worldwide Procedures
Urology
500,000
Gynecology
General Surgery
400,000
Other
300,000
200,000
100,000
0
2008 2009 2010 2011 2012 2013
Company EstimatesUS Procedure Adoption Q3 2014
100%
Procedures
dVP
dVH - Cancer
dVH - Benign
Cholecystectomy
Share of ISRG Target Market
Sacrocolpopexy
Nephrectomy (Prtl & Full)
Colorectal
Myomectomy
Lobectomy
TORS
Mitral Valve Repair
200K Annual Procedures
0%
Time
Conceptual depiction of procedure adoption, scaling is approximate.Significant Opportunities Exist for Complex
Procedures in International Markets*
United Western Other
States Europe Developed1
Prostatectomy Opportunity 70,000 110,000 40,000
Penetration 83% 27% 34%
Malignant Opportunity 55,000 dVP** 45,000 17,000
Hysterectomy Penetration 75% 10% 6%
Colorectal2 Opportunity 140,000 420,000 80,000
Procedures Penetration 9% 1% 1%
*Based on Company estimates
1. Includes Japan, South Korea, Australia, and Canada
2. Limited to estimate of open proceduresdV has Increased MIS Penetration Where Other
MIS Approaches Exist
U.S. Benign Hyst 2005 U.S. Benign Hyst 2013
Vaginal Vaginal
19% 15% dV
31%
Lap Open Lap
22% 59% 32% Open
22%
500,000+ procedures ~450,000 procedures
Sources: Premier, Truven Health and ISI estimatesU.S. Hysterectomy Market Share Trend
100%
Total volume of benign
Robotic Open hysterectomies has been in
Laparoscopic Vaginal decline due to payer
disincentives and shifting
80% treatment protocols
Hysterectomy Patients
MIS adoption has reached
nearly 80%, and
60% remaining open surgeries
are spread across a diffuse
population of surgeons
40% dVHb is expected to
decline in similar rates as
the market in 2014
20%
0%
2005 2006 2007 2008 2009 2010 2011 2012 2013
Sources: Premier, Truven Health and ISI estimatesWe Serve Multiple Segments
Typically Benign Cases Typically Open Complex Cases
Low Anterior
Resection Lobectomy
Benign Hysterectomy
CholecystectomyRange of Pricing Supports these Segments
2013: $1.52M
Dual Console Xi
da Vinci
Firefly™
Si-e $0.9M $2.5M
da Vinci® Surgical System ASP
2013: $1,980
Endowrist®
Single-Site™
Vessel Sealer
$700 Inst & Accy Rev Per Procedure $3,200 Stapler
da Vinci 2013: $145K Dual
Si-e Console Xi
$100K Annual Service Rev Per System $170K
Typically Benign Typically CancerSingle Incision Surgery – Fewer Entry Ports
Single-Site
Robotic-Assisted Surgery
through a single umbilical port
Single Site is FDA cleared for
cholecystectomy and benign
hysterectomy / oophorectomy
da Vinci SP
Being developed for added
capabilityda Vinci® Surgery Long Term Revenue Potential
for Current Target Procedures
US Target Procedures:
Urology 150,000 Cardiac 75,000
Gynecology 450,000 Thoracic 75,000
General 475,000 Head and Neck 25,000
Subtotal US 1,250,000
International Target Procedures 1,250,000
Total Worldwide 2,500,000
Annual I&A Revenue $4.0 Billion
Annual System Revenue $1.9 Billion
Annual Service Revenue $1.3 Billion
Company EstimatesInternational Business
2013 Revenue - $639M, up 41% from 2012
Q3 YTD 2014: Revenue - $441M vs $444M YTD 2013
Approximately 101,000 da Vinci® procedures performed in
2013, up 21% from 2012
Q3 YTD 2014 procedures up approximately 20%
Earlier stage procedure adoption driven by prostatectomy,
approximately 30% penetrated in 2013
Significant available opportunities in other target
procedures, including dVH Cancer and Colorectal
Significant investments for future growth
Japan: Transition to direct sales structure, clinical
trials, organizational expansion
Europe: Market access, sales coverageProducts & Innovation
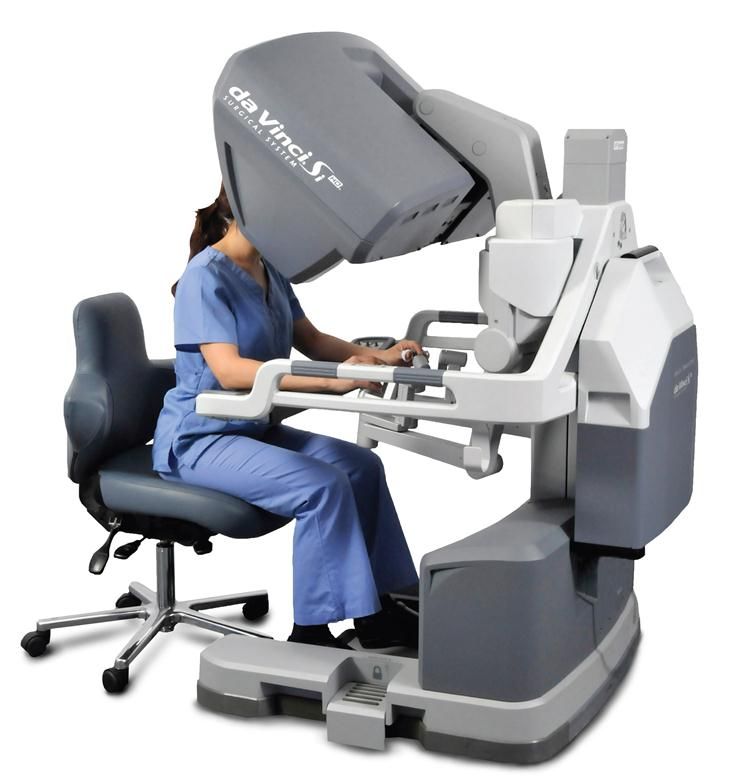
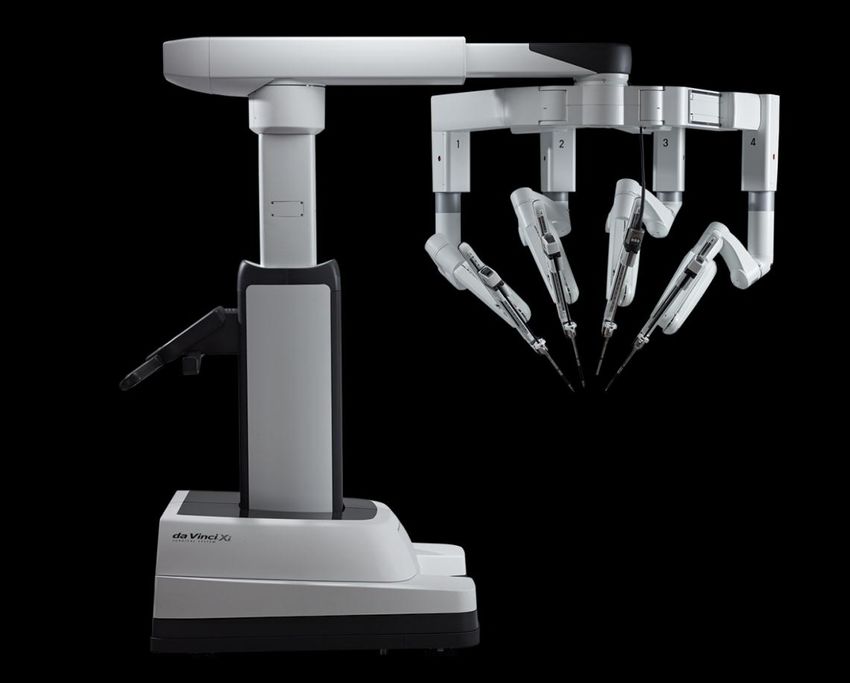
da Vinci Xi
Fourth Generation da Vinci
Surgical System
Launched Early Q2 2014 in the US
Optimized for Multi-Quadrant
Surgical Access
Longer, Thinner Arms
Laser Targeting and Voice Assisted
Set-up
Lighter, slimmer Endoscopes can
move between ports
No draping, focusing, white
balance, or calibration required
for endoscope
Integrated electrosurgical
generatorEndoWrist Stapler – Excellent Articulation and Precise Tissue Interaction Additional degree of freedom Highly stable SmartClamp estimates tissue thickness prior to firing
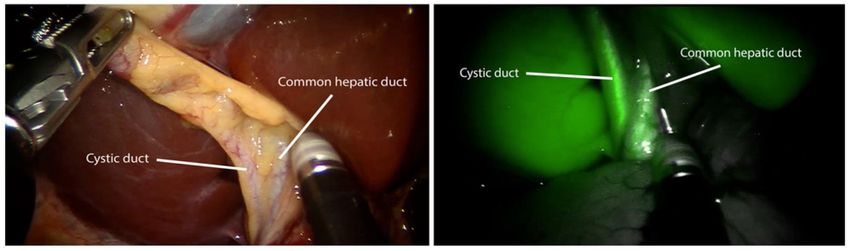
Firefly™ Fluorescence Imaging – Biliary Ducts

Spinoglio et al., Surgical Endoscopy 27:2156 (2013)
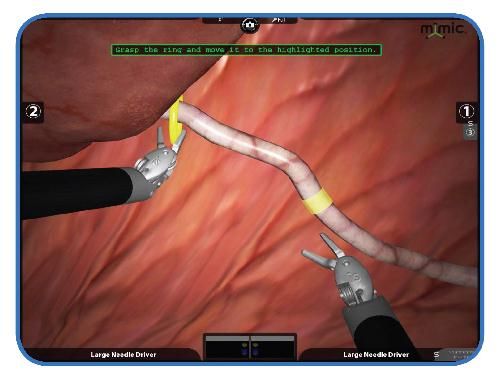
Skills Simulator – Practice Technique Measure Proficiency Attaches to surgeon console Exercises designed to practice system skills Retain and compare scores to local and national benchmarks
da Vinci SP in Development New One-Armed Patient Side Cart dedicated to Single Port Surgery FDA Cleared for Urology Q2 2014 Initial version will not be commercialized Development work is underway to adapt the SP to the da Vinci Xi Artist Rendition platform Anticipate initiating clinical use of the da Vinci Xi SP in the second half of 2015
Clinical Evidence &
Training
da Vinci System widely Evaluated in Peer-
Reviewed Literature
Greater than 8,000 peer-reviewed publications on da Vinci
System use*
99% of studies independent of ISI
More than 1,000 comparative studies (includes ~ 200
prospective comparative studies + systematic reviews and ~ 800
retrospective comparison studies )
Numerous Health Technology Assessments performed
New publications on da Vinci System appearing at the rate
of ~100 per month
* As of Q314da Vinci System in Prostatectomy… Benefits Compared to Open Surgery da Vinci versus open prostatectomy + Less estimated blood loss & transfusions + Fewer complications + Lower mortality rate + Shorter length of stay + Lower overall and T2 positive surgical margin rates + Reduced rate of urinary incontinence + Reduced rate of erectile dysfunction - Longer operative time (21 minutes - Liu) References: Trinh et al, Eur Uro, 2012; Kowalczyk et al, Eur Uro, 2012; Liu et al, Onc, 2013; Tewari et al, Eur Uro, 2012; Moran et al, Int J Urol, 2013; Ficarra et al, Eur Uro, 2012
Clinical Literature Supports Overall Benefit of
da Vinci System in Hysterectomy
Versus open hysterectomy Versus laparoscopic
+ Less estimated blood loss & hysterectomy
fewer transfusions + Fewer conversions to open
+ Fewer complications surgery
+ Shorter length of stay + Less prolonged length of stay
+ Fewer re-admissions at 30 days + Fewer re-admissions at 30 days
- Longer operative time + Similar complication rates
(34 minutes in Lau) +/- Varied reports, some longer some
shorter
References: Scandola, JMIG, 2011; Wright, JAMA, 2013; Gaia, Obstet &Gynec, 2010;
O’Neill, Arch Gyn & Obstet, 2013; Paraiso, Am J OB-GYN, 2013; Lau Obstet & Gynec,
2012; Martino, Journal of Minimally Invasive Gynecology, 2013Training – Multifaceted and Multiple Roles
Surgeon Self-
directed
Skills
Development
and
Simulation
Continuing Case
Medical Observations
Education and Surgical
Courses Mentorship
Intuitive
Technology
Training
Pathway
Residency
and
Fellowship Proctorships
Training with
da Vinci
Expert Led
Advanced
Clinical
CoursesComplications by Robotic Experience
da Vinci
20% Prostatectomy starts
18% safer and gets better
for the average
16%
surgeon and patient
14%
12%
Robotic Complications
10%
8%
Open Complications
6% (Hosp w/o daVinci)
4% Open Complications
2% (Hosp w/ daVinci)
0%
25 50 75 100 125 150
Robotic Surgeon Case Experience
Population-based study using the Premier Perspective Database; 71,312 prostatectomies performed between 2004 and 2010 at more than 300 hospitals - 27,348
Robotic Prostatectomies, 43,964 Open Prostatectomies. The authors examined perioperative outcomes stratified by surgeon experience with robotics.
Intuitive Surgical paid for access to the Premiere database and Axistat consulting services. Lead author Dr. Davis was reimbursed for travel expenses related to
this study. Author Jessica Gabbert is employed by InClin (formerly Axistat). Author Usha Kreaden, Principal Biostatistician, is employed by Intuitive Surgical.Financial Results
Annual Worldwide Procedures

                                                 2014 Guidance:
600,000   United States                          8-9% Growth
          International
500,000

400,000

300,000

200,000

100,000

     0
          2009       2010   2011   2012   2013       2014
da Vinci® System Installed Base
3,000
United States
2,500 International
2,000
1,500
1,000
500
0
Q309 Q310 Q311 Q312 Q313 Q314Installs by Country and Region
Canada 25
Europe
516
Norw ay 11 Distribution Greece 10
Direc t
Czec h Republic 8 Italy 72 Romania 5
Franc e 82
Finland 5 Spain 29
USA Germany 72
UK 44
Austria 5 Turkey 24
Bulgaria 2
Portugal 1
Ireland 3 Russia 22 Poland 1
Belgium 33
2,185 Sw itzerland 25
Luxembourg 1
Ic eland 1
Slovenia 1
Sw eden 23
Slovakia 1
Netherlands 19
Monaco 1
Denmark 15
Asia
M iddle
East 339 Japan 188
Saudi Arabia 13 30
South Korea 46
Israel 7
Brazil 13 China 36
Qatar 4
Mexic o 5 Latin India 27
Lebanon 2
Argentina 5 America Taiw an 23
Pakistan 2
Chile 5 Egy pt 1
Singapore 7 Australia/New
40 Thailand 6
V enezuela 4 Kuw ait 1 Zealand 35
Colombia 3 Malaysia 3
Puerto Ric o 2 Philippines 2
South Africa 4 Indonesia 1
Panama 1
Uruguay 1
Dominic an Republic 1
Intuitive sells directly to customers in the US, Korea, and the European countries indicated above.
In June 2014 direct sales rights were obtained in Japan. Sales are through distributor partners in all
other areas of the world including, Canada, Latin America, the Middle East, Asia and Australia.Net Income – GAAP and Non-GAAP
$900
GAAP Net Income
$750 Non-GAAP Net Income*
$600
$450
$300
$150
$0
2009 2010 2011 2012 2013
GAAP to Non-GAAP Reconciliation
(mi l l i ons ) 2009 2010 2011 2012 2013
GAAP Net Income $ 232.6 $ 381.8 $ 495.1 $ 656.6 $ 671.0
Amortization of Intangibles, net of tax $ 9.7 $ 10.5 $ 11.2 $ 14.7 $ 13.6
Share-based Compensation, net of tax $ 70.5 $ 78.4 $ 93.5 $ 105.8 $ 110.4
Non-GAAP Net Income $ 312.8 $ 470.7 $ 599.8 $ 777.1 $ 795.0Income Statement Trend
($M, except per share amounts)
2009 2010 2011 2012 2013
Sales $1,052 $1,413 $1,757 $2,179 $2,265
Gross Profit % 71.4% 72.9% 72.5% 72.1% 70.4%
Operating Income $377 $555 $695 $878 $853
Operating Income % 35.9% 39.3% 39.5% 40.3% 37.6%
Net Income $233 $382 $495 $657 $671
% of Revenue 22.1% 27.0% 28.2% 30.1% 29.3%
Fully Diluted EPS $5.93 $9.47 $12.32 $15.98 $16.73
Non-GAAP EPS * $7.98 $11.68 $14.92 $18.91 $19.83
* These pro-forma amounts are non-GAAP financial measures. We use these non-GAAP financial measures for financial and operational
decision-making and as a means to evaluate period-to-period comparisons. Our management believes that these non-GAAP financial
measures provide meaningful supplemental information regarding our performance and liquidity by excluding certain expenses an d
expenditures that may not be indicative of our recurring core business operating results. Non-GAAP EPS represents Non-GAAP Net
income, divided by 40.1, 41.1, 40.2, 40.3, and 39.2 million diluted shares outstanding for 2013, 2012, 2011, 2010, 2009, resp ectively.Corporate Assets and 2014 Priorities
Corporate Assets Extraordinary people 3,174 da Vinci® System installed base 9/30/14 Numerous FDA and international regulatory clearances Extensive instrument and accessory product line da Vinci® Training centers worldwide Ownership of or exclusive rights to over 1,540 U.S. and foreign patents and more than 1,460 US and foreign patent applications da Vinci® patient awareness
2014 Priorities Expand da Vinci Xi and Stapler launches worldwide Invest and grow in OUS markets (EU, Japan in particular) Expand Single-Site use, instrumentation and imaging to enable da Vinci use as an alternative to traditional multi-port procedures Continue building a high performance, responsive organization that invents and deploys the next generation of technologies that improve surgical outcomes and value
Thank You
© 2014 Intuitive Surgical. All rights reserved. Intuitive, Intuitive Surgical, da Vinci, da Vinci S, da Vinci Si, Single-Site, InSite, Firefly, EndoWrist One,
EndoWrist Stapler and EndoWrist are trademarks or registered trademarks of Intuitive Surgical. All other product names are trademarks or registered
trademarks of their respective holders. PN 873725 Rev. E 11/11
You can also read