Investor Presentation - Q4 2021 - Municipal Finance Authority

Page created by Jim Burke
 
CONTINUE READING
Investor Presentation - Q4 2021 - Municipal Finance Authority
Investor Presentation
Q4 2021
Investor Presentation - Q4 2021 - Municipal Finance Authority
D I SC L A IMER

This presentation, including the accompanying slides and subsequent discussion, contains
certain forward-looking information, forecasts, projections, goals and strategies (the “forward-
looking information”) with respect to revenues, funding, expenses, the financial condition, and
results of operations. This forward-looking information represents the Municipal Finance
Authority of British Columbia’s expectations or beliefs concerning future events and involves
known and unknown risks and uncertainty that could cause actual results, performance or events
to differ materially from those expressed or implied in such statements. This material is for
information purposes only.

                                                                                                   2
Investor Presentation - Q4 2021 - Municipal Finance Authority
INTRODUCTION

•   Formed in 1970 under the Municipal Finance Authority of British Columbia Act

•   BCMFA is the only Public Sector Regional Infrastructure Agency in the world that
    has direct and unfettered taxation powers

•   Long term debt ratings of AAA/Aaa/AAA by S&P/Moody’s/Fitch

•   Infrastructure financing to local government in the Province of British Columbia
     -   Access to stable and lowest cost funding for sewer, water, roads, public
         works, parks, etc.

•   Provide competitive investment alternatives and quality financial education

•   We have consistently been profitable from operations and benefit from direct
    taxation power and a stable and large capital base to support our lending.

•   Our borrowing program emphasizes predictable and large public offerings:
    BCMFA is the benchmark municipal issuer in Canada - offering the highest credit
    quality and most liquid bonds in the sector
                                                                                       3
Investor Presentation - Q4 2021 - Municipal Finance Authority
LINES OF BUSINESS

MFA Line of
              Strategic Fit       Description                    Market Positioning
Business
Long-Term     Core Business       MFA’s core business activity   No competitors. By legislation, all
Financing                         is providing long-term         long-term borrowing by
                                  financing to local             municipalities and regional districts
                                  governments.                   in British Columbia must be
                                                                 provided by MFA.

Short-Term    Secondary revenue MFA provides optional short- Low competition. MFA is able to
Financing     stream (non-core) term financing to local      offer highly competitive short-term
                                governments.                 lending rates to BC local
                                                             governments.

Pooled        Secondary revenue MFA provides optional            Highly competitive. However, MFA is
Investment    stream (non-core) investment products to local     able to provide local governments
Products                        governments through its          with broad exposure to different
                                pooled fund offerings.           asset classes (vs. strict limitations
                                                                 set out in the Community Charter).

                                                                                                         4
Investor Presentation - Q4 2021 - Municipal Finance Authority
GOVERNANCE

                                             • 28 Regional Governments made up of
British Columbia – Local Government
                                              municipalities, cities, towns & villages

                                    • 39 Members appointed by local government
Board of Directors
                                    • Responsible for reviewing loans, electing trustees

                             • Trustees responsible for overseeing operations and
10 Trustees                    management
                             • Authorize debt issuance

                     • Manage loans, debt and investments
MFA Employees        • Balance sheet of $10.1bn
                     • Complement of 17 professionals

                                                                                           5
Investor Presentation - Q4 2021 - Municipal Finance Authority
L E G I S L ATI V E C R E D I T S T R E N G T H S

Taxation Authority
Equally applied to all taxable land and improvements in BC
       • Annual operational tax levied every year
       • Unlimited taxation authority to replenish Debt Reserve Fund
       • BCMFA must increase taxes to replenish Debt Reserve Fund in certain circumstances
       • Senior-level government approval not required – Trustees of BCMFA approve
       • Property values assessed of approximately $1.8 trillion

Joint Liability
Borrowers’ long-term debt with BCMFA is a Regional District liability
       • Borrowers guarantee each other’s debt in event of default
       • Joint and several guarantees never been applied (zero losses)

Investments
Sinking Fund Methodology
       • Semi-annual billing of interest to match debenture coupons
       • Annual billing of principal for debt retirement
       • $4.5 billion in investments (52% of gross long-term debt)

                                                                                             6
Investor Presentation - Q4 2021 - Municipal Finance Authority
RISK CAPITAL MANAGEMENT
•   BCMFA has over $200 million of immediately available on balance sheet capital, yet has exhibited no
    credit losses in its 50-year history

•   In 2019 BCMFA adopted a policy and framework outlining a target for on-balance sheet risk capital, the
    retention of operating surplus, and the ongoing management of capital
         The Strategic Retention Fund ($96 million) and Debt Reserve Fund ($120 million) collectively
          comprise total capital ($216 million as at December 31, 2020).
         The MFA has self imposed the following requirements on itself. The Capital Adequacy Model targets
          a capital level for the greater of a non-risk capital assessment ($202M) and a risk-based capital
          assessment ($171M):
                                                                                                              7
BC LOCAL GOVERNMENT LEGISLATIVE COMPLIANCE

  Balanced Budgets
   • Under provincial legislation, municipalities may not plan for a deficit

  Transparency and Disclosure
    • Audited financial statements - PSAB, by May 15
    • Annual Report - presented to residents, by June 30

  Long-Term Capital and Financial Planning
   • Five year financial plans - public consultation, by May 15

                                                                               8
BC LOCAL GOVERNMENT BORROWING FRAMEWORK

Debt Limits         Only 25% of recurring revenues eligible to service debt costs

Taxpayer            All long-term municipal debt in BC requires a public approval process

                    Legislation requires the Provincial Inspector to verify:
                    • Borrowings are legal and within debt limits
Province of BC
                    • Municipalities have the financial ability to service debt

Regional District   Long-term debt is approved by the Regional District

                    •   Oversight and review
                    •   Due diligence and statutory reviews
                    •   Management credit review
MFA
                    •   Trustees and Members review loan requests
                    •   Members authorize the sale of securities

                                                                                            9
BRITISH COLUMBI A’S DIVERSE ECONOMY
                                                                Educational
                                                                 Services
                                       Natural Resources          5.2%
                                                                                               Real Estate, Rental
                                             5.7%                                                  & Leasing
                                                                                                     17.6%

                     Public Administration
                             5.7%

                Finance & Insurance
                       5.8%

                Transportation &                                                                                Other
                 Warehousing                                                                                    14.5%
                     6.4%

                     Professional,
                      Scientific &
                   Technical Services
                         6.5%
                                                                                                        Wholesale & Retail
                                                                                                             Trade
                                  Manufacturing                                                              9.5%
                                     6.8%
                                              Health Care & Social                   Construction
                                                   Assistance                           8.9%
                                                     7.4%

Note: 2019 figures shown
Source: British Columbia Financial and Economic Review – 80th Ed. (September 2020)                                           10
MFA’ S ESG APPROACH
•   Since inception in 1970, MFA’s main mandate of providing low-cost lending for
    local government capital projects has provided tremendous benefits to
    communities and citizens across British Columbia
     •   MFA has recently committed to increasing its efforts on collecting,
         standardizing and disseminating more granular data on its lending activities to
         assist the investment community
•   MFA will now provide “Use of Proceeds” disclosure in conjunction with all future
    bond issues and in our annual report every year
     •   MFA’s initial approach will be to map its use of proceeds to UN SDG’s, Green
         Bond Principles and Social Bond Principles
     •   Management is committed to helping improve both local government and
         MFA’s disclosures over time - in conjunction with expected improvements of
         global ESG reporting standards
•   MFA currently has no intention of issuing certified labeled bonds. The pooled
    nature of our borrowing supports multiple loans to numerous Members for any
    given single bond issue. While we are fully committed to mapping our borrowing
    to specific “Uses of Proceeds” and UN PRI categories, the ‘impact’ of that lending
    along ESG categories is challenging due to lack of standardization and/or capacity
    of our smaller Members to report back on comparable Key Performance Indicators
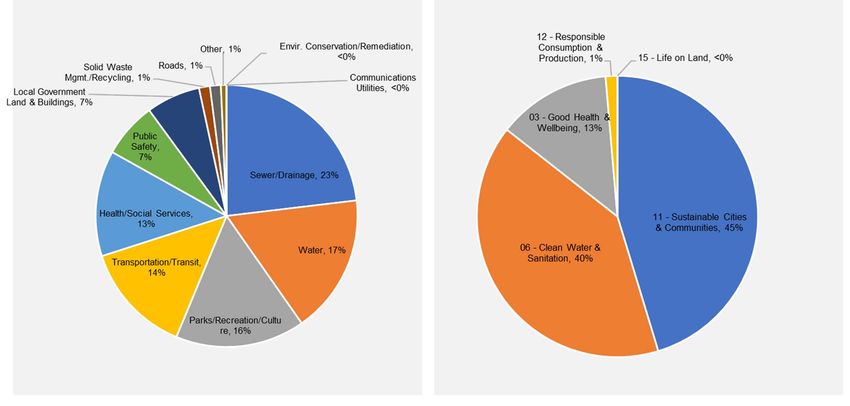
                                                                                           11
MFA’ S LENDING MEETS ESG CRITERIA

      2021 Issuance Split by Purpose ($1.975bn)              2021 Issuance Split by UN SDG ($1.975bn)

   MFABC was created to increase the ability of local governments to enhance societal benefits across BC
   BC’s local governments have a long tradition of focusing on sustainability and social equity
   Almost half the proceeds from MFA’s 2021 borrowing program were used to support regional water
    related and sewer/drainage infrastructure.

                                                                                                            12
R E C E N T LO N G - T E R M DE B T I S S U A N C E

  C$mm            Date         Term         • Typically issue new 10-year in
   $350      Sept 14, 2021      20            spring (April) and fall (September)
   $475      May 12, 2021        5              - Will often issue a 10.5-year
   $500      May 12, 2021        10               and re-open in 6 months
   $450      March 30, 2021      5
   $200      March 30, 2021     10          • New 5-year issues are typically
                                              completed “off-cycle” and are
   $125       Sep 22, 2020       5            aligned with existing debt
   $615      May 20, 2020        5            maturities
   $280      March 26, 2020      5
   $235       Sep 25, 2019      10          • Focused on building benchmark
   $800      May 21, 2019        5            issues over $500mm
   $170       April 1, 2019     10.5            - Currently 9 outstanding
                                                  issues >$500mm
   $605       Nov 16, 2018       5
                                                - Well defined curve out to
   $555       Sep 12, 2018      10
                                                  2031
   $410      April 10, 2018      5
   $170      April 10, 2018     10.5
   $500       Nov 21, 2017       5
                                                                                    13
ANTI CIPATE D BORROWI NGS

     Year       2022     2021

                                  •   $450mm completed in March
                                      2021.
 5 Year ($mm)   $650     $950
                                  •   $475mm completed in May
                                      2021.

                                  •   New $200mm 10 year completed
                 $675     $800        in March 2021.
 10 / 20 Year
                  to       to     •   Reopened MFA 2.30% April 15,
   ($mm)
                $1,125   $1,200       2031 bonds for an additional
                                      $500mm May 2021.
                                  •   New $350mm 20 year completed
                                      Sept 2021.
                $1,325   $1,750
 Total ($mm)      to       to
                $1,775   $2,150   •   Funding now complete for 2021

                                                                      14
MUNICI PA L BOND SECOND A RY TRADI NG VOLUME
                                   2020 MUNICIPAL SECONDARY TRADING VOLUME ($ billions)
         $15.1

                      $12.2

                                    $6.8

                                                 $2.0
                                                               $1.4
                                                                            $0.7         $0.7          $0.6         $0.6          $0.5         $0.2         $0.1          $0.0

       BCMFA         Muni A        Muni B       Muni C       Muni D        Muni E       Muni F       Muni G        Muni H        Muni I       Muni J       Muni K       Muni L

                                   2019 MUNICIPAL SECONDARY TRADING VOLUME ($ billions)

         $10.1
                       $9.4

                                    $5.0

                                                 $2.6
                                                               $0.9         $0.5         $0.5          $0.5         $0.5          $0.5         $0.2         $0.2          $0.1

       BCMFA         Muni A        Muni B       Muni C       Muni D        Muni I       Muni H       Muni G        Muni F       Muni J       Muni E        Muni K       Muni L

Note: The 12 unnamed municipalities shown above include: First Nations Finance Authority, Halton, Montreal, Ottawa, Peel, Quebec, TransLink, Toronto, Vancouver, Winnipeg,
Waterloo and York, with combined trading volume of $31.1bn in 2019 and $41.1bn in 2020. Total Canadian municipal trading volume per IIROC in 2019 of $36.0bn and in 2020 of
$45.8bn includes primary issuance of unrated municipal debt.

Source: BMO Capital Markets, Scotia Capital, Casgrain Capital Markets, CIBC World Markets, Laurentian Bank Securities, National Bank Financial, RBC Capital Markets, TD Securities
and IIROC MTRS 2.0 Reporting.
                                                                                                                                                                                     15
IMPLIED PROVINCIAL BOND SECONDARY TRADING VOLUME
                                                                                                                                                 (1)
                                  2020 PROVINCIAL SECONDARY TRADING VOLUME ($ billions)
                  (2)
       $939.3

                        $315.8

                                       $71.8
                                                       $46.3
                                                                       $23.5          $15.1           $14.1           $11.2           $9.9             $8.7           $1.2
        Ontario         Quebec         Alberta           BC           Manitoba        BCMFA        Saskatchewan       New         Newfoundland         Nova           PEI
                                                                                                                    Brunswick                          Scotia
                                                                                                                                                 (1)
                                  2019 PROVINCIAL SECONDARY TRADING VOLUME ($ billions)
                  (2)
       $744.3
                        $255.8

                                       $48.9
                                                       $30.7
                                                                       $19.9
                                                                                      $10.7           $10.1           $9.9            $7.5             $7.4           $1.1
        Ontario         Quebec         Alberta           BC           Manitoba     Saskatchewan       BCMFA            New            Nova        Newfoundland        PEI
                                                                                                                    Brunswick         Scotia

Note: (1) IIROC provides specific secondary trading volume figures for Alberta, BC, Ontario, and Quebec and a consolidated figure for “Total Provinces”. Secondary trading
volumes shown in the charts above for Manitoba, New Brunswick, Newfoundland, Nova Scotia, PEI and Saskatchewan are estimates based on their respective outstanding debt
weighted pro-rata share of the “Total Provinces” category. (2) Ontario trading volume on chart is not shown to scale.
Source: Bloomberg, BMO Capital Markets, Scotia Capital, Casgrain Capital Markets, CIBC World Markets, Laurentian Bank Securities, National Bank Financial, RBC Capital Markets,
TD Securities and IIROC MTRS 2.0 Reporting.
                                                                                                                                                                                  16
(1)

  M FA B C B O N D L I Q U I D I T Y: S E C O N D A R Y T R A D I N G T U R N O V E R

                                     $2,835
                                           4.0x

                                                                                                                                                                                       Outstanding Bond Size ($ millions)

                                                                                                                                                                                       2020 Secondary Trading Volume ($ millions)

                                                                                                                                                                                       Secondary Trading Turnover (ratio)

                     $1,971
                              3.8x

                                                                                                                         $1,501
                                                                                                                                  1.9x                                  $1,441
                                                                                                                                                                              3.5x
                                                                                                                                                      $1,256
                                                                $1,176                                                                                           3.5x
                                                                         2.4x
                                                                                                           $1,031
                                                                                                                 1.7x

                                                                                                                      $800
                                                                                              $745                                                                                                                $725
                                 $710                                                                1.5x                                                                                        $670
                                                                                                        $605                                                                         $610
                                                                                $522       $485
                 $515                                        $500                                                                        $497
       $474                                                                            1.3x
              2.6x                                                          $410                                                                1.5x               $410                                                          $405
                                                                                                                                                                                                                      $377
                                                  $339                                                                               $335           $359
                                               $290                                                                                                                                                  $295                    0.5x   $282
                                                       1.2x                                                                                                                            $264
                                                                                                                                                                                              0.4x           0.4x                          0.7x
$181

                                                                                                                                                           (2)              (2)
   4.45% (2)        1.65%           4.15%         3.35%         2.15%          2.60%         3.75%         2.80%         2.15%          2.95%         1.10%            2.65%         2.50%          4.95%            3.05%         2.55%
01-Jun-2020      19-Apr-2021     01-Jun-2021   01-Jun-2022   01-Dec-2022    23-Apr-2023   26-Sep-2023   03-Dec-2023   03-Jun-2024    14-Oct-2024   01-Jun-2025      02-Oct-2025   19-Apr-2026    01-Dec-2027      23-Oct-2028   09-Oct-2029

  Throughout 2020, the outstanding stock of MFABC bonds turned over
  1.9x, with large benchmark issues turning over up to 4.0x
Notes: (1) Includes MFA bonds with a time-weighted average outstanding balance >$150mm for the calendar year 2020.
       (2) Indicates outstanding bond size was adjusted for maturity or new-issuance/re-opening part way through the calendar year 2020.
Source: BMO Capital Markets, Scotia Capital, Casgrain Capital Markets, CIBC World Markets, Laurentian Bank Securities, National Bank Financial, RBC Capital Markets, and TD
Securities.                                                                                                                                                                                                                                   17
MFABC LONG-TERM DEBT DISTRIBU T ION
                                  2020                2021

By Investor
Type:

              Germany 2%            Sw itzerland 1%
              Norw ay 4%
              England 5%

                        United
                      States 7%
By
Geography:

                                      Canada 81%

                                                             18
COMMERCIAL PAPER ACTIVI T Y

  • $700 million approved program size

  • Rated A-1+ / P-1 by S&P/Moody’s

  • Strong dealer network of 7 banks

  • Typically priced around 4 to 6 basis points back of provincial issuance
    levels

  • Issued every Wednesday in 1-month and 3-month terms

                                                                              19
COMMERCIAL PAPER DISTRI B U TION

                                                     2019                                  2020                                           2021
                                                          Corporates                     Corporates    Government     Government
                                            Government
                                                             1%                             3%            2%             6%
                                               7%

                                                                                Pension
                                   Investment                                    Asset                                                           Investment
 By Investor Type:                  Managers                                    Managers                Investment            Pension
                                                                                                                                                  Managers
                                      26%                                         37%                                                               53%
                                                                                                         Managers              Asset
                                                              Pension                                      58%                Managers
                                                               Asset                                                            41%
                                                              Managers
                                                                65%

                                                         Manitoba                                Manitoba                             Quebec     Saskatchewan
                                     International         4%                   International      2%                                  7%
                                                                                                                      International                   3%
                                          8%                                         9%
                                                                                                                          10%

                                                                    Alberta                                 Ontario
                                     Quebec                          29%      Quebec                         31%                                     Ontario
                                      10%                                      13%                                                                    36%
     By Geography:                                                                                                        British
                                                                                                                         Columbia
                                                                                                                           10%
                                                                               British
                                     Ontario
                                                                              Columbia
                                      22%
                                                                                19%
                                                             British
                                                            Columbia                                  Alberta                          Alberta
                                                              27%                                      26%                              34%

Note: All figures shown as at February 28                                                                                                                       20
LONG-TERM LOAN PORTFOLIO DIVERSIFICATION
                                                                Northeast
                                        Net Loans:               $162mm (3%)
                                        Property Value:            $17bn (1%)
                                        Population:                   0.07mm
                                        Net Loans Per Capita:          $2,262

                                                                  Interior
North Coast                             Net Loans:               $91mm (2%)
Net Loans:                $68mm (1%)
                                        Property Value:            $25bn (1%)
Property Value:            $14bn (1%)
                                        Population:                   0.17mm
Population:                   0.10mm
                                        Net Loans Per Capita:           $538
Net Loans Per Capita:           $696

                                                          Central Interior
                                        Net Loans:              $738mm (15%)
                                        Property Value:           $146bn (8%)
Vancouver Island                        Population:                   0.60mm
Net Loans:              $890mm (19%)    Net Loans Per Capita:          $1,233
Property Value:          $241bn (14%)
Population:                   0.87mm
Net Loans Per Capita:          $1,022

Metro Vancouver                                                 Southeast
Net Loans:            $2,696mm (56%)    Net Loans:               $158mm (3%)
Property Value:        $1,297bn (73%)   Property Value:            $37bn (1%)
Population:                   3.10mm    Population:                   0.16mm
Net Loans Per Capita:            $869   Net Loans Per Capita:           $977

                                                                             21
LONG-TERM LOAN PORTFOLIO COMPOSITION
                                           LOAN SPLIT BY REGION                                                             LOAN SPLIT BY BORROWING TYPE

                           100%    1%          2%     2%         1%       1%          1%                        100%
                                   3%          3%     3%         3%       3%          3%
                                   3%          3%     3%         2%       2%          2%                                   13%         12%        13%
                                                                          4%          3%                                                                    16%          15%         15%
                           90%     5%          4%     4%         4%                                                  90%

                                                                         15%         15%
                           80%    16%          16%   15%        16%                                                  80%                          15%                    11%         10%
                                                                                                                           19%         17%                  12%

                           70%                                                                                       70%
                                                                                                                                                  11%

                                                                                            Loan Split by Type (%)
                                                                         19%         19%                                                9%
                                                                                                                            8%                                           20%         23%
Loan Split by Region (%)

                                  17%          17%   18%        18%                                                                                         18%
                           60%                                                                                       60%

                           50%                                                                                       50%               24%        23%
                                                                                                                           23%
                                                                                                                                                            20%          19%         18%
                           40%                                                                                       40%

                           30%                                                                                       30%
                                  55%          55%   54%        55%      55%         56%

                           20%                                                                                       20%                          38%
                                                                                                                           37%         37%                               35%         34%
                                                                                                                                                            34%

                           10%                                                                                       10%

                            0%                                                                                       0%
                                  2015A     2016A    2017A      2018A   2019A       2020A                                  2015A      2016A      2017A     2018A        2019A       2020A

                                   Metro             Vancouver Island   Central Interior                                         Property Tax   Water    Sewer     Transit     Hospital

                                   Northeast         Interior           Southeast
                                   North Coast

                                                                                                                                                                                            22
BC LOCAL GOVERNMENT LOAN SERVICING ABILITY

                      Revenue (C$Bn) - LHS                Interest Expense as % of Reserves - RHS

                      Expenses (C$Bn) - LHS               Interest Expense as % of Revenue - RHS
                      Reserves (C$Bn) - LHS

              $18.0                                                                                                                     14.0%
                                                                                                                        $16.1
              $16.0                                                                                    $15.5
                                                                                                                                        12.0%
                                                                                      $14.2                                     $14.2
              $14.0                                               $13.7
                                              $12.6                                                                         $12.5       10.0%
                         $12.1                                                                             $11.8$12.1
              $12.0                                                                       $11.3
                                                  $10.4                $10.8                   $10.7
                              $10.1
                                                                               $9.7                                                     8.0%

                                                                                                                                                Percent (%)
              $10.0
C$ Billions

                                                          $8.1
               $8.0                   $7.2
                                                                                                                                        6.0%

               $6.0                 3.8%
                                                         3.3%                                                                           4.0%
               $4.0                                                            2.7%
                                                                                               2.4%
                                                                                                                2.0%            1.7%
                                                                                                                                        2.0%
               $2.0      2.2%                 2.1%                1.9%                1.8%             1.6%             1.5%
                 --                                                                                                                     0.0%
                                 2014A                2015A               2016A           2017A            2018A            2019A

                                                                                                                                                          23
CREDI T RATI NGS

Long-Term Ratings
      Agency         Rating   Outlook   Date
     S&P             AAA      Stable    May 15, 2020
     Moody’s          Aaa     Stable    Feb 2, 2021
     Fitch           AAA      Stable    April 26, 2021

Short-Term Ratings
      Agency         Rating   Outlook   Date
     S&P              A-1+    Stable    May 15, 2020
     Moody’s          P-1     Stable    Feb 2, 2021

                                                         24
Peter Urbanc
                              peter@mfa.bc.ca            (250) 419-4760
Chief Executive Officer
Matt O’Rae
                              matt@mfa.bc.ca             (250) 419-4761
Chef Financial Officer
Shelley Hahn
                              shelley@mfa.bc.ca          (250) 419-4763
Chief Services Officer

                          217 – 3680 Uptown Boulevard
                            Victoria, British Columbia
                               Canada, V8Z 0B9
                                 www.mfa.bc.ca
                                 (250) 383-1181
You can also read