Investor Presentation - v - XPO's Investor Relations
←
→
Page content transcription
If your browser does not render page correctly, please read the page content below
v

FEBRUARY 2021

Investor
Presentation
I NVESTOR PRESENTATI ON FEBRUARY 2021

Disclaimers
NON-GAAP FINANCIAL MEASURES
As required by the rules of the Securities and Exchange Commission ("SEC"), we provide reconciliations of the non-GAAP financial measures contained in this presentation to the most directly comparable measure under GAAP, which
are set forth in the financial tables attached to this document.
This document contains the following non-GAAP financial measures: earnings before interest, taxes, depreciation and amortization (“EBITDA”), adjusted EBITDA and adjusted EBITDA margin for the three and twelve-month periods
ended December 31, 2020 and 2019 on a consolidated basis; EBITDA, adjusted EBITDA, adjusted EBITDA excluding truckload and adjusted EBITDA for our North American less-than-truckload business for the twelve-month periods
ended December 31, 2020, 2019, 2018, 2017, 2016 and 2015; free cash flow for the three period ended December 31, 2020 and 2019, and the twelve-month periods ended December 31, 2020, 2019, 2018, 2017, 2016 and 2015;
adjusted net income attributable to common shareholders and adjusted earnings per share (basic and diluted) (“adjusted EPS”) for the three and twelve-month periods ended December 31, 2020 and 2019; adjusted operating income and
adjusted operating ratio for our North American less-than-truckload business for the three and twelve-month periods ended December 31, 2020, 2019, 2018, 2017, 2016 and 2015; and net debt and net leverage as of December 31,
2020.

We believe that the above adjusted financial measures facilitate analysis of our ongoing business operations because they exclude items that may not be reflective of, or are unrelated to, XPO and its business segments' core operating
performance, and may assist investors with comparisons to prior periods and assessing trends in our underlying businesses. Other companies may calculate these non-GAAP financial measures differently, and therefore our measures
may not be comparable to similarly titled measures of other companies. These non-GAAP financial measures should only be used as supplemental measures of our operating performance.
Adjusted EBITDA, adjusted net income attributable to common shareholders and adjusted EPS include adjustments for transaction and integration, as well as restructuring costs and other adjustments as set forth in the attached tables.
Transaction and integration adjustments are generally incremental costs that result from an actual or planned acquisition, divestiture or spin-off and may include transaction costs, consulting fees, retention awards, and internal salaries
and wages (to the extent the individuals are assigned full-time to integration and transformation activities) and certain costs related to integrating and converging IT systems. Restructuring costs primarily relate to severance costs
associated with business optimization initiatives. Management uses these non-GAAP financial measures in making financial, operating and planning decisions and evaluating XPO's and each business segment's ongoing performance.

We believe that free cash flow is an important measure of our ability to repay maturing debt or fund other uses of capital that we believe will enhance stockholder value. We calculate free cash flow as adjusted net cash provided by
operating activities, less payment for purchases of property and equipment plus proceeds from sale of property and equipment, with adjusted net cash provided by operating activities defined as net cash provided by operating activities
plus cash collected on deferred purchase price receivables. We believe that EBITDA, adjusted EBITDA, adjusted EBITDA margin and adjusted EBITDA excluding truckload improve comparability from period to period by removing the
impact of our capital structure (interest and financing expenses), asset base (depreciation and amortization), tax impacts and other adjustments as set out in the attached tables that management has determined are not reflective of core
operating activities and thereby assist investors with assessing trends in our underlying businesses. We believe that adjusted net income attributable to common shareholders and adjusted EPS improve the comparability of our operating
results from period to period by removing the impact of certain costs and gains that management has determined are not reflective of our core operating activities. We believe that adjusted operating income and adjusted operating ratio
for our North American less-than-truckload business improve the comparability of our operating results from period to period by (i) removing the impact of certain transaction, integration and restructuring costs, amortization expenses as
well as real estate gains and (ii) including the impact of pension income incurred in the reporting period as set out in the attached tables. We believe that net debt and net leverage is an important measure of our overall liquidity position
and is calculated by removing cash and cash equivalents from our reported total debt and reporting net debt as a ratio of our last twelve-month reported adjusted EBITDA.

With respect to our full year 2021 financial targets for adjusted EBITDA, adjusted diluted EPS and free cash flow, a reconciliation of these non-GAAP measures to the corresponding GAAP measures is not available without unreasonable
effort due to the variability and complexity of the reconciling items described above that we exclude from these non-GAAP target measures. The variability of these items may have a significant impact on our future GAAP financial results
and, as a result, we are unable to prepare the forward-looking statement of income and statement of cash flows prepared in accordance with GAAP that would be required to produce such a reconciliation.

FORWARD-LOOKING STATEMENTS
This document includes forward-looking statements within the meaning of Section 27A of the Securities Act of 1933, as amended, and Section 21E of the Securities Exchange Act of 1934, as amended, including our future growth
prospects for EBITDA in our North American less-than-truckload business, our company's potential profit growth opportunity, our company’s full year 2021 financial targets for adjusted EBITDA, depreciation and amortization, interest
expense, effective tax rate, adjusted diluted EPS, gross capital expenditures, net capital expenditures and free cash flow, as well as our company’s planned spin-off of its logistics segment and its plan to pursue an investment-grade
credit rating. All statements other than statements of historical fact are, or may be deemed to be, forward-looking statements. In some cases, forward-looking statements can be identified by the use of forward-looking terms such as
"anticipate," "estimate," "believe," "continue," "could," "intend," "may," "plan," "potential," "predict," "should," "will," "expect," "objective," "projection," "forecast," "goal," "guidance," "outlook," "effort," "target," "trajectory" or the negative of
these terms or other comparable terms. However, the absence of these words does not mean that the statements are not forward-looking. These forward-looking statements are based on certain assumptions and analyses made by us in
light of our experience and our perception of historical trends, current conditions and expected future developments, as well as other factors we believe are appropriate in the circumstances.
These forward-looking statements are subject to known and unknown risks, uncertainties and assumptions that may cause actual results, levels of activity, performance or achievements to be materially different from any future results,
levels of activity, performance or achievements expressed or implied by such forward-looking statements. Factors that might cause or contribute to a material difference include the risks discussed in our filings with the SEC and the
following: economic conditions generally; the severity, magnitude, duration and aftereffects of the COVID-19 pandemic and government responses to the COVID-19 pandemic; our ability to align our investments in capital assets,
including equipment, service centers and warehouses, to our customers' demands; our ability to implement our cost and revenue initiatives; our ability to successfully integrate and realize anticipated synergies, cost savings and profit
improvement opportunities with respect to acquired companies; matters related to our intellectual property rights; fluctuations in currency exchange rates; fuel price and fuel surcharge changes; natural disasters, terrorist attacks or similar
incidents; risks and uncertainties regarding the potential timing and expected benefits of the proposed spin-off of our logistics segment, including final approval for the proposed spin-off and the risk that the spin-off may not be completed
on the terms or timeline currently contemplated, if at all; the impact of the proposed spin-off on the size and business diversity of our company; the ability of the proposed spin-off to qualify for tax-free treatment for U.S. federal income
tax purposes; our ability to develop and implement suitable information technology systems and prevent failures in or breaches of such systems; our substantial indebtedness; our ability to raise debt and equity capital; fluctuations in
fixed and floating interest rates; our ability to maintain positive relationships with our network of third-party transportation providers; our ability to attract and retain qualified drivers; labor matters, including our ability to manage our
subcontractors, and risks associated with labor disputes at our customers and efforts by labor organizations to organize our employees; litigation, including litigation related to alleged misclassification of independent contractors and
securities class actions; risks associated with our self-insured claims; risks associated with defined benefit plans for our current and former employees; and governmental regulation, including trade compliance laws, as well as changes in
international trade policies and tax regimes; governmental or political actions, including the United Kingdom's exit from the European Union; and competition and pricing pressures.
All forward-looking statements set forth in this deck are qualified by these cautionary statements and there can be no assurance that the actual results or developments anticipated by us will be realized or, even if substantially realized,
that they will have the expected consequences to or effects on us or our business or operations. Forward-looking statements set forth in this deck speak only as of the date hereof, and we do not undertake any obligation to update
forward-looking statements to reflect subsequent events or circumstances, changes in expectations or the occurrence of unanticipated events, except to the extent required by law.
I NVESTOR PRESENTATI ON FEBRUARY 2021                                                                                                                                                                                                                         2
Table of contents

                                        INVESTOR HIGHLIGHTS                    4

                                        BUSINESS OVERVIEW                      5

                                        FINANCIAL HIGHLIGHTS AND KEY METRICS   11

                                        LOGISTICS                              19

                                        LESS-THAN-TRUCKLOAD                    27

                                        TRUCK BROKERAGE                        35

                                        SUPPLEMENTAL MATERIALS                 44

I NVESTOR PRESENTATI ON FEBRUARY 2021                                               3
Investor highlights: Key factors driving growth and returns

 Leading positions in fast-growing sectors      A leader in logistics, less-than-truckload (LTL) transportation and truck brokerage

 Numerous opportunities for top-line growth     Proven ability to capture organic share through price and volume, and expand through accretive M&A

 Strong presence in e-commerce and
                                                Largest outsourced e-commerce logistics platform in Europe, with expansive capabilities in North America
 omnichannel retail

 Fast pace of technological innovation          Proprietary technology for warehouse automation, LTL optimization and digital brokerage services

 Substantial advantages of scale                Mission-critical ability to serve large customers; operating leverage; data leverage; purchasing power

 Nimble capital allocation focused on returns   Strong track record of creating substantial shareholder value; disciplined, ROI-based capital allocation

 ~$700 million to $1 billion of potential
                                                XPO-specific cost and revenue initiatives underway, with the majority driven by proprietary technology
 incremental profit opportunity

 Ability to outperform the macro                Proven resilience due to durable demand in key verticals, flexible business models and low concentration risk

 Significant cash generation through cycles     Low maintenance capex; working capital becomes a source of cash in downturns

 Wide moat of results-oriented innovators       35 most senior executives and ~2,500 professionals at the next level with blue-chip industry experience

I NVESTOR PRESENTATI ON FEBRUARY 2021                                                                                                                           4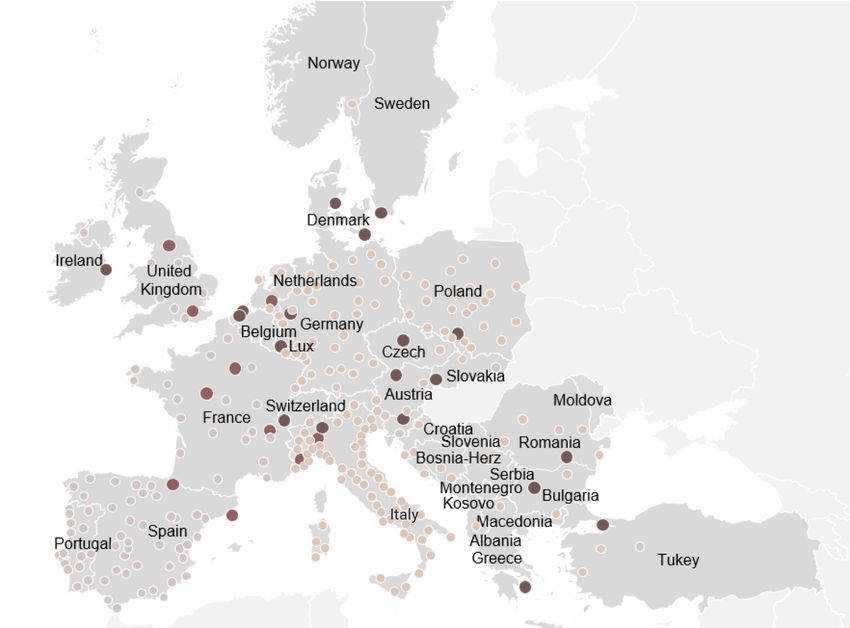
Business overview

I NVESTOR PRESENTATI ON FEBRUARY 2021
Serving over 50,000 customers in 30 countries

                                LOGISTICS SEGMENT                                                                   TRANSPORTATION SEGMENT
                                   38% OF 2020 REVENUE1                                                                   62% OF 2020 REVENUE1

XPO is the second largest contract logistics provider globally, with a                              XPO is a leading global provider of truck brokerage services and
leading e-commerce platform                                                                         less-than-truckload (LTL) transportation1

Revenue                                                                              $6.2 billion   Revenue                                                  $10.2 billion
Locations2                                                                                  890     Locations                                                        730
Countries of operation                                                                        27    Countries of operation                                             18
Employees2                                                                               ~67,000    Employees                                                    ~39,000

1   Company segment revenue data, excluding intersegment eliminations
2   Locations and employees adjusted to reflect the Kuehne + Nagel acquisition January 2021
I NVESTOR PRESENTATI ON FEBRUARY 2021                                                                                                                                        6
Key 2020 financial metrics

                         R E V E N U E B Y GE OGR A P H Y                                                                              R E V E N U E B Y MIX

                                      Other
                                                                                                                              Asset-Based
                                      12%
                                                                                                                                 29%
                      Spain
                       6%

                     UK
                    13%
                                                                             US
                                                                            58%

                       France                                                                                                                                  Asset-Light
                        11%                                                                                                                                       71%

                    REVENUE                                                    ADJUSTED EBITDA 1                                              FREE CASH FLOW 1

                   $16.3 billion                                                         $1.4 billion                                               $554 million

Refer to the “Non-GAAP Financial Measures” section on page 2 and the “Financial Highlights” section for related information

I NVESTOR PRESENTATI ON FEBRUARY 2021                                                                                                                                        7
~$500 million average annual investment in innovative supply chain technology

                                             KEY TECHNOLOGY BY SERVICE LINE

  LOGISTICS                                    LESS-THAN-TRUCKLOAD                      TRUCK BROKERAGE

  § Proprietary warehouse                      §   Network optimization tools           § Proprietary XPO Connect™
      management system manages all                improve LTL linehaul, pickup-          marketplace with machine learning
      distribution processes and                   and-delivery, and routing              drives end-to-end efficiency in
      warehouse operations                                                                brokered freight transactions
                                               §   Proprietary algorithms with
  § Provides in-house control of                   machine learning assimilate          § Fully automated platform integrates
      robotics and other advanced                  constant inflows of data               Freight Optimizer capacity
      automation                                                                          management engine
                                               §   Visibility facilitates selling LTL
  § Integrates transportation and                  across additional verticals          § Automates carrier matching to
      logistics services for retail,                                                      optimal loads
      e-commerce, omnichannel and              §   Improves the efficiency of cross-
      manufacturing customers using                dock operations with XPO             § Lowers environmental impact by
      XPO Direct™                                  Smart™ analytics                       reducing empty truck miles

  § Improves productivity in warehouse                                                  § Gives carriers access to
      operations by rightsizing labor                                                     XPO Connect™ from their trucks
      resources with XPO Smart™                                                           with Drive XPO™ app
      analytics

                          ~1,600 technology professionals focus on continuously improving results

I NVESTOR PRESENTATI ON FEBRUARY 2021                                                                                           8
XPO Connect™ is a powerful, digital ecosystem for freight management

                  C U S T OME R S                                                                      C A R R IE R S

       Shippers can:                                                                        Carriers can:
       § Post loads, receive quotes from                                                    § Search the platform’s load board
         carriers, create orders digitally,                                                   to find freight for trucks and book
         and track shipments in real time                                                     it digitally
       § Select the optimal capacity based             FREIGHT OPTIMIZER                    § Choose to accept the posted rate
         on load profile, preferences, price                                                  or bid and negotiate, using the
         and market conditions                                                                automated counteroffer feature
       § Customize analytics and reports                                                    § Drivers use the Drive XPO™ app
         to gain insights into the impact of                                                  from the road to find loads and
         decisions                                                                            backhauls, avoid delays and file
                                                                API                           e-documents

   INTELLIGENT BROKERAGE AUTOMATION CREATES VALUE IN REAL TIME

   §   Optimizes freight-matching by sourcing the best carriers for each load profile

   §   Expands revenue and margins with automated load-tendering, pricing, bidding, buying and tracking
   §   Improves freight management by providing deep visibility into available capacity

   §   Establishes the architecture for continuous innovation

   §   Creates operational synergies

I NVESTOR PRESENTATI ON FEBRUARY 2021                                                                                               9
XPO Smart™ improves productivity of warehouse and cross-dock operations

                                 TIME AND ATTENDANCE

                                                                 MACHINE LEARNING               ANALYTICS
                                  TRANSACTIONAL DATA

                                        IOT DATA
                                                                    MODELING                   FORECASTING

                             BECOMES CONTINUOUSLY SMARTER AT SITE-SPECIFIC OPTIMIZATION

                             §   Labor management and planning      §   Production management of inbound and
                             §   Attendance tracking                    outbound flows

                             §   Productivity tracking              §   Enhanced SKU velocity

                             §   Access on cloud applications,      §   Granular-level detail in a few clicks
                                 large-format displays, mobile
                                 devices and handhelds

I NVESTOR PRESENTATI ON FEBRUARY 2021                                                                           10
Financial highlights
and key metrics
I NVESTOR PRESENTATI ON FEBRUARY 2021Industry-leading growth in revenue and adjusted EBITDA
REVENUE A D J U S T E D E B IT D A
$ in millions $ in millions
20,000 7% 2,000
R: 1 1,725 –
CAG % 1,800
17,279 : 24
16,648 1,750 GR 1,668
16,252 CA
16,000 15,381 1,562
14,188 1,500
1,367 1,393
12,000 1,250 1,168
1,000
8,000 7,533
750
474
500
4,000
250
0 0
2015 2016 2017 2018 2019 2020 2015 2016 2017 2018 2019 2020 2021F
Note: Both charts exclude the impact of the North American truckload unit divested in October 2016
Refer to the “Non-GAAP Financial Measures” section on page 2 of this document
I NVESTOR PRESENTATI ON FEBRUARY 2021 12Strong free cash flow generation
F R E E C A S H F L OW
%
R : 26
$ in millions 21 CAG
6-20
201
750 600 – 700
694
628
625
554
500
399
375
250 207
125
0
-125
-125 (98)
2015 2016 2017 2018 2019 2020 2021F
Note: 2016 and 2017 data have been recast to reflect the impact of Accounting Standards Update 2016-2018
Refer to the “Non-GAAP Financial Measures” section on page 2 of this document
I NVESTOR PRESENTATI ON FEBRUARY 2021 13Balance sheet and liquidity as of December 31, 2020
Recent activities
NET DEBT 1 $4.7 billion § The company redeemed $1.2 billion of Senior Notes due
2022 in January 2021
CASH AND CASH § No significant debt maturities until mid-2023
EQUIVALENTS $2.1 billion
§ Substantially all convertible preferred stock converted into
common stock in December 2020
NET LEVERAGE 2 3.3x
TOTAL LIQUIDITY $3.1 billion
1Calculated as total debt of $6.7 billion less cash and cash equivalents of $2.1 billion
2Calculated as net debt of $4.7 billion divided by LTM adjusted EBITDA of $1.4 billion
Refer to the “Non-GAAP Financial Measures” section on page 2 of this document
I NVESTOR PRESENTATI ON FEBRUARY 2021 14Fourth quarter 2020 results
Three months ended December 31, 2020
Commentary
REVENUE $4.67 billion
§ The company reported record fourth quarter revenue and
adjusted EBITDA
NET INCOME 1 $93 million § Revenue increased 13% year-over-year, as demand
continued to rebound from COVID-impacted second
quarter lows
DILUTED EARNINGS
$0.91
PER SHARE § The increases in operating income and adjusted EBITDA
were related primarily to higher profitability in truck
brokerage and in LTL, with gains from LTL real estate
ADJUSTED NET INCOME 1 $121 million
sales excluded
ADJUSTED DILUTED
§ In North American LTL, fourth quarter adjusted operating
EARNINGS PER SHARE 2
$1.19 ratio, excluding real estate gains, strengthened for the
sixth consecutive year
ADJUSTED EBITDA $449 million
CASH FLOW FROM OPERATIONS $193 million
FREE CASH FLOW $91 million
1Net income attributable to common shareholders
2Includes amortization of acquisition-related intangible assets of $0.25 per diluted share
Refer to the “Non-GAAP Financial Measures” section on page 2 of this document
I NVESTOR PRESENTATI ON FEBRUARY 2021 15Full-year 2020 results
REVENUE $16.25 billion ADJUSTED DILUTED EPS 2 $2.01
NET INCOME 1 $79 million ADJUSTED EBITDA $1.39 billion
CASH FLOW FROM
DILUTED EPS $0.78 $885 million
OPERATIONS
ADJUSTED NET INCOME 1 $205 million FREE CASH FLOW $554 million
Rebounded dramatically from COVID and ended 2020 with the highest
adjusted EBITDA of any fourth quarter in the company’s history
1Net income attributable to common shareholders
2Includes amortization of acquisition-related intangible assets of $0.96 per diluted share
Refer to the “Non-GAAP Financial Measures” section on page 2 of this document
I NVESTOR PRESENTATI ON FEBRUARY 2021 16Full-year 2021 guidance
ADJUSTED EBITDA $1.725 – 1.8 billion Related to 2021 cash flows:
DEPRECIATION AND GROSS CAPITAL
$780 – 800 million $625 – 675 million
AMORITIZATION 1 EXPENDITURES
NET CAPITAL
INTEREST EXPENSE $275 – 285 million $475 – 525 million
EXPENDITURES
EFFECTIVE TAX RATE 24% – 26% FREE CASH FLOW $600 – 700 million
*ADJUSTED DILUTED EPS 2 $5.10 – 5.85
* The company will present adjusted net income and adjusted diluted EPS excluding the amortization of acquisition-related intangible assets,
starting with 2021 reporting.
The company’s 2021 guidance excludes impacts associated with the planned spin-off of the logistics segment previously announced; and assumes
113 million diluted shares outstanding.
1Excluding amortization of acquisition-related intangible assets
2Excludes amortization of acquisition-related intangible assets estimated to be $145 million in 2021
Refer to the “Non-GAAP Financial Measures” section on page 2 of this document
I NVESTOR PRESENTATI ON FEBRUARY 2021 17Potential profit growth opportunity of ~$700 million to $1 billion
IN IT IA T IV E S A S % OF T OT A L X P O-S P E C IF IC OP P OR T U N IT Y POOL OF COST
OPPORTUNITIES
§ XPO Smart™ optimization of
~$5 billion of variable labor cost
Pricing benefits § Greater efficiencies in LTL linehaul
20% and pickup-and-delivery spend
§ Continued logistics automation
§ European logistics margin expansion
Revenue § Global procurement savings
Cost initiatives initiatives
60% § Further back-office optimization
POOL OF REVENUE
New business OPPORTUNITIES
initiatives § Advanced pricing analytics and
20% revenue tools
§ XPO Connect™ digital freight
marketplace
XPO is executing on 10 profit initiatives that are all self-driven and largely independent
of the macro. In total, these initiatives represent a potential $700 million to $1 billion profit § XPO Direct™ shared distribution
improvement run rate in 2023. XPO made progress with these initiatives in 2020, in large network
part due to the company-specific benefits of its technology, despite a choppy operating § Focused selling to European
environment in the early months of the pandemic. strategic accounts
The profit improvement opportunity range provided above is expected to apply to current operations as follows:
~50% benefit to global logistics; ~30% benefit to North American LTL; and ~20% benefit to all other XPO will continue to analyze these and other
transportation lines. opportunities to ensure that resources are focused on
endeavors that potentially can return the most value.
I NVESTOR PRESENTATI ON FEBRUARY 2021 18Logistics I NVESTOR PRESENTATI ON FEBRUARY 2021
XPO is the second largest contract logistics provider globally

Logistics is an asset-light business characterized by long-
term contractual relationships with high renewal rates and low
cyclicality. It includes the management and distribution of
goods, order fulfillment, reverse logistics, and other services.
Industry size, North America and Europe: ~$130 billion1.

                                 X P O K E Y ME T R IC S 2

    Revenue                                                                      $6.2 billion

    Countries of operation                                                                   27

    Locations                                                                              890

    Employees                                                                        ~67,000

    Average contract length                                                         ~5 years

                                                                      ~212 million sq. ft.
    Total warehouse space
                                                                      (20 million sq. m.)

    – Capacity in Europe                                              ~103 million sq. ft.

    – Capacity in North America                                       ~101 million sq. ft.

    – Capacity in Asia                                                    ~8 million sq. ft.

1   Source: Third-party industry research; refers to contract logistics
2   Full-year 2020 revenue; all other metrics as of December 31, 2020, locations and employees adjusted to reflect the Kuehne + Nagel acquisition January 2021

I NVESTOR PRESENTATI ON FEBRUARY 2021                                                                                                                            20
XPO has decades of vertical expertise and prominent customers
TOP % 2020
DEEP EXPERTISE
VERTICALS REVENUE
39%
E-commerce / § Comprehensive B2C services, including warehousing, distribution, advanced automation, labor,
retail inventory management, peak management and forecasting
13%
Food and § Frozen, refrigerated and dry storage; fulfillment for retail, hospitality and direct-to-consumer
beverage supply chains with stringent regulatory compliance, and recalls management
13%
Consumer § Replicable solutions for consistent results across national and multinational consumer markets,
packaged goods including e-commerce, reverse logistics and omnichannel fulfillment
11%
Consumer § Direct-to-consumer and retail fulfillment and returns management of consumer electronics and
technology other devices for manufacturers
In 2020, XPO’s top four verticals accounted for 76% of global logistics revenue, and the
vast majority of logistics revenue was derived from the US, UK, France and Spain
I NVESTOR PRESENTATI ON FEBRUARY 2021 21Known as a global leader in innovation, expertise and quality of performance
Strongly positioned with blue-chip § XPO’s reputation for reliable outcomes resonates with customers seeking to de-risk supply chains
customers requiring bespoke solutions § Expansive capacity and scale, with best-in-class ability to manage tight labor markets
Proprietary technology excels at § Strong focus on cost management, rightsizing labor, solving loss-makers and peak management
agility, visibility, speed, accuracy
and control § Proprietary XPO Smart™ tools leverage machine learning to improve productivity
Major provider of e-commerce and § Largest outsourced e-fulfilment platform in Europe, with expansive capabilities in North America
omnichannel logistics § Rigorous returns management is highly valued by retailers and e-tailers
XPO Direct™ utilizes existing § Customers use XPO’s AI to flex inventory while avoiding large fixed costs and capital investments
North American network for shared
distribution § Sites positioned to serve 99% of US population through one-day and two-day ground delivery
§ Proven track records in consumer technology, omnichannel retail, aerospace and defense, consumer
Large opportunity to grow share in
packaged goods, apparel, cosmetics, food retail, cold-chain and industrial, with a growing presence in
established specializations
healthcare
Significant levers for profitable growth § Sales strategy is geared toward consumer sector: customer wallet share and new accounts
and strong free cash flow § Long runway for margin expansion via XPO Smart™ , advanced automation and robotics
I NVESTOR PRESENTATI ON FEBRUARY 2021 22Sophisticated capabilities are mission-critical for customers
ADVANCED AUTOMATION REVERSE LOGISTICS AND SUPPLY CHAIN VALUE-ADD SERVICES
AND ROBOTICS AFTERMARKET SUPPORT OPTIMIZATION AND CUSTOMIZATIONS
§ Technology-enabled § Burgeoning demand § Cross-functional § Personalization during
fulfillment and returns, for reverse logistics, valued forecasting platform order fulfillment
continuously improved by by e-commerce companies
AI and machine learning and retailers with high § Customer collaboration for § Channel-specific boxing
consumer expectations speed-to-market and and labeling
§ Significant increases in omnichannel strategies
unit throughput § Full lifecycle management § Co-packing of similar
of returned merchandise, § Ability to shift between goods for distribution cost
§ Enhanced safety and including return-to-retail, short and long-term efficiency
workplace environment recycling or disposal warehousing for cost
flexibility § Compliance monitoring of
§ Ongoing robotics § Consistently reliable regulated goods
implementations planned aftermarket distribution § Optimization of outbound
in North America and and inbound logistics flows § Manufacturing support
with rigorous inventory
Europe management § Automated replenishment § Carrier management
of materials and parts § Engineered packaging
I NVESTOR PRESENTATI ON FEBRUARY 2021 23Intelligent warehouse automation generates measurable improvements
ROBOTICS GOODS-TO-PERSON ADVANCED SORTATION VISION TECHNOLOGY
SYSTEMS SYSTEMS
§ First-mover advantage with advanced automation strongly differentiates XPO as a logistics partner of choice
§ Automation increases speed and accuracy by tying in multiple technologies to perform several steps of a process
§ Robotics work cooperatively with humans or as standalone solutions
§ Collaborative robots and autonomous goods-to-person systems overcome space and labor constraints, can move between
projects and sites
4-6x productivity improvement with employees supported by goods-to-person systems
2x productivity improvement with employees who work alongside cobots
I NVESTOR PRESENTATI ON FEBRUARY 2021 24XPO Smart™ is delivering average logistics productivity improvement of 5% to 7%
Proprietary suite of productivity tools optimizes
~$5 billion variable labor cost, which is primarily
in logistics
§ Analytics provide deep visibility into warehouse labor
activity in real time, as well as pre-scheduled labor for
future periods
§ Machine learning drives productivity and operational
effectiveness through actionable business intelligence
§ Manages major productivity levers simultaneously,
including: full-time labor, part-time labor, length of work
shift, scheduling and overtime hours
§ Site-specific modeling helps managers understand the
future impacts of operational decisions
§ Takes turnover and training time into account
Implemented in 85% of warehouses in North America and 50% of warehouses
in Europe, with large upside going forward
I NVESTOR PRESENTATI ON FEBRUARY 2021 25XPO Direct™ flexible distribution network in North America
XPO Direct™ is a national distribution solution that gives customers fluid fulfillment with more flexibility than
traditional distribution models, and at lower cost:
§ Reduces fixed costs and large capital investments by sharing warehouses, logistics processes, labor and technology with
other XPO customers;
§ Reduces goods-in-transit time by repositioning inventory close to target populations as demand patterns change.
A D V A N T A GE S F OR C U S T OME R S A D V A N T A GE S F OR X P O
§ Retailers, e-tailers and manufacturers have access to logistics § Strongly differentiates XPO from other logistics providers in the
scale, expertise and technology without adding high-fixed-cost marketplace
distribution centers
§ Increases utilization of existing warehouses and other
§ Shortens time from consumer order to delivery, and reduces resources
response time for retail stocking and store replenishment
§ Leverages XPO’s transportation and logistics solutions in
§ Cutting-edge technology in place for ease of doing business at combination:
both ends; predictive analytics help plan inventory flows
– Facilities serve as strategically located stockholding sites and
§ Customers can reposition inventory within one and two-day cross-docks that can be utilized by multiple customers at the
ground delivery range of ~99% of the US population as same time
demand patterns change – Transportation needs are supported by the company’s
brokered, contracted and owned capacity
§ Service agility enhances brands
XPO Direct™ is achieving profitability in second full year of operations
I NVESTOR PRESENTATI ON FEBRUARY 2021 26Less-than-truckload I NVESTOR PRESENTATI ON FEBRUARY 2021
XPO is a top three provider of less-than-truckload (LTL) service in North America

LTL is the transportation of a quantity of freight that is larger than
a parcel but too small to require an entire truck, often shipped on
pallets. Freight for different customers are consolidated in the
same trailer. North American industry size: ~$43 billion1.

                               X P O K E Y ME T R IC S 2

    Revenue                                                                  $3.5 billion

    Employees                                                                    ~20,000

    Terminals                                                                         290

    Number of tractors / trailers                                      ~7,800 / 25,000

    Shipments per year                                                     ~12.4 million

    Average length of haul                                                     826 miles
                                                                                            XPO IMAGE THAT ILLUSTRATES
    Average tractor fleet age                                                  4.8 years
                                                                                                   LTL SERVICE

1   Source: Third-party research
2   Full-year 2020 revenue and shipments per year; other metrics as of December 31, 2020

I NVESTOR PRESENTATI ON FEBRUARY 2021                                                                                    28
290 LTL terminals provide critical coverage and lane density
Many large customers prefer a single LTL partner for national service
I NVESTOR PRESENTATI ON FEBRUARY 2021 29North American LTL has a well-defined opportunity to grow EBITDA
to at least $1 billion in 2022
Fundamentals favorable for long- § Industry characterized by rational pricing dynamics
term industry expansion § Rapid growth of e-commerce driving retail shipments to LTL carriers
National providers have a strong § XPO is one of few US providers with coast-to-coast scale and visibility
advantage § Covers every US state, including Alaska and Hawaii, and ~99% of all US postal codes
Further profit improvement § Technology optimizes linehaul load-building, pickup-and-delivery and routing
potential via tech in place § XPO Smart™ tools drive process improvements, cost savings and labor productivity
Data-driven pricing reduces cost § Technology automates pricing for small to mid-sized accounts
and improves utilization § Elasticity models help inform pricing decisions for larger accounts
Substantial improvement every year § Second best adjusted operating ratio in the LTL industry
since acquisition, with more upside § Resilient cash flow generation through diligent working capital and capex management
In 2020, XPO improved Q4 LTL adjusted operating ratio, excluding
real estate gains, for the sixth straight year
I NVESTOR PRESENTATI ON FEBRUARY 2021 30Compelling value proposition differentiated by scale and technology
§ One of the largest, most modern and
N OR T H A ME R IC A N L T L P R OV ID E R S 2
safety-equipped fleets in industry
Critical capacity, § ~12,000 professional drivers $ in millions
density and scale1
§ All types of commodities accepted
FedEx Freight 7,454
§ Over 75,000 next-day and two-day lanes
Old Dominion
4,055
Freight Line
§ Data-driven capabilities with machine learning,
3,841
proprietary to XPO
§ Driving up productivity beyond the significant
Intelligent technology YRC Freight 3,049
gains already made
§ XPO analytics tailor business intelligence for Estes Express
2,818
customers Lines
UPS Freight 2,679
§ Over 30 years’ experience in LTL ABF Freight
2,094
§ Single source for customers with delivery
System
needs in multiple markets
SAIA LTL 1,787
Strong relationships § Longstanding relationships for shipments to Freight
and from Mexico, Puerto Rico, Canada
R + L Carriers 1,718
§ Responsive operators committed to superior
outcomes Southeastern
1,242
Freight Lines
1 As of December 31, 2020
2 2019 revenue data includes fuel surcharge; source: SJ Consulting Group
I NVESTOR PRESENTATI ON FEBRUARY 2021 31LTL network optimization technology prioritizes three key areas
R OU T IN G L OA D -B U IL D IN G P R IC IN G
Dynamic routing and real-time Automated load-building and Data-driven pricing for network
digital visibility higher trailer utilization balancing
§ Increases pickup-and-delivery § Continually optimizes linehaul § Provides real-time cost visibility at
pounds per person-hour, stops per network the shipment level
hour and weight per trip
§ Improves trailer utilization with real- § Reduces costs, improves utilization
§ Reduces pickup-and-delivery miles time compliance monitoring and decreases empty miles
per stop and cost per stop
§ Reduces multiple stops for trucks § Speeds onboarding of more
§ Improves service levels by dedicated to direct movements profitable small to mid-sized local
sequencing routes for better accounts
control of delivery times and
exception management
XPO’s technology uses machine learning to become continually
smarter at improving operations
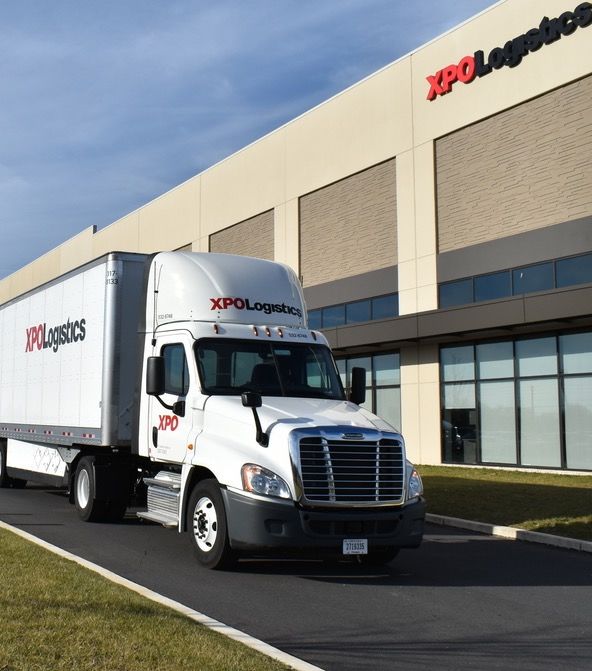
I NVESTOR PRESENTATI ON FEBRUARY 2021 32XPO Smart™ delivers significant labor and service efficiencies on cross-docks
Rightsizes all components of LTL labor mix
§ Real-time visibility drives more motor moves per hour on
cross-docks, with high engagement of dock workers and
drivers
§ Manages major productivity levers simultaneously,
including: full-time labor, part-time labor, length of work
shift, scheduling and overtime hours
§ Analytics provide deep visibility into cross-dock labor
activity in real time, as well as pre-scheduled labor for
future periods
§ Site-specific modeling helps managers understand the
future impacts of operational decisions
§ Takes turnover and training time into account
XPO IMAGE – IINSIDE OF LTL
TRAILER
Implemented in 100% of North American LTL network, with significant productivity
enhancements expected when fully utilized
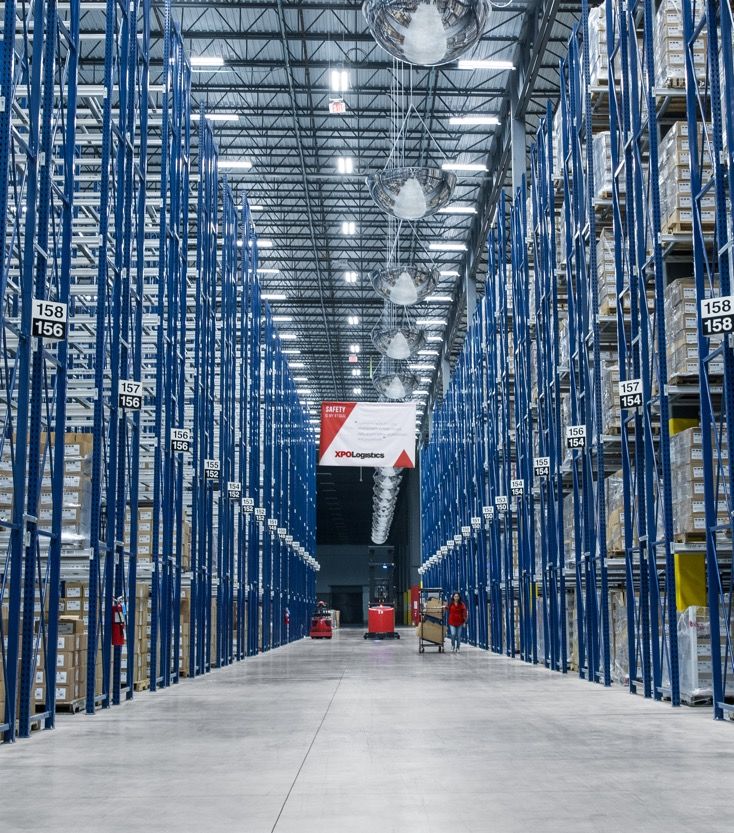
I NVESTOR PRESENTATI ON FEBRUARY 2021 33A leading LTL provider in the UK, France, Spain and Portugal
§ Over 100 LTL locations serving XPO international hub
countries across Europe Partner international hub
§ Optimal operating model used for XPO platform
each national market: contracted Partner platform
capacity, owned capacity or
blended capacity
§ Ability to transport freight from a
single pallet to full truckload
§ ~60,000 pallets delivered daily
over domestic networks
§ ~9,800 pallets delivered daily over
international networks
Pan-European LTL solutions are valued by multinational customers
I NVESTOR PRESENTATI ON FEBRUARY 2021 34Truck brokerage I NVESTOR PRESENTATI ON FEBRUARY 2021
XPO is the third largest truck brokerage provider in North America

Truck brokerage is a non-asset business that facilitates the
movement of a quantity of freight requiring a full truckload,
typically from a single shipper. A broker purchases truck
capacity from independent carriers. North American industry
size: ~$360 billion1.

                                X P O K E Y ME T R IC S 2

     Revenue                                                                  $1.66 billion

     Locations                                                                              16

     Employees                                                                       ~1,000

                                                             ~58,000 North America
     Independent carriers
                                                                   ~75,000 globally

     Core carriers                                                                   ~3,200

     Accessible trucks                                                  Over 1,000,000

1   Source: Third-party research; total truckload industry size, including brokerage component
2   Full-year 2020 revenue; other metrics as of December 31, 2020

I NVESTOR PRESENTATI ON FEBRUARY 2021                                                            36
Brokerage revenue diversified across resilient verticals, low concentration risk
2 0 2 0 R E V E N U E B Y E N D -MA R K E T 2 0 2 0 R E V E N U E B Y C U S T OME R S
Other
Agriculture and 11% Customer 1
Chemicals Retail and 9%
4% E-commerce
23% Customers 2-5
10%
Automotive
5%
Customers 6-10
Consumer
8%
Goods
5%
Food and
Logistics and beverage Customers 11-20
Transportation 21% Others 11%
12% 62%
Industrial and
Manufacturing
19%
Strategic focus on expanding share of e-commerce and consumer goods
I NVESTOR PRESENTATI ON FEBRUARY 2021 37XPO’s brokerage growth continues to outpace the industry
T R U C K B R OK E R S H A V E A L ON G H IS T OR Y OF P E N E T R A T IN G T H E F R E IGH T IN D U S T R Y
US truck brokerage penetration
21%
20%
.5% 19%
CAGR: 6
17%
16%
14% 14%
13%
12% 12%
11% 11%
10% 10% 10%
9%
8%
7% 7% 7%
6%
2000A
2001A
2002A
2003A
2004A
2005A
2006A
2007A
2008A
2009A
2010A
2011A
2012A
2013A
2014A
2015A
2016A
2017A
2018A
2019A
2020E
XPO’s 16.3% revenue CAGR from 2013 – 2019 was ~770 bps better than industry’s
Source: Third-party industry research
I NVESTOR PRESENTATI ON FEBRUARY 2021 38Compelling value proposition underpins long track record of outperformance
§ #3 broker in North America and #2 worldwide
Critical scale and capacity
§ A transportation leader across UK, France, Spain, Portugal and Morocco
§ Acceleration of outsourcing to brokers; robust demand from consumer verticals
Secular industry tailwinds
§ Growth of industry-leading last mile offering driven heavy goods e-commerce
§ Agile, non-asset business model generates strong return on investment
Nimble business model
§ Strong operating leverage and modest capex requirements
§ Long-tenured base of Tier 1 customer relationships, with low concentration
Durable commercial edge
§ Blue-chip brands are highly referenceable in key verticals
§ XPO Connect™ excels at efficiency through automation; rapid ongoing adoption
Proprietary digital advantage
§ Investments in digitization and visibility have created clear differentiation
§ Driven by pricing optimization, digital productivity, disciplined sales/margin growth
Double-digit EBITDA growth
§ Outsized free cash flow conversion to EBITDA
XPO is continuing to grow share of a vast addressable opportunity
I NVESTOR PRESENTATI ON FEBRUARY 2021 39Large potential runway for margin expansion
T E C H N OL OGY -D R IV E N MU L T IP L E P R OF IT IN IT IA T IV E S U N D E R WA Y
§ Significant opportunity to unlock incremental revenue and profit well beyond current
Expand XPO Connect™ levels
§ Value of XPO Connect™ will compound in response to rapid adoption
§ Utilize XPO’s market pricing and contract utilization tools to capture higher-margin
Pricing optimization opportunities
§ Tailor sales strategies for Tier 1, 2 and 3 customers
§ Build on productivity gains already achieved to realize further sustainable uplifts to
Operational excellence margin
§ Continuously improve efficiency and drive down labor costs through automation
I NVESTOR PRESENTATI ON FEBRUARY 2021 40XPO Connect™ generates efficiencies for all stakeholders
D IGIT A L B R OK E R A GE P L A T F OR M IS F L E X IB L E A N D C U S T OMIZ A B L E
CUSTOMER CARRIER PERSONALIZED FREIGHT TAILORED CAPACITY
FUNCTIONALITY FUNCTIONALITY MANAGEMENT MANAGEMENT
§ Quote and buy different § Post available capacity § Customize personal § Analyze trends in spot
kinds of truck capacity based on preferences dashboard and self- rates, driving
online through a single for freight type and service analytics to conditions and other
point of access other parameters manage freight factors that impact
bids on loads
§ Leverage analytics for § Book loads on the web § Enhance productivity
decision-making, or via the Drive XPO™ of spend with direct § Locate opportunities
planning and peak mobile app access to data histories based on location,
management and KPIs equipment specs,
§ Optimize equipment freight type and timing
§ Gain real-time visibility utilization and driver’s § Tailor screen displays to of loads
of shipments in transit use of time match business needs
I NVESTOR PRESENTATI ON FEBRUARY 2021 41Truck drivers have downloaded the Drive XPO™ app over 300,000 times
§ Proprietary mobile app gives drivers access to the XPO Connect™ platform from the road
§ Fully automated transactions, tracking solution and intuitive tools for bidding, booking loads and more
§ Enhances access to truckload capacity for XPO customers regardless of market conditions
FREIGHT CARRIER SCORE
CAPACITY POSTING LOAD BOOKING
MANAGEMENT AND REWARDS
I NVESTOR PRESENTATI ON FEBRUARY 2021 42XPO Connect™ is widely adopted and growing fast
CARRIERS
350,000 Total Drive XPO app downloads 90,000 Total registered carrier users
80,000
300,000
70,000
250,000
60,000
200,000 50,000
150,000 40,000
30,000
100,000
20,000
50,000
10,000
0 0
Q1 2019 Q2 2019 Q3 2019 Q4 2019 Q1 2020 Q2 2020 Q3 2020 Q4 2020 Q1 2019 Q2 2019 Q3 2019 Q4 2019 Q1 2020 Q2 2020 Q3 2020 Q4 2020
CUSTOMERS
1,400,000 6,000
Total digital brokerage orders Total registered customer users
1,200,000 5,000
1,000,000
4,000
800,000
3,000
600,000
2,000
400,000
200,000 1,000
0 0
Q1 2019 Q2 2019 Q3 2019 Q4 2019 Q1 2020 Q2 2020 Q3 2020 Q4 2020 Q1 2019 Q2 2019 Q3 2019 Q4 2019 Q1 2020 Q2 2020 Q3 2020 Q4 2020
Note: All data is cumulative
I NVESTOR PRESENTATI ON FEBRUARY 2021 43Supplemental
materials
I NVESTOR PRESENTATI ON FEBRUARY 2021Planned spin-off of the logistics segment In December 2020, XPO announced its plan to pursue a spin-off of its logistics segment as a separate, publicly traded company. The intended transaction would be generally tax-free for US federal income tax purposes to XPO shareholders, and would result in XPO shareholders owning stock in both companies. Additionally, the company plans to achieve an investment-grade rating. If completed as planned, the spin-off will create two pure-play industry powerhouses with clearly delineated service offerings: § The spun-off company will be the second largest contract logistics provider in the world; and § The remaining company will be a global provider of less-than-truckload (LTL) and truck brokerage services. The transaction is currently expected to be completed in the second half of 2021, subject to various conditions, including the effectiveness of a Form 10 registration statement, receipt of a tax opinion from counsel, the refinancing of XPO’s debt on terms satisfactory to the XPO board of directors, and final approval by the XPO board of directors. There can be no assurance that a separation transaction will occur or, if one does occur, of its terms or timing. The company’s 2021 guidance excludes impacts associated with the planned spin-off of the logistics segment. I NVESTOR PRESENTATI ON FEBRUARY 2021 45
COVID-19 pandemic response

XPO is continuing to use a combination of rigorous protective measures, technology and virtual communications to keep its
employees safe. These are some of the many actions the company has taken as part of its COVID-19 response:

§    For employees who need to work on site, XPO follows the guidance of the World Health Organization, the US Centers for
     Disease Control, local regulators and the company’s own health and safety protocols.

§    Personal protective equipment is provided to employees in all company workplaces, and social distancing is in effect.

§    Our facilities engage in ongoing cleaning of high-touch areas, as well as deep cleaning of facilities likely to have been
     exposed to COVID-19.

§    The company added two weeks of 100% paid pandemic sick leave for US and Canadian employees, in addition to existing
     paid time off.

§    Employees are guaranteed up to three additional paid days if their facility closes temporarily for deep cleaning.

§    We instituted a contactless delivery policy to ensure that our drivers can maintain a safe distance from customers when
     delivering freight.

§    We expanded access to mental health counseling services.

For its customers and carriers, XPO added an electronic COVID-19 dashboard to its XPO Connect™ digital freight platform.
The dashboard serves as an access point for alerts in North America and Europe issued by states, provinces, countries and
major infrastructure sources, such as municipalities and airports.

I NVESTOR PRESENTATI ON FEBRUARY 2021                                                                                            46
Highly skilled management team
L EA D ER SH IP PR IOR EXPER IEN C E
Brad Jacobs
United Rentals, United Waste
Chief Executive Officer
Aroon Amarnani
TIAA, Barclays Capital
Vice President, Strategy
Josephine Berisha
Morgan Stanley
Chief Human Resources Officer
Tony Brooks
Sysco, PepsiCo, Roadway
President, Less-Than-Truckload – North America
Erik Caldwell
Hudson's Bay, Luxottica
President, Last Mile Logistics
Richard Cawston
Norbert Dentressangle, Asda
Managing Director, Supply Chain – Europe
Ashfaque Chowdhury
New Breed
President, Supply Chain – Americas and Asia Pacific
Troy Cooper
United Rentals, United Waste
President
Matthew Fassler
Goldman Sachs
Chief Strategy Officer
Luis-Angel Gómez Izaguirre
Norbert Dentressangle
Managing Director, Transport – Europe
Maryclaire Hammond
BP, Honeywell
Senior Vice President, Human Resources
Mario Harik
Oakleaf Waste Management
Chief Information Officer
Tavio Headley
Jefferies, American Trucking Associations
Vice President, Investor Relations
Note: Partial list in alphabetical order
I NVESTOR PRESENTATI ON FEBRUARY 2021 47Highly skilled management team (cont.)
L EA D ER SH IP PR IOR EXPER IEN C E
LaQuenta Jacobs
Delta Air Lines, Home Depot, Turner Broadcasting
Chief Diversity Officer
Katrina Liddell
Johnson Controls International
President, Global Forwarding and Expedite
Eduardo Pelleissone
Kraft Heinz, America Latina Logistica
Chief Transformation Officer
Heidi Ratti
Pacer International
Senior Vice President, Human Resources
Alex Santoro
Anheuser-Bush InBev, America Latina Logistica, Popeyes
Chief Commercial Officer and Executive Vice President, Operations
Sandeep Sakharkar
Foot Locker, Johnson & Johnson
Senior Vice President, Supply Chain
Kevin Sterling
Seaport Global Securities, BB&T
Vice President, Strategy
Ravi Tulsyan
ADT, Tyco, PepsiCo
Senior Vice President and Treasurer
Drew Wilkerson
C.H. Robinson
President, Transportation – North America
Malcolm Wilson
Norbert Dentressangle, NYK Logistics
Chief Executive Officer, XPO Logistics Europe
Kyle Wismans
Baker Hughes, General Electric
Senior Vice President, Financial Planning and Analysis
Stacey Woods
Time Warner Cable, Wells Fargo
Senior Vice President, Human Resources Operations
David Wyshner
Wyndham, Avis, Merrill Lynch
Chief Financial Officer
Note: Partial list in alphabetical order
I NVESTOR PRESENTATI ON FEBRUARY 2021 48Business glossary
XPO SERVICES
§ Less-than-truckload (LTL): LTL is the transportation of a quantity of freight that is larger than a parcel but too small to require an
entire truck, and is often shipped on a pallet. LTL shipments are priced according to the weight of the freight, its commodity class
(generally determined by cube/weight ratio and type of product), and mileage within designated lanes. An LTL carrier typically operates
a hub-and-spoke network that allows for the consolidation of multiple shipments for different customers in single trucks. XPO is the
third largest LTL provider in North America, with 290 terminals and over 75,000 next-day and two-day lanes. This network provides
customers with geographic density and day-definite regional, inter-regional and transcontinental LTL freight services, including cross-
border US service to and from Mexico and Canada, and intra-Canada service. The company also has one of the largest LTL networks
in Western Europe, using a blended model of owned and contracted capacity to provide customers with domestic and pan-European
solutions,
§ Logistics: Logistics is an asset-light business characterized by long-term contractual relationships with high renewal rates and low
cyclicality. Contracts are typically structured as either fixed-variable, cost-plus or gain-share. XPO is the second largest contract
logistics provider in the world, with long-tenured customer relationships in diverse verticals, and customized solutions with high-value-
add components, such as advanced automation, that minimize commoditization. The company’s services include e-commerce
fulfillment, reverse logistics, value-added warehousing and distribution, order personalization, cold-chain logistics, packaging and
labeling, aftermarket support, inventory management and supply chain optimization for customers in aerospace, manufacturing, retail,
life sciences, chemicals, food and beverage and cold-chain.
Reverse logistics, also known as returns management, is a fast-growing area of logistics that refers to managing the flow of returned
goods back through logistics facilities ⏤ typically unwanted or defective merchandise. The demand for returns management has
increased dramatically along with e-commerce sales, as consumers often “test drive” products they buy online. Reverse logistics
services can include cleaning, testing, inspection, refurbishment, restocking, warranty processing and refunding.
§ Truck brokerage: Truck brokerage is a variable-cost business that facilitates the trucking of freight by procuring carriers through the
use of proprietary technology, typically referred to as a TMS (transportation management system). Brokerage net revenue is the
spread between the price to the shipper and the cost of purchased transportation. The vast majority of truck brokerage shipments are
full truckload: cargo is provided by a single shipper in an amount that requires the full limit of the trailer, either by dimension or weight.
XPO is the second largest freight broker globally and the third largest in North America. The company matches shippers’ loads with
third-party carrier capacity ⏤ primarily provided by independent contractors with the ability to interact directly on the company’s
proprietary XPO Connect™ digital platform (see next page). Truck brokers have steadily increased their share of the for-hire trucking
market throughout cycles, and shippers increasingly value automation, making digital truck brokerage one of the strongest trends in
the transportation industry.
I NVESTOR PRESENTATI ON FEBRUARY 2021 49Business glossary (cont.)
XPO TECHNOLOGY
§ XPO Connect™: XPO’s proprietary, fully automated, self-learning digital freight marketplace connects shippers and carriers directly,
as well as through company operations. XPO Connect™ gives shippers comprehensive visibility into current market conditions,
including fluctuations in capacity, spot rates by geography and digital negotiating through an automated counteroffer feature. Carriers
can post available truck capacity and bid on loads, and shippers can tender loads and track their freight in real time. Drivers use the
Drive XPO™ app for mobile access to XPO Connect™ from the road. The app also serves as a geo-locator and supports voice-to-text
communications. The cloud-based XPO Connect™ platform is deployed in North America and Europe.
§ XPO Direct™: XPO’s national, shared-space distribution network gives retail, e-commerce, omnichannel and manufacturing
customers new ways to distribute their goods. XPO Direct™ warehouses serve as stockholding sites and cross-docks that can be
utilized by multiple customers at the same time. B2C and B2B customers “rent” XPO’s logistics capacity, labor, technology,
transportation and storage to reposition inventories fluidly across markets as demand fluctuates without the capital investment of
adding distribution centers. The XPO Direct™ network uses XPO’s existing assets and supplier relationships as growth levers,
capturing incremental business by positioning customer inventories within one or two-day ground delivery of approximately 99% of the
US population.
§ XPO Smart™: XPO’s proprietary, intelligent optimization tools improve labor productivity, warehouse management and demand
forecasting in the company’s logistics and transportation operations. In the company’s logistics business, XPO Smart™ interfaces with
the XPO’s proprietary warehouse management platform to forecast optimal labor levels day-by-day and shift-by-shift, showing the
future impact of current decisions. In the transportation business, XPO Smart™ is utilized in the company’s less-than-truckload
operations to improve cross-dock productivity at LTL network terminals.
I NVESTOR PRESENTATI ON FEBRUARY 2021 50You can also read