Is the Magnesium Content in Food Supplements Consistent with the Manufacturers' Declarations?
←
→
Page content transcription
If your browser does not render page correctly, please read the page content below
nutrients
Article
Is the Magnesium Content in Food Supplements Consistent
with the Manufacturers’ Declarations?
Anna Puścion-Jakubik *,† , Natalia Bartosiewicz † and Katarzyna Socha

                                          Department of Bromatology, Faculty of Pharmacy with the Division of Laboratory Medicine, Medical University
                                          of Białystok, Mickiewicza 2D Street, 15-222 Białystok, Poland; natalia_bartosiewicz@wp.pl (N.B.);
                                          katarzyna.socha@umb.edu.pl (K.S.)
                                          * Correspondence: anna.puscion-jakubik@umb.edu.pl; Tel.: +48-8574-854-69
                                          † These authors contributed equally to this work.

                                          Abstract: Food supplements (FS) are gaining more and more popularity because they are a quick
                                          way to compensate for deficiencies in the diet. Due to their affordable price and easy-to-take form,
                                          they are eaten by all age groups and by healthy and sick people. There are many categories of this
                                          type of preparations on the market, and FS with magnesium (Mg) are some of the most commonly
                                          used. Therefore, the aim of the study was to determine the Mg content in FS and to compare the
                                          estimated value with that declared by the manufacturer. The study included 116 FS containing
                                          Mg. In order to determine the Mg content, the atomic absorption spectrometry (AAS) method was
                                          used. The tested FS were divided in terms of the declared content, pharmaceutical form, chemical
                                          form of Mg, composition complexity, and price. It was shown that in the case of 58.7% of the
                                          samples, the Mg content was different than the permissible tolerance limits set by the Polish chief

                                          sanitary inspectorate, which range from −20% to +45%. It has been estimated that as a result of the
                                   differences in the content, the patient may take up to 304% more Mg per day or 98% less than it is
Citation: Puścion-Jakubik, A.;           stated in the declaration. The above results indicate that the quality and safety of FS should be more
Bartosiewicz, N.; Socha, K. Is the        closely monitored.
Magnesium Content in Food
Supplements Consistent with the           Keywords: magnesium; pharmacy; food supplements; drugstore
Manufacturers’ Declarations? Nutrients
2021, 13, 3416. https://doi.org/
10.3390/nu13103416

                                          1. Introduction
Academic Editor: Lutz Schomburg
                                                Food supplements (FS) are preparations that are intended to supplement the diet with
                                          deficient substances. They contain minerals, vitamins, and other substances that can cause
Received: 12 September 2021
Accepted: 25 September 2021
                                          a specific physiological effect, such as fatty acids, amino acids, or probiotics. They come in
Published: 28 September 2021
                                          various pharmaceutical forms, including tablets, capsules, powders, and ampoules. They
                                          do not contain medicinal substances, so they cannot be used to treat disease entities [1].
Publisher’s Note: MDPI stays neutral
                                                Minerals and vitamins that may be used in FS in Poland are listed in the Regulation
with regard to jurisdictional claims in
                                          of the Minister of Health of 17 September 2018. The minimum amount of vitamins and
published maps and institutional affil-   minerals in a daily portion in FS should not be less than 15% of the reference consumption
iations.                                  values. However, maximum acceptable levels are established on the basis of the upper safe
                                          levels of consumption, the amounts provided in the diet, and the recommended intake for
                                          the population. This value must be safe for the health and life of the consumer [2].
                                                FS are very common, and their popularity and market share are steadily increasing.
                                          Data from 2019 indicate that more than half of adults, both in Europe and the US, use
Copyright: © 2021 by the authors.
Licensee MDPI, Basel, Switzerland.
                                          FS [3]. According to research by Li et al. (2010), these are more often women than men
This article is an open access article
                                          (38.6% vs. 28.5%), as well as people over 50 (57.4%) and with higher education [4]. This
distributed under the terms and           is a consequence of the increased demand for nutrients in these groups. Despite the fact
conditions of the Creative Commons        that FS cannot replace a balanced diet, their intake allows them to supplement existing
Attribution (CC BY) license (https://     deficiencies. In the elderly, it is particularly important because physiological changes in
creativecommons.org/licenses/by/          the body with age and long-term use of many medications make seniors most exposed to
4.0/).                                    nutrient deficiencies.

Nutrients 2021, 13, 3416. https://doi.org/10.3390/nu13103416                                              https://www.mdpi.com/journal/nutrients
Nutrients 2021, 13, 3416                                                                                             2 of 10

                                 Our previous research has shown that the use of FS is very widespread. Supple-
                           ments containing magnesium (Mg) are used by approximately 8% of medical university
                           students [5]. Other data from Poland indicate that FS with Mg account for 7.56% of the
                           market. Preparations with this ingredient are very popular in Poland—about 25.0% of
                           respondents use them. Among the inhabitants of Spain, 13.4% of men take them and
                           among the inhabitants of Germany 18.3% of men and 20.4% of women [6].
                                 The legal regulations governing the FS market in Poland are both national and Eu-
                           ropean requirements. An important legal act is the Food and Nutrition Safety Act of
                           25 August 2006 [1], Regulation of the Minister of Health of 18 May 2010 amending the
                           regulation on the composition and labeling of FS [7] and the Regulation of the Minister of
                           Health of 17 September 2018, on the composition and labeling of FS [2]. The Regulation
                           of the Minister of Health of 17 September 2018 [2] lists vitamins and minerals and their
                           chemical forms that may be present in supplements. For substances authorized to appear
                           in supplements, which were listed in the above regulation [2], further purity criteria are
                           defined. Dyes and additives should meet the purity requirements specified in Commission
                           Regulation (EU) No 231/2012 of 9 March 2012 [8]. Despite the above-mentioned legal
                           acts being in force, the registration procedures and placing the FS on the market are very
                           simple and only require presentation documentation and packaging design to the chief
                           sanitary inspector. No quality or safety tests are required, which creates a risk that there
                           are low-quality preparations on the market that differ in terms of their composition from
                           the manufacturers’ declarations.
                                 Mg is necessary, inter alia, to maintain normal cell function, muscle contraction,
                           including the heart muscle, and conditions nervous excitability [9,10]. Mg deficiency has
                           also been shown to contribute to the development of oxidative stress in obese people [11],
                           disturbances in mineral homeostasis such as Mg may interfere with cancer progression [12],
                           and Mg supplementation may play a beneficial role in controlling asthma by acting as an
                           anti-inflammatory and bronchodilator [13].
                                 The causes of Mg deficiency include: reduced gastrointestinal absorption, loss of Mg
                           from gastrointestinal tract, increased renal loss, excessive sweating, increased requirements
                           (for example in pregnancy), or older age, which disrupts many processes [14].
                                 The above factors prompted us to evaluate the Mg content in FS available on the Polish
                           market, coming from local producers, but also producers known in various European
                           countries. To our knowledge, this is the first study that covers such data as a variety of
                           chemical forms, pharmaceutical forms or preparations at different prices.

                           2. Materials and Methods
                           2.1. Materials
                                 Samples of dietary supplements were selected on the basis of previously conducted
                            surveys [5] and on the basis of popularity in the largest chain pharmacies in the country.
                                 Inclusion criteria included: popularity among patients, availability category ‘FS’,
                           preparations within the expiry date.
                                 The following exclusion criteria were adopted: occasional sales, over-the-counter
                           ‘OTC’ availability category.
                                 The study included 116 FS purchased in stationary pharmacies as well as online. In
                            order to assess the quality of FS in the best possible way, preparations were selected for
                            the research, which differed in terms of composition, pharmaceutical form, price and,
                            manufacturer. Detailed characteristics of the studied FS are presented in Table S1 in
                            Supplementary Materials.
                                 FS were taken from three different blisters or as three subsamples, analyzed in triplicate
                           (statistically insignificant differences between the determinations) were harvested and
                            tested in 2020–2021.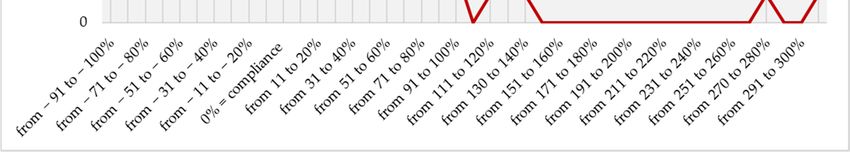
Nutrients 2021, 13, 3416                                                                                              3 of 10

                           2.2. Sample Preparation
                                FS were ground in a vibrating grinder (Testchem, Poland) and weighed into Teflon
                           mineralization vessels of about 0.3 g with an accuracy of 1 mg (exact weights were recorded).
                           Then 4 mL of spectrally pure concentrated (69%) nitric acid (Tracepur, Merck, Darmstadt,
                           Germany) were added. The microwave mineralization process was carried out in a closed
                           system (Berghof, Speedwave, Eningen, Germany), according to the following program:
                           •    Step 1:   170 ◦ C, 10 min, 20 atm., 80% of microwave power;
                           •    Step 2:   190 ◦ C, 10 min, 30 atm., 90% of microwave power;
                           •    Step 3:   210 ◦ C, 10 min, 40 atm., 90% of microwave power;
                           •    Step 4:   50 ◦ C, 18 min, 40 atm., 0% of microwave power.
                                The obtained mineralizates were quantitatively transferred to polypropylene vessels
                           with deionized water.

                           2.3. Determination of Mg Content
                                Mg content was determined by atomic absorption spectrometry (AAS), acetylene-air
                           flame technique with Zeeman background correction. The determination was carried
                           out using the Z-2000 instrument (Hitachi, Tokyo, Japan). Before the analysis, all of the
                           analyzed samples were diluted, depending on the declared content of the tested element.
                           Lanthanum chloride (1% LaCl3 , Sigma-Aldrich, Merck, Darmstadt, Germany) was used as
                           the sequestering agent. The assay was performed at a wavelength of 285.2 nm and 7.5 mA
                           current lamps. The concentration was read from the curve prepared using a 1 mg/mL Mg
                           standard solution for AAS (Merck, Germany). The limit of detection (LOD) and limit of
                           quantification (LOQ) were 0.26 mg/kg and 0.78 mg/kg, respectively.
                                The conducted research did not require the approval of the Bioethics Committee of
                           the Medical University of Bialystok.

                           2.4. Validation of Method
                                In order to control the accuracy of the analyses, a certified reference material was
                           used (Simulated Died D, LIVSMEDELS VERKET, National Food Administration, Uppsala,
                           Sweden). The determination was performed before the analysis and after each 10 determi-
                           nations. All values were within the certified value range (2740–3100 mg/kg). The accuracy
                           (% of error) was 0.67%, and the coefficient of variation V = 1.57%.

                           2.5. Comparison of Results with the Standards Adopted by the Chief Sanitary Inspectorate
                           in Poland
                                In accordance with the guidelines adopted by the European Commission in 2012 on
                           establishing tolerance limits for minerals contained on labels, the obtained values were
                           compared with the guidelines adopted by the Commission, amounting to −20 to +45% for
                           FS-containing minerals [15,16].

                           2.6. Statistical Analyses
                                Statistica software (Tibco, Palo-Alto, CA, USA) was used for calculations and statistical
                           analyzes. The results are presented as mean (Av.) with standard deviation (SD), minimum
                           (Min), maximum (Max), as well as median (Med.), and lower quartile (Q1), upper quartile
                           (Q3), interquartile range (IQR).

                           3. Results
                                The results of the analyses are presented in Tables 1–5. The following classification
                           criteria were used: declared content, pharmaceutical form, chemical form of Mg, amount
                           of minerals (only Mg or multi-component preparations), and price.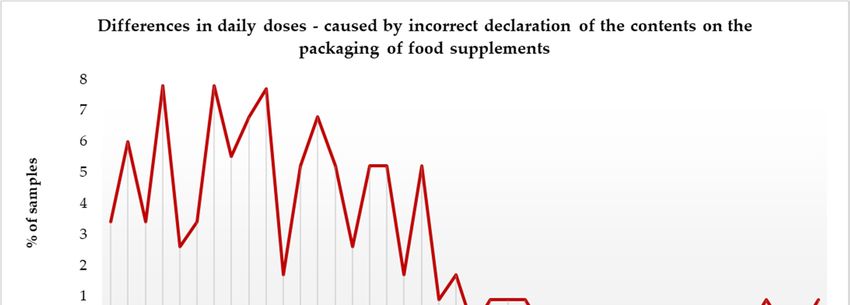
Nutrients 2021, 13, 3416                                                                                                                         4 of 10

                           Table 1. Magnesium content (mg/portion) in food supplements depending on the declared magne-
                           sium content.

                                                                                        Mg Content (mg/Portion)
                             Declared Content         n
                                                                    Av. ± SD           Min–Max          Med.            Q1            Q3         IQR
                              Less than 100 mg       49             49.7 ± 38.0         1.5–202.0        40.7           23.7          73.4       49.7
                                100–200 mg           45            144.9 ± 109.5        7.4–469.6       115.7           66.3         207.2      141.0
                               Above 200 mg          22            387.0 ± 200.2       39.1–795.7       348.7          249.2         479.2      230.0
                           Av.—average, IQR—interquartile range, Max—maximum value, Med.—median, Min—minimum value, Q1—lower
                           quartile, Q3—upper quartile, SD—standard deviation.

                           Table 2. Magnesium content (mg/portion) in food supplements depending on the pharmaceutical form.

                                                                                       Mg Content (mg/Portion)
                                   Form              n
                                                                   Av. ± SD            Min–Max          Med.            Q1            Q3         IQR
                                 Capsules            13       103.8 ± 110.0             1.5–298.5        69.2          22.8          193.0      170.2
                               Coated tablets        11        68.5 ± 60.4             19.0–202.0        48.0          23.7           77.5       53.8
                                  Dragees             2        78.3 ± 22.7              62.2–94.3        78.3          62.2           94.3       32.1
                            Effervescent tablets     24       231.2 ± 196.0             4.9–696.9       168.2          78.6          364.2      285.6
                                Granulates            1        233.1 ± 0.0                  -             -             -              -          -
                                Jelly beans           1         27.5 ± 0.0                  -             -             -              -          -
                                  Liquids             7       198.4 ± 120.6            34.0–360.1       219.7          75.4          317.6      242.2
                                 Powders             12       264.2 ± 247.2            22.1–795.7       189.1          81.2          367.4      286.2
                                  Tablets            45       106.8± 133.6             5.8–696.5        60.2           31.4          120.8      89.4
                           Av.—average, IQR—interquartile range, Max—maximum value, Med.—median, Min—minimum value, Q1—lower
                           quartile, Q3—upper quartile, SD—standard deviation.

                           Table 3. Magnesium content (mg/portion) in food supplements depending on the chemical form.

                                                                                            Mg Content (mg/Portion)
                                   Chemical Form              n
                                                                           Av. ± SD          Min–Max            Med.          Q1       Q3        IQR
                              Magnesium bisglycinate           6       161.4 ± 103.1         28.5–317.6         154.3         93.8     219.7     126.0
                               Magnesium carbonate            34       132.2 ± 164.2          5.8–696.9          73.9         40.7     137.8      97.1
                                Magnesium citrate             35       168.4 ± 201.1         1.5–795.7          79.1          31.5     232.0     200.6
                            Magnesium glycerophosphate        1         78.8 ± 0.0                -               -             -        -         -
                              Magnesium hydroxide              2       215.6 ± 263.8         29.1–402.1         215.6         29.1     402.1     373.0
                                Magnesium lactate             11        45.7 ± 39.4           1.8–129.3          35.4          7.4     77.9       70.5
                                Magnesium oxide                8       207.6 ± 155.5         18.8–449.4         225.6         52.9     317.9     265.1
                              Several chemical forms          19       181.2 ± 148.1         22.8–479.2         145.4         61.2     267.6     206.4
                           Av.—average, IQR—interquartile range, Max—maximum value, Med.—median, Min—minimum value, Q1—lower
                           quartile, Q3—upper quartile, SD—standard deviation.

                           Table 4. Magnesium content (mg/portion) in food supplements depending on the amount of minerals.

                                                                                              Mg Content (mg/Portion)
                                  Amount of Minerals                   n
                                                                                Av. ± SD         Min–Max               Med. Q1             Q3     IQR
                            Only magnesium (or vitamin B6)            75      164.8 ± 183.6         1.5–795.7          93.8     34.0 249.2 215.3
                             Multicomponent preparations              41      124.7 ± 125.6         4.8–469.6          76.4     38.5 188.8 150.2
                           Av.—average, IQR—interquartile range, Max—maximum value, Med.—median, Min—minimum value, Q1—lower
                           quartile, Q3—upper quartile, SD—standard deviation.

                           Table 5. Magnesium content in food supplements depending on the price.

                                                                                      Mg Content (mg/Portion)
                             Price (PLN)         n
                                                           Av. ± SD            Min–Max         Med.             Q1              Q3              IQR
                                 20          18          178.4 ± 164.2        22.8–649.8      113.1            71.5           267.6            196.1
                           Av.—average, IQR—interquartile range, Max—maximum value, Med.—median, Min—minimum value, PLN—
                           currency in force in Poland, Q1—lower quartile, Q3—upper quartile, SD—standard deviation.
Nutrients 2021, 13, 3416 5 of 10
In the case of preparations with a declared content below 100 mg of Mg per portion,
the highest determined content was 202.0 mg, and the lowest was only 1.5 mg (Table 1).
The second criterion of the division was the criterion of the pharmaceutical form.
The formulation with the highest reported content (795.7 mg/portion) was available as a
powder to be dissolved in water. The lowest marked values were for supplements available
in the form of capsules (1.5 mg/portion), effervescent tablets (4.9 mg/portion), and tablets
(5.8 mg/portion).
Most of the studied FS contained Mg in the form of Mg citrate (n = 35) and Mg carbon-
ate (n = 34), while the least contained in the form of hydroxide (n = 2) and glycerophosphate
(n = 1). Both the preparation with the lowest determined content of Mg (1.5 mg/portion)
and the preparation with the highest determined content (795.7 mg/portion) contained
Mg citrate (Table 3).
Out of 116 FS tested, 75 contained only Mg among the minerals. This category includes
both the preparation with the lowest determined value (1.5 mg) and the preparation with
the highest determined mg content (795.7 mg) (Table 4).
Interestingly, in preparations with a lower price (below PLN 10), the highest mean Mg
content was recorded at the level of 192.1 ± 191.1 (Table 5).
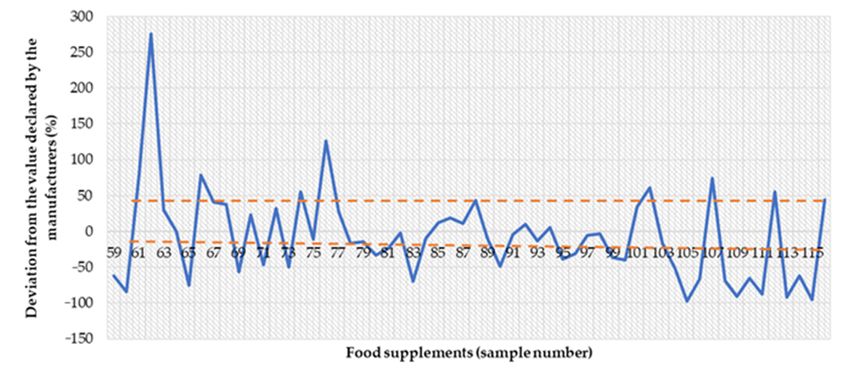
The chief sanitary inspectorate, responsible for the quality of FS, allows
Nutrients 2021, 13, x FOR PEER REVIEW
the deviation
6 of 11
of minerals from −20% to +45%. Figure 1 shows the variation in individual samples. It
was shown that 58.7% of FS were outside the acceptable range (Figure 1a,b).
(a)
(b)
Figure 1. The discrepancy between the declared magnesium content and that determined in dietary supplements (a) sam-
Figure 1. The discrepancy
ples between
of food supplements the1 to
from declared magnesium
58, (b) samples content andfrom
of food supplements that59determined
to 116. in dietary supplements (a) samples
of food supplements from 1 to 58, (b) samples of food supplements from 59 to 116.
At a further stage, we also assessed by how many percent the expected value by con-
sumers would differ from the actual value consumed, in accordance with the manufac-
turer’s recommendation, because the tested FS can be taken in amounts greater than just
one portion per day. It has been shown that for 54.1% of FS, consumers will consume a
lower amount of Mg. For example, for 3.4% it will be 90–100% less than the expected
value. Worryingly, in the case of one of the studied FS, consumers, using one portion ofNutrients 2021, 13, 3416 6 of 10
At a further stage, we also assessed by how many percent the expected value by
consumers would differ from the actual value consumed, in accordance with the manu-
facturer’s recommendation, because the tested FS can be taken in amounts greater than
just one portion per day. It has been shown that for 54.1% of FS, consumers will consume
a lower amount of Mg. For example, for 3.4% it will be 90–100% less than the expected
value. Worryingly, in the case of one of the studied FS, consumers, using one portion of
the FS each day, will consume as much as 300% more Mg than indicated on the7 ofpackaging
Nutrients 2021, 13, x FOR PEER REVIEW 11
(Figure 2).
lower doses higher doses
Figure 2. The percentage of food supplements and the difference in the actually taken magnesium dose, resulting from an
Figure 2. The percentage of food supplements and the difference in the actually taken magnesium dose, resulting from an
incorrect declaration of the content.
incorrect declaration of the content.
There were no statistically significant differences (p > 0.05) between the previously
There were
discussed no(declaration
factors statistically
of significant
Mg content, differences (p >form,
pharmaceutical 0.05)chemical
between thecom-
form, previously
discussed
position, price) and the percentage of samples within the norm, below and above the norm compo-
factors (declaration of Mg content, pharmaceutical form, chemical form,
sition, price)
(Table 6). and the percentage of samples within the norm, below and above the norm
(Table 6).
Table 6. Relationship between factors and percentage of food supplements with normal, below and above normal mag-
Table 6.nesium levels (p between
Relationship > 0.05). factors and percentage of food supplements with normal, below and above normal magne-
sium levels (p > 0.05). Below Standard Norm Above Normal
Criterion Subgroups n
n = 46 (%) n = 48 (%) n = 22 (%)
Below Standard Norm Above Normal
Criterion
Declared con- Subgroups n
Less than 100 mg 49 n = 46 (%)
19 (16.4) n = 48 (%)
24 (20.7) 6 (5.2)n = 22 (%)
tent
Declared content Less than 100
100–200 mgmg 4549 19 (16.4)
20 (17.2) 24 (20.7)
15 (12.9) 10 (8.6) 6 (5.2)
Above 200mg
100–200 mg 2245 7 (6.0) (17.2)
20 9 (7.6) (12.9)
15 6 (5.2) 10 (8.6)
Above 200 mg 22 7 (6.0) 9 (7.6) 6 (5.2)
Form Capsules 13 9 (7.8) 3 (2.6) 1 (0.9)
Form Capsules
Coated tablets 1113 5 (4.3)9 (7.8) 5 (4.3) 3 (2.6) 1 (0.9) 1 (0.9)
Coated tablets
Dragees 2 11 0 (0.0) (4.3)
5 2 (1.7) 5 (4.3) 0 (0.0) 1 (0.9)
Dragees
Effervescent tablets 24 2 0 (0.0)
5 (4.3) 12 (10.3)2 (1.7) 7 (6.0) 0 (0.0)
Effervescent
Granulates tablets 1 24 0 (0.0)5 (4.3) 0 (0.0)12 (10.3) 1 (0.9) 7 (6.0)
Granulates 1 0 (0.0) 0 (0.0) 1 (0.9)
Jelly beans 1 0 (0.0) 1 (0.9) 0 (0.0)
Jelly beans 1 0 (0.0) 1 (0.9) 0 (0.0)
Liquids 7 3 (2.6) 3 (2.6) 1 (0.9)
Liquids 7 3 (2.6) 3 (2.6) 1 (0.9)
Powders
Powders 1212 3 (2.6)
3 (2.6) 4 (3.4) 4 (3.4) 5 (4.3) 5 (4.3)
Tablets
Tablets 4545 21 (18.1)
21 (18.1) 18 (15.5)
18 (15.5) 6 (5.2) 6 (5.2)
Chemical form Magnesium bisglycinate 6 2 (1.7) 3 (2.6) 1 (0.9)
Magnesium carbonate 34 11 (9.5) 15 (12.9) 8 (6.9)
Magnesium citrate 35 16 (13.8) 12 (10.3) 7 (6.0)Nutrients 2021, 13, 3416 7 of 10
Table 6. Cont.
Below Standard Norm Above Normal
Criterion Subgroups n
n = 46 (%) n = 48 (%) n = 22 (%)
Chemical form Magnesium bisglycinate 6 2 (1.7) 3 (2.6) 1 (0.9)
Magnesium carbonate 34 11 (9.5) 15 (12.9) 8 (6.9)
Magnesium citrate 35 16 (13.8) 12 (10.3) 7 (6.0)
Magnesium glycerophosphate 1 0 (0.0) 1 (0.9) 0 (0.0)
Magnesium hydroxide 2 1 (0.9) 0 (0.0) 1 (0.9)
Magnesium lactate 11 6 (5.2) 5 (4.3) 0 (0.0)
Magnesium oxide 8 3 (2.6) 4 (3.4) 1 (0.9)
Several chemical forms 19 7 (6.0) 8 (6.9) 4 (3.4)
Amount of Only magnesium (or vitamin B6) 75 35 (30.2) 25 (21.6)) 15 (12.9
minerals Multicomponent preparations 41 11 (9.5) 23 (19.8) 7 (6.0)
Price (PLN) 20 18 5 (4.3) 9 (7.8) 4 (3.4)
4. Discussion
FS are foodstuffs taken by patients and consumers to supplement existing deficiencies.
Their use is not intended to treat or prevent diseases in humans, unlike drugs, and are
not required to be subject to detailed qualitative and quantitative research prior to sale,
unlike medicinal products. Moreover, their side effects are not monitored rigorously. This
generates the need to test their quality. Our research covered more than 100 FS, which may
reflect the assortment of the largest pharmacy chains.
As part of the study conducted by the SW RESEARCH agency (2017), a survey was
conducted among 807 adults. It was estimated that 72.4% of Poles use FS, and about half
of them systematically, i.e., 48%. Worrying is the fact that only 17% consult a doctor or
pharmacist before starting supplementation. The most common reasons for taking these
preparations were the desire to strengthen the body (55.4%), increase resistance to infections
(44.3%), and supplement the daily diet with the missing ingredients (40.7%). Alarmingly,
6% of people argued taking supplements is the current fashion. The respondents declared
that during the purchase they were guided by the composition (41.7%), price (38%), their
own experience (36.6%), the recommendation of a doctor or pharmacist (34.5%), opinions
of other people (25.9%), scientific certificates (16.9%) and other factors (27.7%). Satisfactory
is the fact that the most frequent place of purchase was the pharmacy (65%). According to
54.9% of people, taking supplements brought them noticeable benefits, while 41.6% did not
notice an effect on their health, while 3.4% were dissatisfied with the effects. In this study,
more frequent use of supplements by women (51.7%) than men (48.3%) was observed, as
well as among people with higher education (45.5%) [17].
Mg, next to potassium, is the most important intracellular cation. It activates over
300 enzymes. It participates, among others, in neuromuscular conduction, regulation of
the body’s mineral homeostasis, regulation of blood pressure, insulin metabolism, and
muscle contractility. It is a macronutrient necessary for proper functioning, therefore it
should be supplied with a balanced diet. A number of factors, including the consumption
of highly processed food, contribute to its reduced amount in the diet [18].
It is disturbing that if one of the tested FS is consumed, the patient will be take in
300% more Mg every day than it is stated in the declaration on the packaging. Taking
too much of a dose may have side effects. There is no evidence that food-derived Mg can
have a negative effect on the body, while in the case of excessive consumption of Mg from
various types of supplements or medicinal products, cases of harmful effects have been
reported. Since Mg salts are laxative when used in large amounts, osmotic diarrhea may
occur. Symptoms also include difficulty breathing, sleep disturbances, changes in heartbeat,
muscle weakness and confusion. In extreme cases, when it is accompanied by impaired
renal function, serious neurological symptoms may occur, such as, among others, increasedNutrients 2021, 13, 3416 8 of 10
axonal excitability threshold, paralysis of the striated and cardiological muscles, including
inhibition of heart contractions or prolongation of the QT interval [19]. Serious side effects,
including death, were found after children took 2400 mg of Mg, which is three servings
of the supplement with the highest content determined in this study [20]. The maximum
amount of Mg allowed in FS is 400 mg/day [21], while our study showed almost twice as
much Mg in one of the preparations.
The subject of comparing the declared and determined Mg content has so far been
rarely discussed in scientific publications. Literature data indicate that the interest of
researchers in FS containing Mg is also focused on assessing the safety of their use, due to
the presence of potential contaminants [22,23].
It seems necessary to conduct patient education and large-scale campaigns. A
2014 study showed that every fourth Pole was unable to correctly define the definition of a
FS. Almost half of the people, as many as 41%, claimed that these products have healing
properties, while 31% of people assessed that they were synonymous with vitamins, and
8% that they were synonymous with minerals. Moreover, half of the respondents (50%)
believed that they were subject to the same control as drugs [24].
The presence of a large amount of FS on the market makes their control very diffi-
cult. As a result of the easy registration process, more and more of them appear on the
market. Data from Poland show that from 2007 to 2017, over 29,000 were entered into
the register of products in the FS category. In 2016, the chief sanitary inspector received
about 600 notifications about the introduction of a new preparation on the market every
month [6]. This indicates the need to introduce greater restrictions, preventing the placing
on the market of preparation of inappropriate quality.
Ensuring an adequate level of Mg in the body is essential for its proper functioning.
The benefits of using it have been reported even in diseases of various pathogenesis, e.g.,
ulceration [25]. As a result of taking FS of inadequate quality, containing several times the
lower doses of Mg than declared by the manufacturer, supplementing the deficiencies may
be ineffective, which may result in the lack of the effects expected by patients.
The absorption of Mg is greater from food than from supplements [26–29]. Therefore
it is necessary to properly balance the diet so that taking these preparations will not be
necessary. However, when it is impossible or when there is an increased demand for this
element as a result of other factors, supplementation with high-quality preparations should
be used [30,31]. A diet deficient in terms of Mg is quite common. For example, a 2009 study
assessed eating habits among people living in Russia, the Czech Republic and Poland.
Consumption in line with the recommendations of the standards was shown only in about
65% of the respondents. The highest consumption of this element was among Poles, who
consumed 286 mg. Czechs supplied 278 mg and Russians only 97 mg [32].
Such a large discrepancy between the declared values and those actually marked is
very surprising. It may result from the improper production process of FS, lack of final
product control, and inadequate labeling of the supplement. FS are sold in grocery stores,
drugstores, herbal, and medical stores and pharmacies. It seems necessary that FS sold
in pharmacies should be subject to greater control, which will improve their quality and
increase consumer confidence in this category of food products, sold in a form analogous
to drugs.
The limitations of this study are as follows: due to the heterogeneity of FS quality,
other batches may have a different Mg content, the study describes the most popular
preparations on the market, although the quality of FS produced by niche producers
may be different. The limitation is also the large market share of preparations in one
pharmaceutical and chemical form. Further research should be based on the assessment of
the bioavailability of various Mg compounds and the actual concentration obtained in the
blood of patients after FS ingestion.Nutrients 2021, 13, 3416 9 of 10
5. Conclusions
The assessment of the quality of food containing magnesium showed that the declared
and actual values in most dietary supplements differed. Only in two samples of the
supplements were they identical. Only 41.3% of the tested samples were within the
acceptable range of deviations for minerals, in line with the recommendations of the chief
sanitary inspectorate. During the intake of food supplements covered by this study by
patients, as a result of differences between the declared value and the measured value, the
amount of the consumed element may change in the amount from a maximum of 98% less
to 304% more than the declared value. Food supplements should be routinely monitored
to improve their quality.
Supplementary Materials: The following are available online at https://www.mdpi.com/article/10.3
390/nu13103416/s1, Table S1: Characteristics of the studied dietary supplements.
Author Contributions: Conceptualization, A.P.-J.; methodology, K.S., A.P.-J. and N.B.; software,
A.P.-J., N.B. and K.S.; validation, K.S. and A.P.-J.; formal analysis, A.P.-J.; investigation, A.P.-J. and
K.S.; resources, A.P.-J. and K.S.; data curation, N.B. and A.P.-J.; writing—original draft preparation,
A.P.-J. and N.B.; writing—review and editing, K.S.; visualization, A.P.-J. and N.B.; supervision, K.S.;
project administration, A.P.-J.; funding acquisition, A.P.-J. All authors have read and agreed to the
published version of the manuscript.
Funding: This research was funded by Medical University of Białystok, grant number SUB/2/
DN/21/005/2216.
Institutional Review Board Statement: Not applicable.
Informed Consent Statement: Not applicable.
Data Availability Statement: Data are available from the authors.
Conflicts of Interest: The authors declare no conflict of interest.
References and Note
1. The Act of 25 August 2006 on Food and Nutrition Safety. Journal of Laws 2006 No. 171 Item 1225, 25 August 2006. (In Polish)
2. Announcement of the Minister of Health of 17 September 2018 on the Publication of the Uniform Text of the Regulation of the
Minister of Health on the Composition and Labeling of Dietary Supplements. Journal of Laws 2018 Item 1951, 17 September 2018.
(In Polish)
3. Costa, J.G.; Vidovic, B.; Saraiva, N.; do Céu Costa, M.; Del Favero, G.; Marko, D.; Oliveira, N.G.; Fernandes, A.S. Contaminants: A
dark side of food supplements? Free Radic. Res. 2019, 53 (Suppl. S1), 1113–1135. [CrossRef] [PubMed]
4. Li, K.; Kaaks, R.; Linseisen, J.; Rohrmann, S. Consistency of vitamin and/or mineral supplement use and demographic, lifestyle
and health-status predictors: Findings from the European Prospective Investigation into Cancer and Nutrition (EPIC)-Heidelberg
cohort. Br. J. Nutr. 2010, 10, 1058–1064. [CrossRef] [PubMed]
5. Puścion-Jakubik, A.; Kus, K.; Socha, K. Medical university students’ perspective on marketing of dietary supplements. Acta Pol.
Pharm. 2021, 78, 205–218. [CrossRef]
6. Suplindex. Available online: https://suplindex.com/wp-content/uploads/2017/10/RAPORT-Suplementy-diety-30.08.2017.pdf
(accessed on 10 September 2021).
7. Regulation of the Minister of Health of 18 May 2010 Amending the Regulation on the Composition and Labeling of Dietary
Supplements. Journal of Laws of 2010 No. 91, Item 596, 18 May 2010. (In Polish)
8. Commission Regulation (EU) No 231/2012 of 9 March 2012 Laying down Specifications for Food Additives Listed in Annexes II
and III to Regulation (EC) No 1333/2008 of the European Parliament and of the Council Text with EEA Relevance.
9. Nielsen, F.H. Dietary magnesium and chronić disease. Adv. Chronic. Kidney Dis. 2018, 25, 230–235. [CrossRef] [PubMed]
10. Van Laecke, S.; Caluwe, R.; Huybrechts, I.; Nagler, E.V.; Vanholder, R.; Peeters, P.; Van Vlem, B.; Van Biesen, W. Effect of
magnesium supplements on insulin secretion after kidney transplantation: A randomized controlled trial. Ann. Transplant. 2017,
22, 524–531. [CrossRef] [PubMed]
11. Morais, J.B.; Severo, J.S.; Santos, L.R.; de Sousa Melo, S.R.; de Oliveira Santos, R.; de Oliveira, A.R.; Cruz, K.J.; do Nascimento
Marreiro, D. Role of magnesium in oxidative stress in individuals with obesity. Biol. Trace Elem. Res. 2017, 176, 20–26. [CrossRef]
[PubMed]
12. Mendes, P.M.V.; Bezerra, D.L.C.; Dos Santos, L.R.; de Oliveira Santos, R.; de Sousa Melo, S.R.; Morais, J.B.S.; Severo, J.S.; Vieira,
S.C.; do Nascimento Marreiro, D. Magnesium in breast cancer: What is its influence on the progression of this disease? Biol. Trace
Elem. Res. 2018, 184, 334–339. [CrossRef] [PubMed]Nutrients 2021, 13, 3416 10 of 10
13. Abuabat, F.; AlAlwan, A.; Masuadi, E.; Murad, M.H.; Jahdali, H.A.; Ferwana, M.S. The role of oral magnesium supplements for
the management of stable bronchial asthma: A systematic review and meta-analysis. NPJ Prim. Care Respir. Med. 2019, 29, 4.
[CrossRef] [PubMed]
14. Schwalfenberg, G.K.; Genius, S.J. The importance of magnesium in clinical healthcare. Hidawi Sci. 2017, 2017, 4179326. [CrossRef]
[PubMed]
15. European Commission; Directorate-General for Health and Consumers. December 2012 Guidance on Setting Tolerance
Limits for Labeled Nutrients. Komisja Europejska, Dyrekcja generalna ds. Zdrowia i Konsumentów. Wytyczne z Grud-
nia 2012 r. w Zakresie Określenia Limitów Tolerancji Dla Składników Odżywczych Wymienionych na Etykiecie. Available
online: https://foodsupplementseurope.org/wp-content/themes/fse-theme/documents/publications-and-guidelines/fse-
setting-of-tolerances-for-nutrient-values-declared-on-a-label.pdf (accessed on 1 September 2021).
16. Wawrzyniak, A.; Przybyłowicz, K.; Wadołowska,
˛ L.; Charzewska, J.; Górecka, D.; Lange, E.; Other Members of the Human
Nutrition Science Committee of the Polish Academy of Sciences. Statement of the Committee of Human Nutrition Science of the
Polish Academy of Sciences on the use of dietary supplements containing vitamins and minerals by adults. Rocz Panstw Zakł Hig
2021, 77, 1–6. [CrossRef]
17. SW Research. Available online: https://files.swresearch.pl/raportyPdf/Raport%2364-65-proc-polakow-suplementy-diety-
kupuje-w-aptekach.pdf (accessed on 2 May 2021).
18. Jarosz, M.; Rychlik, E.; Stoś, K.; Charzewska, J. Normy Żywienia Dla Populacji Polski i Ich Zastosowanie; Narodowy Instytut Zdrowia
Publicznego-Państwowy Zakład Higieny: Warsaw, Poland, 2020; pp. 68–437.
19. Institute of Medicine. Dietary Reference Intakes for Calcium, Phosphorus, Magnesium, Vitamin D, and Fluoride; The National Academies:
Washington, DC, USA, 1997.
20. Kutsal, E.; Aydemir, C.; Eldes, N.; Demirel, F.; Polat, R.; Taspnar, O.; Kulah, E. Severe hypermagnesemia as a result of excessive
cathartic ingestion in a child without renal failure. Pediatr. Emerg. Care 2007, 23, 570–572. [CrossRef] [PubMed]
21. Resolution No. 19/2019 of the Team for Diet Supplements of 13 December 2019 on Expressing an Opinion on the Maximum
Dose of Magnesium in the Recommended Daily Dose in Dietary Supplements. In Polish, Uchwała nr 19/2019 Zespołu do
Spraw Suplementów Diety z Dnia 13 Grudnia 2019 r. w Sprawie Wyrażenia Opinii Dotyczacej ˛ Maksymalnej Dawki Magnezu w
Zalecanej Dziennej Porcji w Suplementach Diety. Available online: https://gis.gov.pl/wp-content/uploads/2019/05/uchwa%
C5%82a-19-2019-Magnez.pdf (accessed on 9 September 2021).
22. Moniakowska, A.; Dzierwanowska, A.; Strumińska-Parulska, D. On uranium 234U and 238U radionuclides in calcium and
magnesium supplements and the potential effective radiation dose assessment to the consumers. Food Addit. Contam. Part B
Surveill 2019, 12, 175–181. [CrossRef] [PubMed]
23. Strumińska-Parulska, D.I. 210 Pb in magnesium dietary supplements. Isot. Environ. Health Stud. 2017, 53, 111–115. [CrossRef]
[PubMed]
24. TNS Polska. Available online: https://www.rynekzdrowia.pl/Farmacja/Badanie-TNS-jedna-czwarta-ankietowanych-sadzi-ze-
suplementu-nie-mozna-przedawkowac,139554,6.html (accessed on 23 April 2021).
25. Afzali, H.; Jafari Kashi, A.H.; Momen-Heravi, M.; Razzaghi, R.; Amirani, E.; Bahmani, F.; Gilasi, H.R.; Asemi, Z. The effects of
magnesium and vitamin E co-supplementation on wound healing and metabolic status in patients with diabetic foot ulcer: A
randomized, double-blind, placebo-controlled trial. Wound Repair. Regen. 2019, 27, 277–284. [CrossRef] [PubMed]
26. Blancquaert, L.; Vervaet, C.; Derave, W. Predicting and testing bioavailability of magnesium supplements. Nutrients 2019, 11, 1663.
[CrossRef] [PubMed]
27. Schuchardt, J.P.; Hahn, A. Intestinal absorption and factors influencing bioavailability of magnesium—An update. Curr. Nutr.
Food Sci. 2017, 13, 260–278. [CrossRef] [PubMed]
28. Jahnen-Dechent, W.; Ketteler, M. Magnesium basics. Clin. Kidney J. 2012, 5 (Suppl. S1), i3–i14. [CrossRef]
29. Graham, L.; Caesar, J.; Burgen, A. Gastrointestinal absorption and excretion of Mg28 in man. Metabolism 1960, 9, 646–659.
[PubMed]
30. Gröber, U.; Schmidt, J.; Kisters, K. Magnesium in prevention and therapy. Nutrients 2015, 7, 8199–8226. [CrossRef] [PubMed]
31. Kunachowicz, H. Tabele Składu i Wartości Odżywczej Żywności; PZWL Wydawnictwo Lekarskie: Warsaw, Poland, 2017.
32. Boylan, S.; Welch, A.; Pikhart, H.; Malyutina, S.; Pajak, A.; Kubinova, R.; Bragina, O.; Simonova, G.; Stepaniak, U.; Gilis-
Januszewska, A.; et al. Dietary habits in three Central and Eastern European countries: The HAPIEE study. BMC Public Health
2009, 9, 439. [CrossRef] [PubMed]You can also read