J.P. Morgan Healthcare Conference - Cerner Investor Relations
←
→
Page content transcription
If your browser does not render page correctly, please read the page content below

COVER SLIDE
                                                                   J.P. Morgan
                                                              Healthcare Conference
                                                                                                   Brent Shafer
                                                                                                        Chairman & CEO

                                                                                                        Don Trigg
                                                                                                                 President

                                                                                             Marc Naughton
                                                                                           EVP & Chief Financial Officer

                                                                                                                                                           January 13, 2021

    © Cerner Corporation. All rights reserved. This document contains Cerner confidential and/or proprietary information belonging to Cerner Corporation
1   and/or its related affiliates which may not be reproduced or transmitted in any form or by any means without the express written consent of Cerner.
Cautionary statement regarding forward-looking statements
This presentation may contain forward-looking statements, including without limitation, those regarding projections of future revenues or earnings, operating margins, operating and capital expenses,
bookings, new solution, services and offering development, and capital allocation plans; cost optimization and operational improvement initiatives; future business outlook, including new markets or
prospects for the Company’s solutions and services; and the expected benefits of our acquisitions, divestitures or other collaborations. These forward-looking statements are based on management’s
current beliefs, expectations and assumptions and are subject to significant risks and uncertainties. Cerner’s performance, and actual results, financial condition or business could differ materially from
those expressed in such forward-looking statements. Factors that could cause or contribute to such differences include, but are not limited to:
      the possibility of significant costs and reputational harm related to product and service-related liabilities; potential claims for system errors and warranties; the possibility of interruption at our data
      centers or client support facilities, or those of third parties with whom we have contracted (such as public cloud providers), that could expose us to significant costs and reputational harm; the
      possibility of increased expenses, exposure to legal claims and regulatory actions and reputational harm associated with a cyberattack or other breach in our IT security or the IT security of third
      parties on which we rely; our proprietary technology may be subject to claims for infringement or misappropriation of intellectual property rights of others, or may be infringed or misappropriated
      by others or subject to claims related to open source licenses; material adverse resolution of legal proceedings or other claims or reputational harm stemming from negative publicity related to
      such claims or legal proceedings; risks associated with our global operations, including without limitation greater difficulty in collecting accounts receivable; risks associated with fluctuations in
      foreign currency exchange rates; changes in tax laws, regulations or guidance that could adversely affect our tax position and/or challenges to our tax positions in the U.S. and non-U.S.
      countries; the uncertainty surrounding the impact of the departure of the United Kingdom from the European Union on our global business; risks associated with the unexpected loss or
      recruitment and retention of key personnel or the failure to successfully develop and execute succession planning to assure transitions of key associates and their knowledge, relationships and
      expertise; risks related to our dependence on strategic relationships and third party suppliers, including any impact to the business of such suppliers resulting from the COVID-19 pandemic; risks
      inherent with business acquisitions or strategic investments and the failure to achieve projected synergies; risks associated with volatility and disruption resulting from global economic or market
      conditions, including any impact thereon resulting from events such as the COVID-19 pandemic; significant competition and our ability to anticipate or respond quickly to market changes,
      changing technologies and evolving pricing and deployment methods and to bring competitive new solutions, devices, features and services to market in a timely fashion; managing growth in the
      new markets in which we offer solutions, health care devices or services; long sales cycles for our solutions and services; risks inherent in contracting with government clients, including without
      limitation, complying with strict compliance and disclosure obligations, navigating complex procurement rules and processes and defending against bid protests; risks associated with our
      outstanding and future indebtedness, such as compliance with restrictive covenants, which may limit our flexibility to operate our business; impact of the phase-out of the London Interbank
      Offered Rate (LIBOR) on the interest rates under our financing agreements and the interest rate swap related to the outstanding indebtedness under our credit agreement; the potential for
      losses resulting from asset impairment charges; changing political, economic, regulatory and judicial influences, which could impact the purchasing practices and operations of our clients and
      increase costs to deliver compliant solutions and services; non-compliance with laws, government regulations or certain industry initiatives or failure to deliver solutions or services that enable
      our clients to comply with laws or regulations applicable to their businesses; variations in our quarterly operating results; potential variations in our sales forecasts compared to actual sales;
      volatility in the trading price of our common stock and the timing and volume of market activity, including volatility resulting from the COVID-19 pandemic; inability to achieve expected operating
      efficiencies and sustain or improve operating expense reductions; risks that Cerner’s revenue growth may be lower than anticipated and/or that the mix of revenue shifts to low margin revenue;
      risk that our capital allocation strategy will not be fully implemented or enhance long-term shareholder value; risks that Cerner’s business may be negatively affected as a result of future proxy
      fights or the actions of activist shareholders; our directors’ authority to issue preferred stock and the anti-takeover provisions in our corporate governance documents; and the extent to which the
      COVID-19 pandemic and measures taken in response thereto could adversely affect our financial condition, future bookings and results of operations, including risks associated with the impact
      of the COVID-19 pandemic on collecting accounts receivable.
Additional discussion of these and other risks, uncertainties and factors affecting Cerner's business is contained in Cerner's filings with the Securities and Exchange Commission. The reader should
not place undue reliance on forward-looking statements, since the statements speak only as of the date that they are made. Except as required by law, Cerner undertakes no obligation to update or
revise forward-looking statements to reflect changed assumptions, the occurrence of unanticipated events or changes in our business, results of operations or financial condition over time. A
reconciliation of non-GAAP financial measures discussed in this presentation can be found in the Appendix to this presentation and Cerner’s most recent earnings release that was furnished to the
SEC and posted on the investor section of www.cerner.com.

       © Cerner Corporation. All rights reserved. This document contains Cerner confidential and/or proprietary information belonging to Cerner Corporation
2      and/or its related affiliates which may not be reproduced or transmitted in any form or by any means without the express written consent of Cerner.
© Cerner Corporation. All rights reserved. This document contains Cerner confidential and/or proprietary information belonging to Cerner Corporation
3   and/or its related affiliates which may not be reproduced or transmitted in any form or by any means without the express written consent of Cerner.

COVID-19:
                                                                                        Addressing urgent needs
                                                                                        Cerner’s response:
                                                                                        Operational tools
                                                                                         • Expanded access to platforms                                    • Enhanced telehealth capabilities
                                                                                         • Technology-enabled                                              • Keeping frontline workers safe
                                                                                           temporary facilities

                                                                                        COVID data collected and curated for research
                                                                                         • AWS-Cerner collaboration to create one of largest COVID-19 patient datasets
                                                                                         • More than 30 academic organizations accessing to improve treatment & testing

                                                                                        Public health support
                                                                                         • UK delivery and management                                      • CDC: Support for national
                                                                                           of COVID-19 vaccines                                              projections and policy analysis

    © Cerner Corporation. All rights reserved. This document contains Cerner confidential and/or proprietary information belonging to Cerner Corporation
4   and/or its related affiliates which may not be reproduced or transmitted in any form or by any means without the express written consent of Cerner.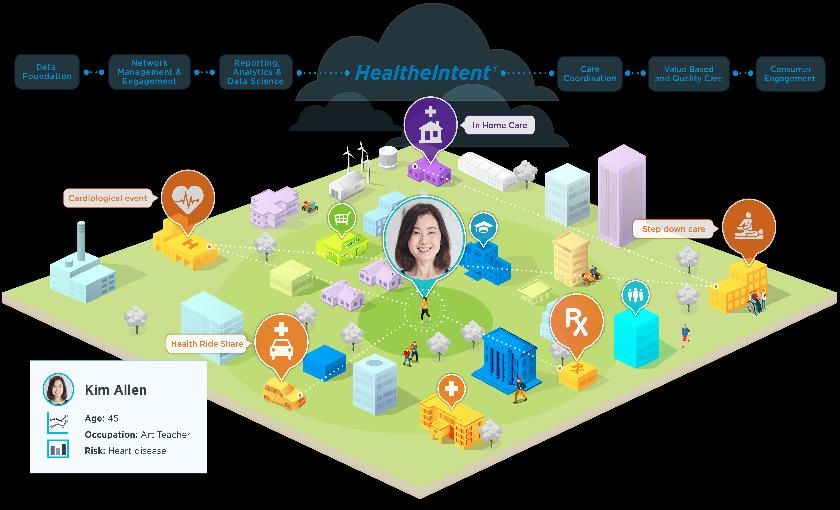
VA, DoD, U.S. Coast Guard
                                                                                       Seamless care for 18 million
                                                                                       Service members and Veterans
                                                                                        Executing the plan and back on track
                                                                                        • First VA go-live at Mann-Grandstaff VA medical center in Spokane, WA
                                                                                        • Now live at 22 DoD sites
                                                                                        • First time in history DoD, VA and USCG using same EHR

                                                                                        Joint Health Information Exchange
                                                                                        • Connected more than 46,000 community partner facilities
                                                                                        • Added 15,000+ community partners with CommonWell
                                                                                        • Since April 2020, patients increased from less than 700,000 to 4 million

    © Cerner Corporation. All rights reserved. This document contains Cerner confidential and/or proprietary information belonging to Cerner Corporation
5   and/or its related affiliates which may not be reproduced or transmitted in any form or by any means without the express written consent of Cerner.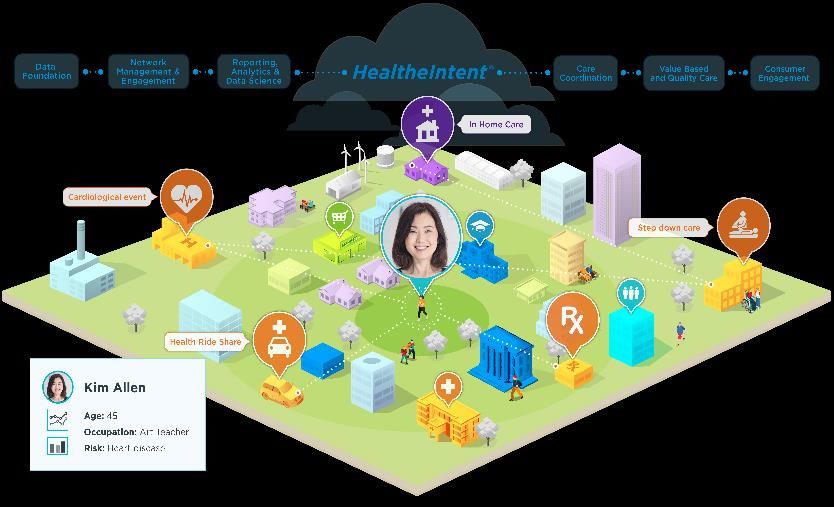
Transformation at Cerner
                                                                                       Emphasis on client experience, innovation at scale
                                                                                       and profitable growth
                                                                                       •    Product lifecycle management improvements
                                                                                       •    R&D efficiency
                                                                                       •    Rationalization of product portfolio / PPM
                                                                                       •    Platform modernization and cloud migration
                                                                                       •    Business simplification
                                                                                       •    Automation and technology improvements
                                                                                       •    Operating efficiencies
                                                                                       •    Culture modernization for a global workforce

                                                                                       Continue investing in strategic growth areas
                                                                                       • Extend beyond the EHR through combination of organic
                                                                                         and inorganic strategies

    © Cerner Corporation. All rights reserved. This document contains Cerner confidential and/or proprietary information belonging to Cerner Corporation
6   and/or its related affiliates which may not be reproduced or transmitted in any form or by any means without the express written consent of Cerner.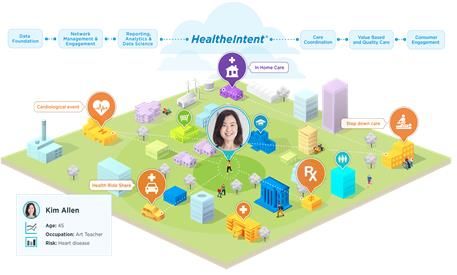
Supporting providers, patients and populations

               Improve                                                       Enhance                                             Create a brighter           Eliminate
             the quality                                                    our clients’                                           future using              inequities
            of health care                                                   everyday                                               data-driven            in health care
                                                                            operations                                               insights

    © Cerner Corporation. All rights reserved. This document contains Cerner confidential and/or proprietary information belonging to Cerner Corporation
7   and/or its related affiliates which may not be reproduced or transmitted in any form or by any means without the express written consent of Cerner.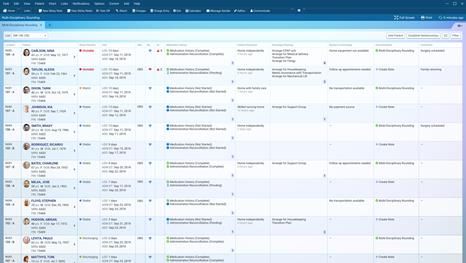
Cerner Business Groups

                                                                                                         Don Trigg
                                                                                                                President

    © Cerner Corporation. All rights reserved. This document contains Cerner confidential and/or proprietary information belonging to Cerner Corporation
8   and/or its related affiliates which may not be reproduced or transmitted in any form or by any means without the express written consent of Cerner.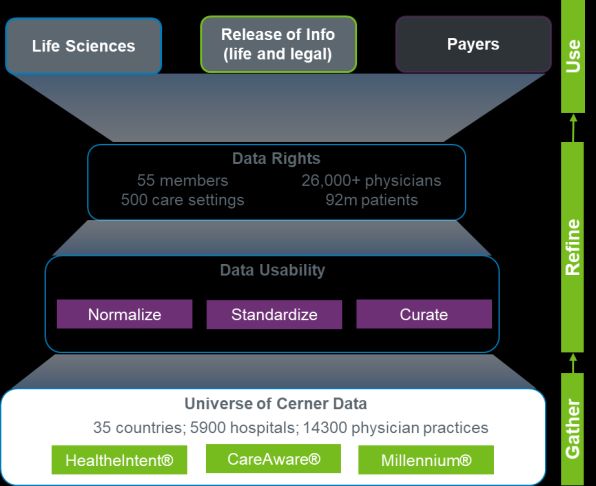
Health Economy: Person, Enterprise, Health Network
                                                   Cerner will advance enterprise-level provider business models,
                                   build differentiated Health Network strategies and create a category-leading Data business.

                  Health System                                                                                   Health                                              Data-Driven
                   Enterprise                                                                                    Network                                            Health Economy
    Integrated EMR (Millennium®):                                                     EMR-Agnostic                                                          Secondary Use of Data:
    One Record, One Plan, One Bill                                                    Health Network (HealtheIntent®):                                      Person (ROI), Life Sciences/Pharma
                                                                                      Network management, member outcomes                                   (RWE)

    Only Cerner:                                                                      Only Cerner:                                                          Only Cerner:
    Business model impact, including                                                  “First mile” data management and “last                                Clinical data activation advantage to
    Service Line growth, Total Cost of Care,                                          mile” actions within the provider workflow                            transform clinical trial speed,
    Integrated Revenue Cycle                                                                                                                                effectiveness and cost

     © Cerner Corporation. All rights reserved. This document contains Cerner confidential and/or proprietary information belonging to Cerner Corporation
9    and/or its related affiliates which may not be reproduced or transmitted in any form or by any means without the express written consent of Cerner.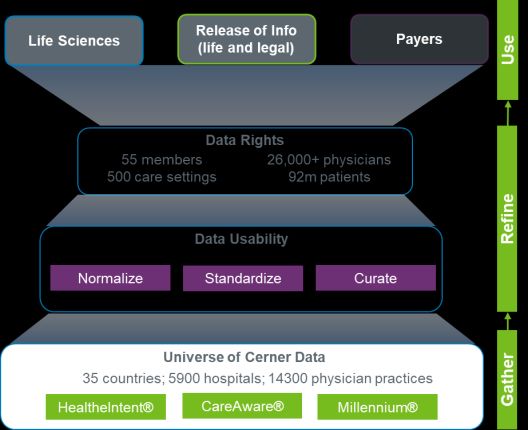
Scaling a Category-Leading Health Network Business
                      Health Networks are being advanced by health systems, payers, and new market entrants.
          COVID-19 is accelerating this macro trend. Cerner’s HealtheIntent platform is purpose-built to enable these strategies.

      • HealtheIntent is a native cloud, EMR-agnostic,
        Big Data platform with category-leading data
        aggregation and processing capabilities

      • The platform is leveraged by health systems,
        self-insured employers, payers and governments

                                                                                                                                                             23 new footprints added in 2020
      • 23 new footprints were added in 2020,
        now totaling ~200 clients worldwide

      • New products in 2020 for network referrals,
        member management and consumer engagement

      © Cerner Corporation. All rights reserved. This document contains Cerner confidential and/or proprietary information belonging to Cerner Corporation
10    and/or its related affiliates which may not be reproduced or transmitted in any form or by any means without the express written consent of Cerner.
Building a Category-Defining Data Business
Real-world evidence is disrupting traditional clinical trials. COVID-19 regulatory response is accelerating this shift.
Cerner’s large provider client base and healthcare data expertise offer the opportunity to reimagine this market.
Only Cerner 2020 After COVID-19
Differentiation Progress Acceleration
• Leading market share • Launched Learning Health • Transform the speed and cost
(1/3 U.S. hospitals) Network℠ (55 members of clinical trials
• Clinical EMR data is wide & deep representing 92mm patients • Build a category-defining drug
and 500mm+ encounters) discovery leader
• Unique Master Data Management
capabilities and tech enablement • Demonstrated the value to • Leverage organic investment
providers and life sciences, and M&A to create a billion-dollar
including COVID-19 data cohort data business
• Developed go-to-market, including
strategic investments and
partnerships
Pharma and RWE data insights
Late-Stage CRO Virtual & Distributed
RWE Analytics
Clinical Trials
(invested)
© Cerner Corporation. All rights reserved. This document contains Cerner confidential and/or proprietary information belonging to Cerner Corporation
11 and/or its related affiliates which may not be reproduced or transmitted in any form or by any means without the express written consent of Cerner.Kantar Health Acceleration
Kantar Health is a building-block acquisition for organic and inorganic efforts to build a billion-dollar data business.
Kantar brings differentiated data products, subject matter expertise, and direct access to pharma.
Market
Selected Clients
Entry Criteria • RWE and commercialization data,
analytics and research for life sciences
• Megatrend/
strategic tailwind • 650 associates across 17 countries
• >100 life sciences clients, including top
• TAM > $3B & achievable Global scale and data collection capabilities
20 pharma decision-makers
market share (≥15%)
• Speed-to-revenue Differentiated Data Products, Subject Matter Expertise
• EMR-agnostic; • Scientific research expertise with KH’s years of associates
Cerner assets are emphasis in oncology, rare disease and
patient reported outcomes.
50+ epidemiology
coverage
~70 with advanced
degrees
leverageable
• KH’s RWE business has double-digit
• Surmountable barriers- 75+ RWE studies
to-entry (including regulatory)
growth. Cerner’s clinical data offers
compelling opportunities to accelerate it. annually 400+ Oncology
annually
studies
© Cerner Corporation. All rights reserved. This document contains Cerner confidential and/or proprietary information belonging to Cerner Corporation
12 and/or its related affiliates which may not be reproduced or transmitted in any form or by any means without the express written consent of Cerner.Health Economy: Person, Enterprise, Health Network
Health System Health Data-Driven
Enterprise Network Health Economy
Accelerate provider Build health network Create health care’s
business model strategies management capabilities leading data business
and outcomes
© Cerner Corporation. All rights reserved. This document contains Cerner confidential and/or proprietary information belonging to Cerner Corporation
13 and/or its related affiliates which may not be reproduced or transmitted in any form or by any means without the express written consent of Cerner.Financial Overview
Marc Naughton
Executive Vice President and Chief Financial Officer
© Cerner Corporation. All rights reserved. This document contains Cerner confidential and/or proprietary information belonging to Cerner Corporation
14 and/or its related affiliates which may not be reproduced or transmitted in any form or by any means without the express written consent of Cerner.Solid Results in Challenging Environment
Q320 2020**
Result Growth vs. Estimate Guidance Growth
As of 10/28/20
$1.369 -4% $5.5 -3%
Revenue (+1% Organic)
billion (+2% Organic) billion
GAAP Operating Margin % 30.1%
Adj. Operating Margin % * 20.4% 230 20.0% 150
basis points basis points
GAAP EPS $1.16
Adjusted Diluted EPS* $0.72 9% $2.84 6%
• All key metrics at expected levels in Q320
• Q320 GAAP results include the impact of gains on investments and divestitures
• Revenue decline driven by divestitures and COVID was offset by strong margin expansion, leading to
good earnings growth
• Strong full-year margin expansion drives 6% EPS growth on lower revenue
• Expect return to growth and ongoing margin expansion in 2021
*Adjusted Operating Margin & Adjusted Diluted EPS reflect adjustments compared to results reported on a GAAP basis in our 2020 Form 10-Qs. Non-GAAP results should not be
©substituted as a measure
Cerner Corporation. All of our reserved.
rights performance
Thisbut instead should
document beCerner
contains used along with GAAP
confidential results
and/or as a supplemental
proprietary measure of
information belonging financial
to Cerner performance.
Corporation
15 **Guidance
and/or asaffiliates
its related of October 28, not
which may 2020. This presentation
be reproduced does
or transmitted notform
in any represent
or by any an update
means orthe
without confirmation of consent
express written guidance.of Cerner.Strong balance sheet and cash flow
Balance Sheet (as of Q320)
• $892 million cash
• Increased debt in 2019 and early 2020 to fund expanded capital return program and Strong balance
M&A; still have significant capacity sheet and cash
• Current debt of $1.3 billion isSummary
1 Solid YTD performance considering circumstances
COVID has impacted results, but resilience of business and
2 expense control have mitigated impact
Strategic Growth and Federal position Cerner for solid
3 growth; margin expansion opportunities remain
Strong balance sheet and cash flow position Cerner
4 to manage through pandemic and deploy capital for
dividend, share repurchases and M&A
© Cerner Corporation. All rights reserved. This document contains Cerner confidential and/or proprietary information belonging to Cerner Corporation
17 and/or its related affiliates which may not be reproduced or transmitted in any form or by any means without the express written consent of Cerner.Questions
© Cerner Corporation. All rights reserved. This document contains Cerner confidential and/or proprietary information belonging to Cerner Corporation
18
© Cerner and/or
Corporation. All rights
its related reserved.
affiliates which may not be reproduced or transmitted in any form or by any means without the express written consent of Cerner.OUR OUR OUR
VISION MISSION PROMISE
We believe in a To relentlessly Health care is
seamless and seek breakthrough
innovation that will
too important
connected world to stay the same.
where everyone thrives. shape health care
of tomorrow
© Cerner Corporation. All rights reserved. This document contains Cerner confidential and/or proprietary information belonging to Cerner Corporation
19 and/or its related affiliates which may not be reproduced or transmitted in any form or by any means without the express written consent of Cerner.Reconciliation of GAAP Results to Non-GAAP Results*
Appendix – Reconciliation of GAAP Adjusted Operating Earnings
($ i n mi l l i ons )
Operating
2019
Operating Operating
Q1 2020
Operating
Q2 2020
Operating Operating
Q3 2020
Operating Operating
Earnings Margin % Earnings Margin % Earnings Margin % Earnings Margin %
to non-GAAP financial measures Operating earnings (GAAP)
Share-based compensation expense
$ 601
109
10.6% $ 178
35
12.6% $ 147
38
11.0% $ 412
38
30.1%
We report our financial results in accordance with accounting principles generally Acquisition-related amortization 85 17 13 13
Organizational restructuring and other expense 221 41 46 32
accepted in the United States of America ("GAAP"). However, we supplement our GAAP COVID-19 related expense 2 1 1
results with certain non-GAAP financial measures, which we believe enable investors to Gain on sale of business (217)
better understand and evaluate our ongoing operating results and allows for greater Charge related to client dispute 30
Vendor settlement 7
transparency in the review and understanding of our overall financial, operational and
economic performance. These non-GAAP financial measures are not meant to be Adjusted Operating Earnings (non-GAAP) $ 1,052 18.5% $ 274 19.4% $ 245 18.4% $ 279 20.4%
considered in isolation, as a substitute for, or superior to GAAP results and investors Adjusted Net Earnings and Adjusted Diluted
should be aware that non-GAAP measures have inherent limitations and should be read Earnings Per Share 2019 Q1 2020 Q2 2020 Q3 2020
only in conjunction with Cerner's consolidated financial statements prepared in Diluted Diluted Diluted Diluted
accordance with GAAP. These non-GAAP measures may also be different from similar ($ i n mi l l i ons , except per s ha re da ta ) Earnings Per Earnings Per Earnings Per Earnings Per
non-GAAP financial measures used by other companies and may not be comparable to Net Earnings Share Net Earnings Share Net Earnings Share Net Earnings Share
similarly titled captions of other companies due to potential inconsistencies in the method Net earnings (GAAP) $ 529 $ 1.65 $ 147 $ 0.47 $ 135 $ 0.44 $ 357 $ 1.16
of calculations. We provide the measures of adjusted operating expenses, adjusted Pre-tax adjustments for Adjusted Net Earnings:
operating earnings, adjusted operating margin, adjusted net earnings and adjusted Share-based compensation expense 109 35 38 38
Acquisition-related amortization 85 17 13 13
diluted earnings per share as such measures are used by management, along with Organizational restructuring and other expense 221 41 46 32
GAAP results, to analyze Cerner's business, make strategic decisions, assess long-term COVID-19 related expense 2 1 1
trends on a comparable basis, and for management compensation purposes. We provide Investment gains (30) (0) (26) (49)
the non-GAAP measure of free cash flow as such measure takes into account certain Gain on sale of business (217)
Charge related to client dispute 30
capital expenditures necessary to operate our business. Free cash flow is used by Vendor settlement 7
management, along with GAAP results, to analyze our earnings quality and overall cash
generation of the business, and for management compensation purposes. After-tax adjustments for Adjusted Net Earnings:
Income tax effect of pre-tax adjustments (81) (17) (16) 46
Any future period non-GAAP guidance in this presentation includes adjustments for items Share-based compensation permanent tax items (8) (5) 1 2
not indicative of our core operations, which may include, without limitation, share-based Valuation allowance on net operating loss carryforwards 3 - -
compensation expense, organizational restructuring and other expense and acquisition- Adjusted Net Earnings (non-GAAP) $ 862 $ 2.68 $ 223 $ 0.71 $ 193 $ 0.63 $ 222 $ 0.72
related expenses. Such adjustments may be affected by changes in ongoing Free Cash Flow
assumptions and judgments, as well as nonrecurring, unusual or unanticipated charges, ($ i n mi l l i ons ) 2019 Q1 2020 Q2 2020 Q3 2020
expenses or gains or other items that may not directly correlate to the underlying
Cash flows from operating activities (GAAP) $ 1,313 $ 284 $ 259 $ 382
performance of our business operations. The exact amount of these adjustments are not Capital purchases (472) (49) (117) (72)
currently determinable, but may be significant. It is therefore not practicable to Capitalized software development costs (274) (74) (78) (73)
practicable to provide the comparable GAAP measures or reconcile this non-GAAP Free Cash Flow (non-GAAP) $ 568 $ 160 $ 64 $ 237
guidance to the most comparable GAAP measures. Cash flows from investing activities (GAAP) $ (640) $ (137) $ (248) $ (212)
Please see the accompanying table for a reconciliation of GAAP results to non-GAAP Cash flows from financing activities (GAAP) $ (601) $ (296) $ (27) $ (23)
financial measures.
*More detail on these adjustments and management's use of non-GAAP results is in our most recent Form 10-K and our current reports on Form 8-K.
© Cerner Corporation. All rights reserved. This document contains Cerner confidential and/or proprietary information belonging to Cerner Corporation
20 and/or its related affiliates which may not be reproduced or transmitted in any form or by any means without the express written consent of Cerner.You can also read