January 2022 Produced by South London Partnership Enquiries
←
→
Page content transcription
If your browser does not render page correctly, please read the page content below
Official

           January 2022

                                        Produced by South London Partnership
                          Enquiries: abi.broad@southlondonpartnership.co.uk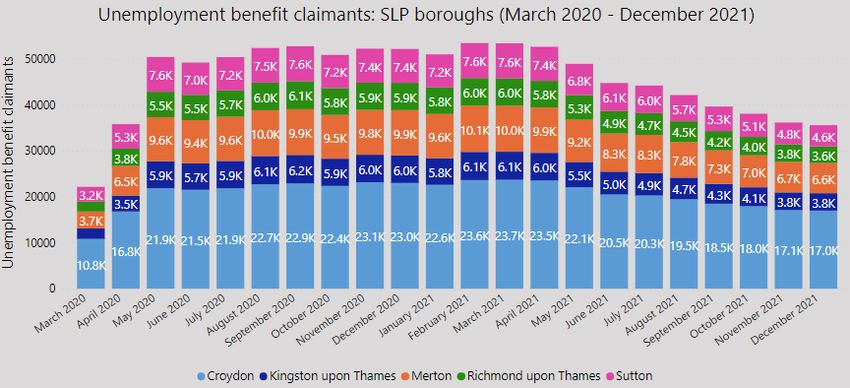
Official

                                                Contents
           This edition of Economic Insights contains the following:

           1.   Unemployment rate
           2.   Unemployment benefits
           3.   Universal credit
           4.   Job postings
           5.   Green skills audit

           The data in the following slides refers to a range of dates dependent on when the latest data is
           available which ranges between September 2021 and December 2021.

                                                         2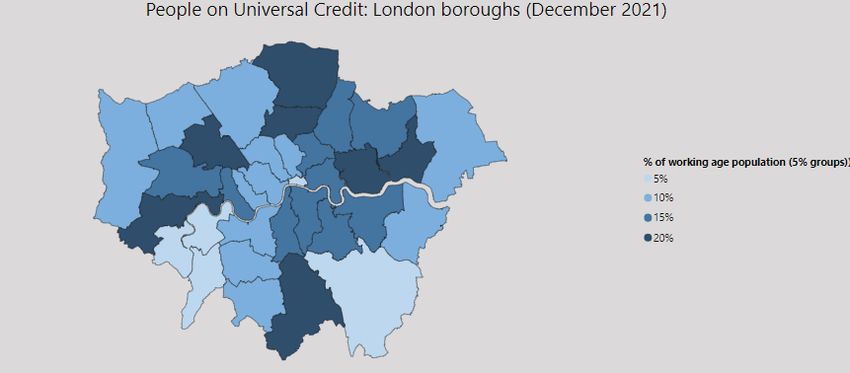
Official

                                                           Headlines
   • The annual unemployment rate across SLP boroughs as a whole has continued to rise over the last 12 months and stands at
           5.6% for the year to September 2021. This is below the London rate of 6.5% but higher than the England rate of 4.9%.
           However, the quarterly England and London unemployment rates for November 2021 which are not available at borough
           level have declined since early 2021 suggesting that unemployment levels are starting to decline but not yet showing in the
           annual data.

   • 4.7% of the working population in SLP boroughs were receiving unemployment benefits at the end of December 2021 with
           this declining since the pandemic peak in February 2021. This differs to the proportion of the working age population
           receiving universal credit which has seen very little decline since the steep rise at the start of the pandemic. This could be
           explained by 40% of people receiving universal credit while in employment, suggesting high levels of in-work poverty.

   • The number of job vacancies as shown by job postings remained high (at over 50,000 in SLP boroughs) at the end of 2021
           with a high number of lower paid jobs (assistant roles in healthcare and hospitality) which may be hard to fill due to high
           costs of living in SLP boroughs and London more generally as well as the impact of Brexit.

   • The number of green jobs is expected to reach 38,000 by 2030 and 65,000 by 2050 with skilled craft roles (e.g. electric
           vehicle technicians solar PV installers, repair technicians) seeing the biggest increase. To meet the demand, there will need
           to be increases in educational provision, progression of students into green job and workers moving from other sectors.

                                                                         3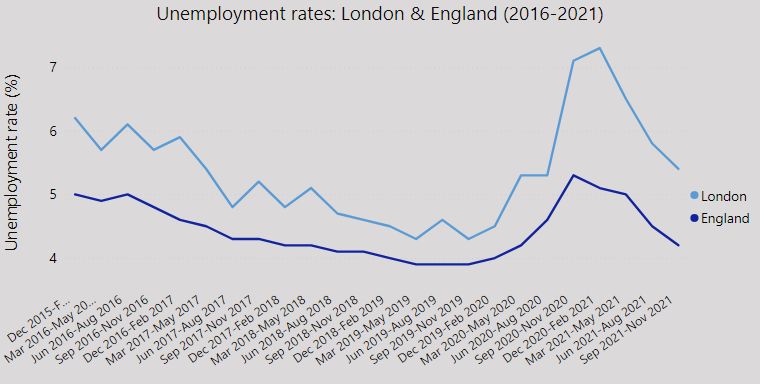
Official
Official

  Unemployment in London has continued to decline through 2021 to 5.4% though still remains
  higher than pre Covid levels (4.8%)

 Following a steep rise between Q2 and Q4 2020 unemployment rates in London declined steeply in 2021 though are not yet at pre Covid levels. At November 2021 the London
 unemployment rate was 5.4%, considerably higher than the England rate of 4.2%

 Source: Office for National Statistics/Nomis                                     5
 Updated:18th January 2022
Croydon and Merton’s unemployment rates have continued to rise while Kingston and Sutton
Official

  have been declining and Richmond has stayed constant in the last 12 months to September
  2021
 The overall London and England rates have remained relatively stable over the past few years but the SLP boroughs have fluctuated. Croydon and Richmond saw the steepest
 rise in unemployment during the pandemic but only Croydon was above the overall London rate in the period of October 2020 – September 2021.

  *each datapoint is the unemployment rate for the previous year.
  The last available data is for October 2020 - September 2021.

 Source: Office for National Statistics                                            6
 Updated:18th January 2022
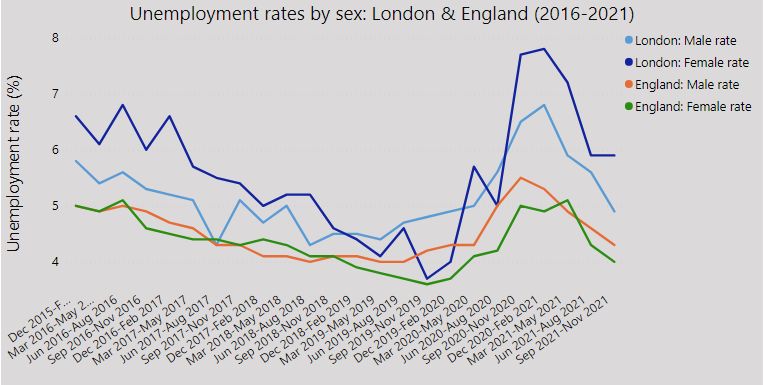
The unemployment rate for females in London stopped declining in the 2nd half of 2021 after
Official

  a steep decline from the end of 2020. The male rate in London as well as both rates in
  England are continuing to decline
 Unemployment rate is higher for females in London but males currently have a higher unemployment rate across England, although the difference in England is smaller than in
 London.

 Source: Office for National Statistics/Nomis                                       7
 Updated:18th January 2022
Official
Official

  Unemployment Benefit claimants across SLP boroughs have declined by a third since the
  peak in February 2021 but at December 2021 were still almost double the pre Covid levels

       The total number of unemployment benefit claimants peaked at 53,366 across SLP boroughs in February 2021. The number of claimants declined by 17,800
       between February 2021 and December 2021, representing a decline of 33%. This represents the first consistent decline in the total number of claimants since the
       start of the pandemic.

 Source: Office for National Statistics                                               9
 Updated:18th January 2022
Official Unemployment Benefit claimants as proportion of working age population have declined from peak levels in February 2021 but remain high compared to March 2020 4.7% of the working age population across SLP boroughs was claiming Unemployment Benefits in December 2021, a considerably higher rate than before the first lockdown. However with the exception of Croydon this was a smaller proportion than London on average. Source: Office for National Statistics 10 Updated:18th January 2022
Official

  The 25-34 age group has the highest proportion of unemployment benefit claimants across
  all SLP boroughs – this is the same as England but different to the pattern in London

 Unemployment Benefit claimants across SLP boroughs have declined across all age groups since April 2021. Younger claimants aged between 18 and 39 have seen a
 faster decline relative to their share of the population compared with those aged between 45 and 64.

 Source: Stat-Xplore/Department for Work and Pensions                           11
 Updated:18th January 2022
Official

  There was a higher proportion of males than females claiming unemployment benefits across
  all SLP boroughs, as well as London and England, throughout the pandemic

In the SLP boroughs pre-pandemic, the number of males and females claiming unemployment benefit was almost the same. Males saw a steeper rise in the 1st few months of
the pandemic and the difference between males and females has remained constant since mid-2020 and throughout the decline during the second half of 2021, This is the
opposite to what may be expected in London considering females constantly had a higher unemployment rate throughout the pandemic.

 Source: Stat-Xplore/Department for Work and Pensions                            12
 Updated:18th January 2022
Official
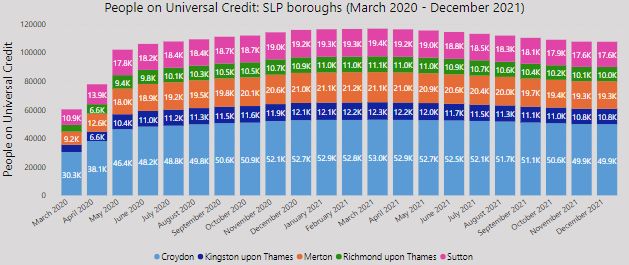
Official

  The number of Universal Credit claimants across SLP boroughs increased rapidly at the start
  of the pandemic and has remained high since with only slight declines in recent months

 Universal Credit claimants across SLP boroughs peaked at a total of 116,821 in March 2021, with this figure falling to 114,479 in June 2021 and 107,623 in October 2021.
 There was a smaller decrease between March and December 2021 in the number of universal credit claimants than was seen for Unemployment Benefit claimants indicating
 that benefits for those still working or unrelated to unemployment may still be required to a large extent.

 Source: Stat-Xplore/Department for Work and Pensions                              14
 Updated:18th January 2022
There has been only a slight decline in the proportion of working age population claiming
Official

 Universal Credit in SLP boroughs between March and December 2021 with levels remaining
 around double those seen in March 2020
 At December 2021 Universal Credit claimants remained close to double the level seen in March 2020 across SLP boroughs. In December 2021, the average rate of claimants
 across the SLP boroughs was 14.2%, below the London average of 15.9%. Similar to Unemployment Benefits, Croydon has had a higher rate of Universal Credit claimants than
 other SLP boroughs and London since the start of the pandemic in March 2020.

 Source: Stat-Xplore/Department for Work and Pensions                             15
 Updated:18th January 2022
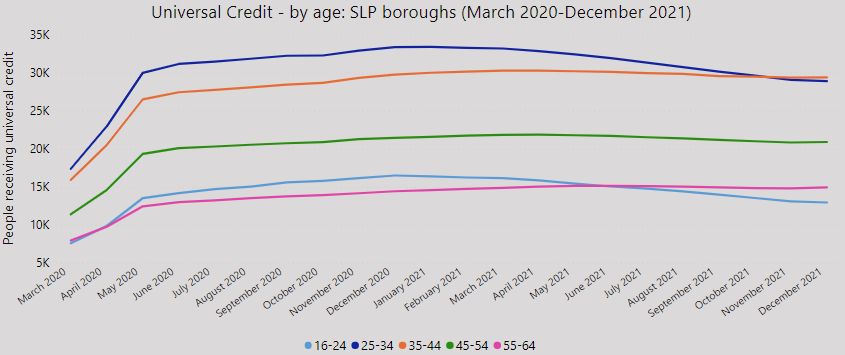
Across SLP boroughs 25-44 year olds remain the age groups with the highest number and
Official

  proportion of the population receiving universal credit, although 25-34 years olds as well as
  the 16-24 age group have been slowly declining in the past few months

                                                             All age groups saw a steep increase at the start of the pandemic. The
                                                             younger age groups (16-34) continued to rise the quickest before
                                                             beginning an earlier decline from the start of 2021 compared to those
                                                             over 35s who have seen more consistent numbers.

                                                             Only Croydon has all age groups at a higher rate than London and
                                                             England at December 2021. 25-34 years olds in Sutton are the only
                                                             other age group in the SLP boroughs with a higher proportion of the age
                                                             group receiving universal credit than the same age group in London

 Source: Stat-Xplore/Department for Work and Pensions   16
 Updated:18th January 2022
Across London, Croydon is the 7th highest borough in terms of its proportion of working age
Official
population receiving universal credit at December 2021, with the other SLP boroughs in the
lowest half.
Richmond and Kingston are amongst the boroughs with the lowest proportion (5%-10%) of people receiving universal credit. Merton and Sutton are in the middle with between
10%-15% of people receiving universal credit. Croydon is in the highest 10 boroughs with over 20% of people on universal credit.
Ranks of SLP boroughs
7. Croydon
20. Merton
22. Sutton
31. Kingston
32. Richmond
Source: Stat-Xplore/Department for Work and Pensions. Population
estimates 2020 – Office for National Statistics 17
Updated:18th January 2022/ 25th June 2021Official
As of October 2021, approximately 40% of universal credit claimants in SLP boroughs were
in employment. However, the majority of claimants (60%) are searching for work
In SLP boroughs, 63,200 people on universal credit are not in employment and 44,500 are in employment. This is consistent with the number of people receiving
unemployment benefits. Some people on universal credit have conditions and requirements regarding employment - 36,300 are searching for work, 25,400 people are
working and have no further requirements, 22,800 have no work requirements and 18,500 people are working with additional requirements. Around 40% of people on universal
credit in SLP boroughs are in employment and many have requirements to look for better paid work, suggesting in-work poverty.
Searching for work: Not working, or with very low earnings. Claimant is required to take action to secure work - or more / better paid work.
Working – no requirements: Individual or household earnings over the level at which conditionality applies.
No work requirements: Not expected to work at present. Health or caring responsibility prevents claimant from working or preparing for work.
Working – with requirements: In work but could earn more, or not working but has a partner with low earnings
Planning for and preparing for work – expected to work in the future and expected to start preparing for future
Source: Stat-Xplore/Department
… for Work and Pensions 18
Updated:18th January 2022Official
Official

  There has been a rapid rise in the number of unique job postings in SLP boroughs since
  September 2021 although there was a slight dip in December

 Job postings increased month-on-month throughout 2021 with the exception of February where there was a slight dip with the total number of postings across SLP
 boroughs reaching 54,300 in November 2021 and decreasing slightly to 53,500 in December. This was considerably higher than for most of 2020 and the average for
 2017-2019.

 Note: Job postings data is limited to only those job adverts posted online and does not include offline adverts. Often a job
 located within an SLP borough only has the location attributed to London, which has not been included in this analysis,
 therefore counts only for SLP boroughs may undercount the true number of postings for jobs located in SLP boroughs.

 Source: emsi                                                                                            20
Official

  Healthcare, hospitality, education and business & technology were the industries with the
  highest number of vacancies in the last 6 months in SLP boroughs
 In the SLP boroughs in the last 6 months, there were over 4500 unique job postings for nurses (as an occupation). For some occupations there is a different amount of effort ,
 For every 6 job postings, 1 was a unique posting, suggesting an above average effort towards hiring for the position (regional average is 4:1). The median posting duration was
 37 days – higher than the regional average of 34 days.

                                                                                     21
     Source: emsi
Official
The most common job vacancy titles advertised in SLP boroughs over the last 6 months are
mostly lower paid jobs
Over 1000 jobs were advertised for both teaching assistants and support workers in the SLP boroughs over the last 6 months and for teaching assistant roles for every 6
postings there was 1 unique job posting. Other education/childcare positions as well as hospitality and construction roles had a high number of unique job postings and many
had a median posting duration of over 40 days. The median advertised salary for all jobs posted in the last 6 months was £14.50 per hour (when salary was available)
22
Source: emsiOfficial
Official

  Green Skills: Phase 1

           In 2021, the SLP in collaboration with the other sub-regional partnerships in London commissioned research
           into the green economy to define green jobs and identify the opportunity they present in economic growth
           and employment.

           The report defined green jobs as ‘those jobs that facilitate meeting net zero and broader
           environmental goals’

           These include jobs serving the retrofitting agenda such as Solar PV installers, jobs in sustainable transport
           such as Electric Vehicle Engineers or community engagement officers working in climate adaptation.

           Phase 1 of the Green Skills and Jobs Report (pan-London) was published in October ahead of COP26 and
           highlighted the rapid expected growth in green jobs up to 2030 and the need to combat inequality in the
           green workforce which at present is predominantly white males.

                                                                24
Official
Green Skills: Phase 2: Expansion of the Sector
Phase 2 of the Green Skills and Jobs Report will be published Growth in the Green Jobs in South London (thousands)
shortly and focuses on the SLP boroughs.
The key findings of the report are:
• The total number of green jobs is projected to rise from
19,000 in 2020 to 65,000 in 2050 in SLP There will be a small
positive impact on net employment which will increase by
around 3,900 jobs in 2030 and around 1,700 jobs in 2050.
• Power and Homes and Buildings are the biggest green
sectors in the subregion.
• Climate adaptation, green infrastructure and reducing
localised pollution is the green sector whose employment is
most concentrated in South London.
• The green workforce in the SLP is currently 77% male and
81% white.
25Official
Green Skills: Phase 2: Scale of Growth
Scenarios dependent on policy action from national and local
government around innovation, skills, trade and regulation in
impacting: Scope of growth (thousands)
• Engagement and behaviour change – how the public and
businesses adopt low carbon options and behaviours
• Innovation – How does green technology evolve over the
coming decades.
To meet demand and reduce the risk of a skills shortage, it is vital
to:
• Increasing educational provision and student take-up of
courses in these sectors.
• Increase proportion of students who progress into roles.
• Increase the flow of workers from other sectors into green
roles.
26Official
Green Skills: Phase 2: Types of Roles
• Including replacement demand, consultancy-based roles
such as engineers in the green economy are set to rise by
650 per year. Examples of these roles are: Projected changes per occupational group to 2030
• Soil conservation technician
• Heat pump Engineers
• Circular procurement consultants
• Including replacement demand, skilled craft roles in
homes, buildings and landscape and reduce reuse recycle
will increase by 1800 per year, which is 90% of the annual
output from education. Examples of these roles are:
• Electric Vehicle technicians
• Solar PV installers
• Repair technicians
27You can also read