Jarmo Koistinen (Ilmatieteen laitos/UHA) Hilppa Gregow (Ilmatieteen laitos/ILM) sekä
←
→
Page content transcription
If your browser does not render page correctly, please read the page content below

Sää- ja ilmastotieto tehokkaan
       hulevesien hallinnan tukena
    nykyisessä ja tulevassa ilmastossa
Jarmo Koistinen (Ilmatieteen laitos/UHA)
Hilppa Gregow (Ilmatieteen laitos/ILM) sekä
Pekka Rossi, Hanna Virta ja Ilari Lehtonen (IL)
Juhani Korkealaakso ja Ville Pietiläinen (VTT)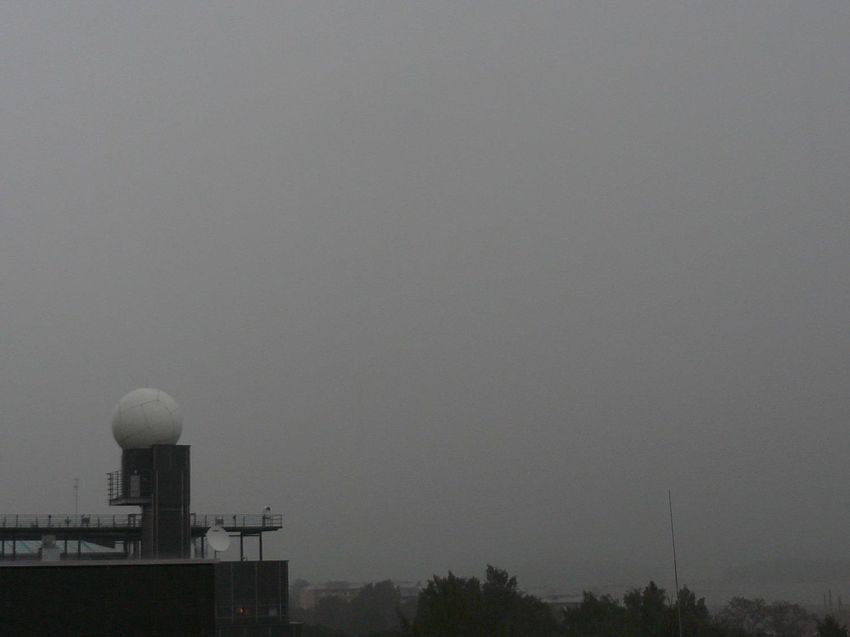
Only weather radars can resolve the time-space
  patterns of rain generating storm water flooding
Convective systems
often small and short
living (5 km, 1 h):
Rule of thumb: use
gauges only when the
catchment is smaller
than 1 km2

                              Rainfall intensity
    20 km                     ~ 40 mm/h
Challenge: weather radar is not as accurate as a gauge.
R&D: Tekes INKA/EAKR OSAPOL 2015-2016 (FMI et al.)
Supports INKA ÄlykäsVesi (HSY etAbdullah
                                   al.) visit, 30 Mar, 2011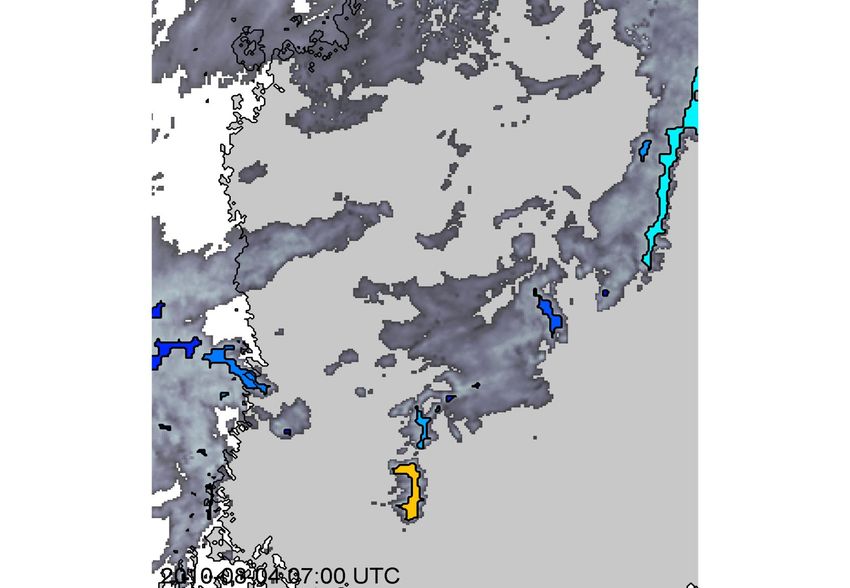
Good weather radar coverage
                                  available in parts of Europe
                                In Finland
                                • 9 C-band Doppler
                                  Radars (8 with dual
                                  polarization capability)
                                • System utilization
                                  rate >98 %
                                • 9 x 500 x 360
                                  precipitation estimates
                                  every 5 minutes
                                • ~10 TB/year
                                Radar data exchange
                                NWSs/NORDRAD
                                  and OPERA
                                  www.knmi.nl/opera
                                EU/Baltrad(+)
                                  http://baltrad.eu/
Vaisala HW&SW (RVP 900, IRIS)   • Open source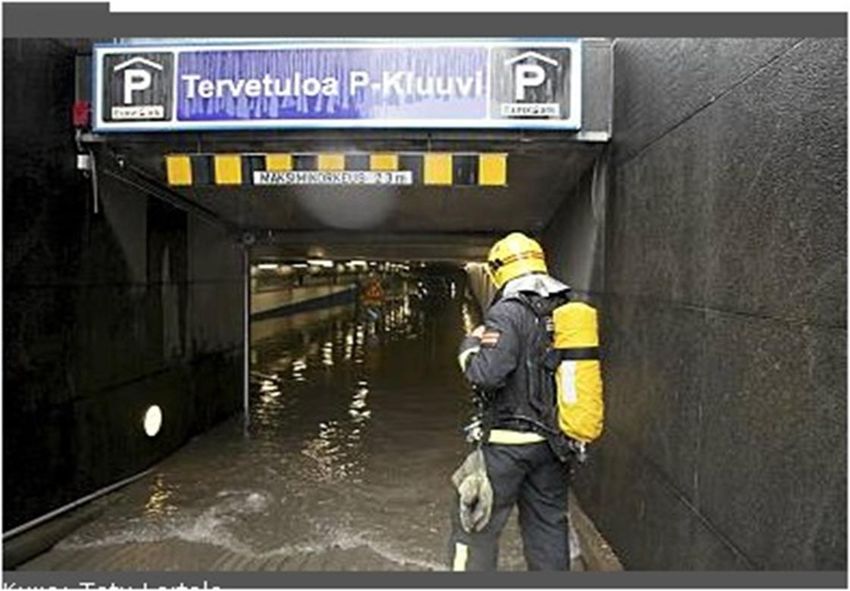
Example: Urban storm water flooding

    Accumulation at Iso Omena on 13 Jun 2009 8-12 pm
    (60 mm/2h ≈ typical June accumulation)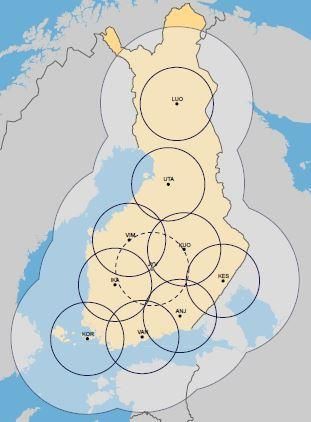
Radar network can provide the present
        climate of area-intensity-duration PDFs

R (mm/min)
                Gauge-based 2 min return
12              periods available only up to
                Y ~ 100 years. See:
                MMM/RATU (Suomen Ympäristö 31/2008)
                & Hulevesiopas
    8

    4

                Return period of 2 minute point intensity
1               10                  100               1000
                          EGU 2008, 15 Apr
The socio-economic issue: optimization and risk
management of heavy rain and storm water impacts
Active real time local adaptation
Thunderstorm rain in Pori:
~120 mm in 3 hours
damage 15-20 M€
Underground flooding
in Helsinki
Exceedance probabilities
are vitally important for risk management and
     reasonable in meteorological sense
 A single forecast scenario at a specific location and time period:
         Probability of exceeding 1 mm/3h = 98 %
         Probability of exceeding 10 mm/3h = 60 %
         Probability of exceeding 100 mm/3h = 15 %
 The tool for obtaining exceedance probabilities is
 ensemble prediction system (EPS) i.e. instead of a single
 nowcast we compute multiple alternative scenarios
 which estimate real probabilities.

                                  IPMA, 17 Jun 2009
Movement of precipitating areas
       is the basis for 0 – 3 (-6) h long radar EPS

• Pilot projects: Tekes/RAVAKE,
  2009-12 and EU HAREN &
  EDHIT
• Probabilities computed from
  51 members of ensemble
  forecasts (Koistinen et al.
  2012)
• Blended with NWP ensembles
  for lead times 2 h – 5 d

•   Computationally demanding
•   Practical user interfaces
•   The concept of probability
•   Growth and decay of rainfall
    systems (and their size &
    location with NWP)
Exceedance probabilities of intensity and
accumulation for each location from ensembles
Courtesy of Ville Pietiläinen, VTT Research
Centre
Practical output:
Individual members exceedance
probabilities of
hourly accumulation
Rainfall intensity
5 % exceedance (product update
scenario interval 5-15 min)
50 % exceedance
scenario
90 % exceedance
scenario
Nowcast lead timeDedicated wastewater application
Heinonen et al. 2013
Helsinki Region Wastewater
Treatment Plant, run by HSY
(for 800 000 ihabitants),
receives gridded probability
scenarios in real time:
• 3-hourly accumulation
• Update cycle 15 min
• Probability scenarios 5, 50
and 90 %
• Greater Helsinki region
• Grid resolution 1 x 1 km²
In general: Application and
location -tailored action
thresholds are needed for
effective real-time adaptationActive Storm Water Impact Mitigation
Objective: Establish tailored mitigation services of storm water impacts based on
automatic chained modeling ( ) and forecasting [1 - 6 (- 240) h].
1. Adaptive measurements and 2. Water flow and level 3. Impact risk modeling
rainfall ensemble predictions ensembles on and monitoring, adaptation and
under the ground mitigation processes
”Traffic light”
flood risk
monitoring
& forecasts
at critical
points
Real estate level risks (upper)
City level risks (lower)
”Traffic light”
flood risk
monitoring
Worst case simulation at
& forecasts
downtown Helsinki with at critical
the severe rain in Pori points
Pilot project:
J. Korkealaakso (VTT), Tekes/SmartAlarm (hydrology and hydraulics)
SWork performed in Tekes (SHOK FLEXe) & SHOK proposal City+Storm water and climate change Climate model result: Change in the largest 24 hourly rainfall (%) 1971-2000 → 2081-2100 in the A1B-scenario • The largest daily rainfall amounts will grow 20-30 % in all seasons • Very little is known of the future climate of convective heavy rainfall – a downscaling challenge (STN proposal) 27.4.2015 12
Basis for active and passive storm water adaptation:
Present and future socio-economic impacts
ISTO/IRTORISKI Case:
Return period 100 years downpour in Greater Helsinki

• Direct damage € 110 million
       • Homes 40M€ (privately owned houses not included),
         commercial services 20M€, public services 20M€, transport
         network 15M€, energy network 15M€
       • Estimated from earlier studies and actual case reviews
• Limited access for 12 weeks
       • Production interruptions and delays

Integrated cost estimation in Finland, an STN proposal lead by FMI

Interpreting Welfare Effecs in Induced Economic Impact Evaluation of Extreme Events   27.4.2015   13
Conclusion
Active heavy rainfall and
storm water impact mitigation 1
is almost lacking though the 0.9
severe
socio-economic impacts can 0.8
be enormous in the present
0.7
and future climates
0.6 intense
BUT 0.5
Good tools for it are available 0.4
or in preparation 0.3 moderate
0.2
0.1
0 weak
0 0.2 0.4 0.6 0.8 1
Figure to right:
Index based intensity, combining radar and
lightning information (Rossi et al. 2013,2015)
Storm location +30 min 04/22/13You can also read


