Land Drainage What is the Land Drainage activity and why is the Council involved? - Hauraki District Council
←
→
Page content transcription
If your browser does not render page correctly, please read the page content below
138 2012-22 Hauraki Long-Term Plan – Volume 1 of 2
Land Drainage
What is the Land Drainage activity and why is
the Council involved?
Land Drainage and Flood Protection and Control activities both work towards achieving the same goals in
terms of retaining the productive capability of the land, therefore these activities have been incorporated
into one Group of Activities called Land Drainage. The Council also believes that Land Drainage is the
most easily understood name for this activity for those who are affected. The legislative requirement for
the Flood Protection and Control Works activities is set out in section 2 of the 10 schedule of the Local
Government Act, 2002. Land Drainage is a particularly significant activity for Hauraki District Council,
more so than for most other local authorities in New Zealand. The Council has Land Drainage standing
committees that have representatives from both the Council and users that advise the Council on land
drainage and flood protection and control measures.
Land drainage and flood protection and control are key functions of the Council’s operation, as a
considerable portion of the northern Hauraki Plains lies at or below the normal high tide level in the Firth
of Thames. The remainder of the land on the Hauraki Plains is only slightly above this level, so protection
against high water tables, extreme weather events, high tides and river floods is essential to the
continuing occupation and use of the land for residential, agricultural and horticultural purposes.
Flood Protection
The majority of the Flood Protection activity in the Hauraki District is provided by the river schemes of the
Waikato Regional Council, except in the northwest part of the District (Waitakaruru to Miranda) where it is
provided by Hauraki District Council. The assets that provide direct protection from river and tidal flooding
include stopbanks, floodgates and pump stations, and are referred to as primary flood protection assets.
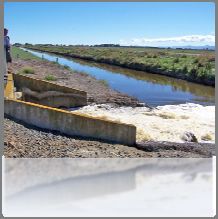
Land Drainage
Land drainage assets collect runoff from the catchment areas of the District and convey it to the primary
flood protection assets which discharge it direct to river or sea outlets. In addition to the drainage network,
land drainage assets can include stopbanks, floodgates and pumps. The latter drainage assets perform a
land drainage function, e.g. pumping from a minor drain into a major drain; they do not provide direct
protection from river and tidal flooding, and are referred to as secondary protection assets.
These services are provided by the Council in three Drainage Districts:
The Western Plains Drainage District which lies between the Piako River and State Highway 27, from
the Firth of Thames to the District boundary with Matamata-Piako District Council.
The Eastern Plains Drainage District which lies between the Piako River and the Waihou River, from
the Firth of Thames to the District boundary with Matamata-Piako District Council.
The Paeroa Rural Drainage District which comprises three smaller former drainage districts east of
the Waihou River. The former districts were the Komata North, Opukeko and Tirohia Rotokohu
drainage districts.
The Land Drainage activity provides protection in a sustainable manner, through achieving a high degree
of public safety and effective protection of property, farmland and roads by draining excess surface water
and managing ground water levels. The Land Drainage activity delivers services which the community
needs to function productively and comfortably on a day to day basis, which meet high community health
and safety standards, and which promote continuing productive use of the land.Land Drainage 139 There is a community demand for Land Drainage services, and also an expectation that sustainable management of the environment will be a key driver in the design and management of the systems. How does the Council provide this activity? The Council carries out the Land Drainage activity by maintaining drains, canals, control structures, floodgates, flood pumps, culverts and stopbanks. Maintenance of the drains ensures that effective performance of the drainage system in removing surface runoff can be relied upon in order to meet the agreed level of service. Council drains are maintained by a combination of spraying and machine cleaning programmes, conducted by the Council’s Construction and Maintenance business unit. Each drainage district has its own advisory committee of members elected to represent ratepayers specifically on drainage matters in their area. The Western Plains Drainage Committee also has responsibility for the management of the flood protection aspect of the activity. The drainage advisory committees report directly to the Council. The drainage committees establish levels of service with the Council and the community and recommend the annual or on-going works programme. The Council then sets the rates to be collected on their behalf to fund these works. The Council currently owns and maintains: The land drainage schemes which have a replacement value of approximately $15.6m (excluding land value). Overall there are 646 km of drains1, 49km of stopbanks, 92 floodgates and control gates, and 4 pump stations. The Flood Protection schemes have a replacement value of $7.4m (excluding land value). Overall there are 37.7km of stopbanks and 16 floodgates, and one pump station. In November 2010 Kaiaua area was incorporated into the Hauraki District. One small land drainage district (Taramaire Drainage District) was transferred to Hauraki District Council. This drainage district is essentially locally managed, but administrative support is provided by the Council. 1 As per the 2011 Infrastructure Valuation
140 2012-22 Hauraki Long-Term Plan – Volume 1 of 2
Map of Hauraki Land Drainage Districts and Flood Protection area
Taramaire
Flood Protection
Komata North
Western Plains
Opukeko
Eastern Plains
Tirohia Rotokohu
How does this activity promote sustainability?
The focus of the Land Drainage activity is sustainable protection of high quality agricultural and
horticultural land, and infrastructural services, to ensure on-going social and economic well-being for
future generations. It also endeavours to support sustainable principles by mitigating adverse effects from
these activities, and promoting a balanced set of well-beings including consideration of environmental,
social, cultural and economic benefits in decision making processes. Some ways in which the activity acts
sustainably are:
Improved education to residents and ratepayers on sustainability and how the Council can help
protect the resources of the District.
Provision of land drainage, enabling the Plains to be farmed in a manner which provides both for
today’s generation and future generations.
Control of foreshore and stream stopbanks around Waitakaruru and Miranda. By protecting the area
from the tide the Council performs a sustainable practice, as it enables continued habitation, farming
practices and operation of tourist facilities.Land Drainage 141
Sustainability Tuner for Land drainage
Well-being Dimension What does this mean?
The Land Drainage and Flood Protection Group
Scale Economic Environmental Social Cultural generally has positive effects on the four aspects of
community well-being. This Group of Activities
5 enables farming to continue on the Hauraki Plains.
4 Farming is arguably a cultural tradition and has
3 significant economic benefits, both locally and
2 nationally. This Group of Activities does have a
1 significant negative effect on environmental well-
0 being, including the loss of natural habitat.
-1 However, this negative effect is balanced by the
-2 positive effects on well-being.
-3
For a further explanation of the criteria and how to
-4
use the sustainability tuner please see Appendix 7.
-5
External issues that affect Land Drainage
The capital and renewal works for Land Drainage can be influenced by a number of factors outside the
control of the Council. These factors include obtaining resource consents, tender prices, weather
conditions, natural disasters, climate change, changes in community expectations and legislative
requirements including the Waikato Regional Plan. Capital Works programmes show specific years for
undertaking the work, but actual timing may vary as a result of any of the above factors.
Climate change and what it means for the Hauraki District
Climate change remains a topical issue at an international, national and local scale. The gradual warming
of the earth’s surface is associated with polar ice and glacial retreat, more frequent and intense storms,
droughts and a rise in sea level.
Whilst it is believed that the Hauraki District is unlikely to see any extensive changes in temperature or
rainfall averages in the near future, extreme weather events may increasingly affect the District. An
increase in the frequency of flooding and/or droughts, increased risk of tidal surges due to sea-level rise,
and an increased risk of infestation of invasive flora species are some of the potential outcomes of
climate change for this District which could have an effect on the Land Drainage activity.
Although the extent of the effects of climate change are still being debated, the Central Government has
given local government clear direction (through the Resource Management Act, 1991 and the Local
Government Act, 2002) to plan for the effects of climate change. As a result the Council sought
community feedback on a range of climate change policy scenarios during the development process of its
Hauraki Community Plan 2009-19.
The consultation and submission process helped to guide the Council with its decision making regarding
climate change and how best to approach its potential effects on this District.
Hauraki District Council’s current response to climate change
The Council calculated a series of projections to help it plan for possible changes in temperature, rainfall,
rainfall intensity and sea level rise. Based on guidance from the Ministry for the Environment and the
feedback given by the community, the Council adopted a midline approach for climate change
projections. The table below lists the projections adopted by the Council in 2009.142 2012-22 Hauraki Long-Term Plan – Volume 1 of 2
Projections for the next 100 years
Temperature Temperature will be likely to rise by 2.1°C as a mean average.
Rainfall There will likely be a decreased annual rainfall of
Plains: - 10mm
Waihi: -30mm
Paeroa: -10mm
Rainfall intensity Increase in rainfall intensity of up to 20%
Sea level rise Sea levels will be likely to rise by 0.5m.
Please note that these projections are subject to change and will be updated as further research is
released by the appropriate national and international organisations.
These mid-line projections guide the Council’s decision making regarding setting standards for the design
and construction of stormwater systems, land drainage and flood protection and control works. For
example with the projected increase in rainfall intensity, the Council must ensure that stormwater and
land drainage assets are designed and constructed to be capable of moving this increased amount of
water during each event through its stormwater and land drainage systems to the receiving point. The
Council has amended its design criteria to allow for this predicted increase in intensity. In the future the
Council may also need to increase its flood pump capacity to move increased levels of water into the
protected river systems.
The Western Plains Drainage District made a submission to the Council’s Draft Hauraki Long Term Plan
seeking the inclusion of an investigation regarding the appropriate level of service for the foreshore
stopbanks. This investigation will be undertaken in 2012/13 and any works arising from this investigation
will be detailed in the Draft 2013/14 Annual Plan and will be part of the Draft Annual Plan consultation
process.
Asset Valuations and Depreciation
The Council re-values its assets every three years to assess total network values and to recalculate
depreciation based on those new values. Depreciation (the wearing out of an asset) is an operating
expense which is required to be funded through rates.
Some significant changes in Land Drainage asset valuations have resulted from the 2011 revaluation, for
the following reasons:
The total length of stopbanks valued has reduced from the 95.6 km figure used in the 2008 valuation
to 86.2 km for the current valuation (resulting from improved accuracy of measurement), reducing
stopbank asset value by 10%.
Cost increases in replacing floodgate and pump station assets over the three years between
revaluations.
The annual depreciation amount for Land Drainage has decreased by 27%. Predominant reasons for the
reduction are:
Provision of an allowance for capital renewal works expenditure every 20 years on average for
stopbanks has been taken into account.
The expected lives for floodgates have been increased.
Key legislative drivers
Land Drainage Act, 1908
Civil Defence and Emergency Management Act, 2002
Resource Management Act, 1991
Soil Conservation and Rivers Control Act, 1941
Climate Change Response Act, 2002
Health Act, 1956
Governments Sustainable Development Action Plan
Waikato Regional Council Regional Policy Statement and Regional PlanLand Drainage 143
Relevant Policies, Plans and Strategies
Type of Plan Description and Objective
Land Drainage Asset An Asset Management Plan is in place and was reviewed and updated in
Management Plan preparation for this 2012-22 Hauraki Long Term Plan.
The Land Drainage Asset Management Plan details the systems in place for
managing, monitoring and reporting on the performance of assets. The plan
itemises and categorises assets and details the maintenance, renewal and
capital expenditure programs over a 10 year period. It also identifies levels of
service, the supporting asset performance measurement issues, and defines
areas where further information is required. It addresses the lifecycle of the
asset, the demands on the asset, the risks to the asset and how these risks will
be mitigated. It is reviewed on an on-going basis to ensure that a sustainable
development approach is taken, and that planning is as fully integrated as
possible.
Operative District Plan and Provides a framework for the sustainable management of the natural and
Proposed District Plan physical environment, and assists the Council to carry out its functions in order to
achieve the purpose of the Resource Management Act, 1991.
Hauraki District Council Provides laws applicable only to Hauraki District that in general protect the public
Consolidated Bylaw from nuisance; protect, promote and maintain public health and safety; and
minimise the potential for offensive behaviour in public places.
Demand Management
The Council’s drainage systems are nearly fully developed and are currently on a programme of
maintenance and renewal. The majority of capital works are therefore focussed on programmed
renewals. Development of land in the District for agricultural purposes has now been largely completed.
As the Land Drainage activity is essentially area based, the future demand on the Council’s system of
canals, drains, stopbanks and flood control structures, as a result of population changes is expected to be
very limited.
Increased drainage pumping capacity may be needed in time to counteract the possible impact of climate
change and rising sea level, in addition to that needed to counteract the lowering ground levels on the
peat soils of the Hauraki Plains.
While there is unlikely to be any major drainage development in the foreseeable future, there will be small
additions from time to time to the drainage network. The cost of these additions will be met by the
beneficiaries of the additions. Provided that a number of conditions are met, the completed drain addition
will be added to the network.
The Council is aware that the predicted impacts of climate change could have significant effects on the
foreshore and lower river stopbank requirements for the Regional Council’s river schemes. This may lead
to the need for additional flood control measures and structures in the drainage districts. Given the
relationship between the river schemes and the drainage districts, the Council will work closely with
Waikato Regional Council to develop appropriate responses over the life of this Plan to mitigate the
possible consequences of climate change. As well as addressing structural issues, funding issues will
also need to be considered if additional works or assets are required. This could impact on the land
drainage rates for users in the future in the land drainage areas.144 2012-22 Hauraki Long-Term Plan – Volume 1 of 2
What are the significant positive and negative effects?
Where possible, negative effects associated with the provision of services are addressed. The column
showing how negative effects are remedied includes the methods currently in use, and does not list all
options available to the Council.
How do we remedy these
Positive Negative
negative effects?
Contributes to health, comfort Cost of compliance with Operation of a Competitive
and safety and the proper standards. Pricing Policy for which
functioning of communities. Potential conflict between tender applications are
Reduced flooding risk. operation of the activity and sought with the lowest
Helps protect viable, healthy cultural values. tender taken in most
land, contributing to Intensive farming negates cases.
sustainable farming. diversity options. Mitigation of issues on a
Some productive land lost to one by one basis.
drainage channels. Observation and
Potential pollution from fertiliser monitoring.
runoff and chemical sprays
conveyed through the drainage
network.
Loss of natural wetland habitat.
Peat shrinkage and lowering of
the water table.
Effect on well-being
The impact of land drainage and flood protection services and activities on well-being is generally
positive, as they contribute to preservation and protection of the land’s farming capacity, in turn creating a
financially and socially healthy environment in which communities can thrive. Negative impacts have
historically included changes to natural replenishing and draining systems of the land which can result in
loss of habitat and flora and fauna.
Collaborative Projects
Relationship with Waikato Regional Council
Most of the Council’s drainage districts lie within the catchments covered by the Piako River
or the Waihou Valley Schemes operated by the Waikato Regional Council. The maintenance
of these schemes’ foreshore and river stopbanks and associated structures (such as the
floodgates and pump stations), which provide the outlets for the Council’s drainage districts,
is the responsibility of Waikato Regional Council. The Council’s flood protection and control
works lie outside the area of the river schemes.
The Hauraki Plains drainage areas are entirely dependent on the continuing operation of the Regional
Council’s river scheme assets, both for protection from tidal and river flooding, and for the means of
discharging runoff through the primary floodgated outlets and pumps. The scheme assets (stopbanks,
floodgates and pumps) are owned by the Waikato Regional Council, which has the responsibility for
provision, maintenance, and depreciation funding of the assets. Waikato Regional Council also funds the
power company’s network charges to their pumps. Hauraki District Council has responsibility for the
drainage networks, the weed clearing maintenance of the pump screens, and the funding of the energy
component of the power company’s charges.
The urban areas of Ngatea, Kerepehi, Turua and Paeroa all discharge to the Waihou or Piako Rivers via
Waikato Regional Council floodgates and pump stations. In the Plains towns, the main drainage outlet
channels also convey runoff from upstream rural catchments. The maintenance of these channels is the
responsibility of the appropriate drainage committee. In Paeroa, the primary urban drainage channel is
the Hape Stream (Paeroa Main Drain) which is maintained under the urban stormwater budget. This
channel also conveys upstream rural catchment runoff.Land Drainage 145
There is a close co-operative relationship between the two organisations. The Council appoints a
representative to the Waikato Regional Council Waihou-Piako Zone Liaison Sub-committee. There are
also additional local community representatives, often from the Hauraki District, that are appointed to the
zone sub-committee. Staff of both Councils share the routine monitoring, inspection and minor
maintenance of the pump stations. In times of flood events there is also a close co-operative relationship
between Councils’ staff and contractors to provide the level of service delivery.
Levels of Service and how the Council will measure them
Community Method of
Levels of Service Baseline Target 2012-22
Outcome measurement
Quality drainage services provided to all customers.
Measure: Customer 2012/13: >60%
37%
Percentage of affected customers satisfied satisfaction 2013-22: To be
(2010/11)
with the land drainage services. survey advised**
A reliable land drainage network is provided.
Measure:
Number of properties affected by ponding Drainage
of more than three days duration during a Committee 0* 0
one in ten year event or less (as defined by reports
the HIRDS analysis).
Efficient response to drainage problems and emergencies.
Measure: 2012/13: >90%
Percentage of urgent service requests Service Request 2013/14: >90%
92%
regarding land drainage responded to database 2014/15: >95%
within four hours. 2015-22: >95%
Measure: 2012/13: >90%
Percentage of non-urgent service requests Service Request 2013/14: >90%
92%
regarding land drainage services database 2014/15: >95%
responded to within two working days. 2015-22: >95%
Reliable flood protection assets are provided.
Monthly
inspections
Measure:
recorded in
The number of failures of stopbanks and 0* 0
Authority Asset
floodgates in a one in 50 year event.
Management
(AM) database.
* This is a new measure however the baseline has been calculated based on existing records.
** Targets for the years 2013-2022 will be established once the initial baseline survey is undertaken in 2012/13. The
targets for 2013-22 will be proposed for community consideration as part of the 2013/14 Annual Plan.146 2012-22 Hauraki Long-Term Plan – Volume 1 of 2
Possible impacts on Levels of Service
Throughout the 2012-22 Hauraki Long Term Plan, considerable effort has been made to ensure the levels
of service are as concise as possible, however due to the nature of Local Government, in some cases
there may be unforeseen circumstances that may impact on these service levels.
Levels of Service Possible impacts on Level of Service
Quality drainage services The Council will be undertaking a user satisfaction survey in 2012/13 to
provided to all customers establish base lines for user satisfaction with the provision of Council
services. It is possible that the user satisfaction targets set in this Plan will
need to change as a result of the survey. The method for the survey
programmed is similar to previous surveys, however it will now target users
of services rather than all residents and ratepayers. The estimated targets in
this Plan have been predominantly based on external survey techniques
used for similar sized Councils however, the Council is unsure at this stage
how appropriate these estimated targets are to Hauraki District.
Lowering of ground levels on the peat soils of the Hauraki Plains may result
in the need for additional pumping capacity.
Increased environmental awareness surrounding the water quality
discharged into the drainage and river systems may lead to changes in the
standards applied to drain management. Particular concerns that may
require attention are:
- The protection of water quality in drains/stream from contaminants that
may be carried by urban stormwater (e.g. silt, hydrocarbons, untreated
sewage, heavy metals) or stormwater runoff from roads.
- The importance of riparian zones (stream banks) in the protection of
the District’s biodiversity and the need to integrate riparian zone
management and improvement with agricultural practices.
A reliable land drainage network Increased drainage pumping costs may be incurred in order to counteract
is provided the potential impact of climate change and rising sea level.
There may be advancements in chemical sprays and biological methods to
control weeds as and when they begin to adversely impact on the efficiency
of drainage channels resulting in reduced costs.
During the effective life of this Plan, Waikato Regional Council may develop
a mechanism of consenting drain maintenance programmes.
Efficient response to drainage Changes in land use, for example increased horticulture could result in the
problems and emergencies need for increased drainage capacity.
Reliable flood protection assets Increasing costs to maintain/raise stopbanks to allow for possible sea level
are provided. rise and associated tidal surge due to climate change.
During the life of this Plan an Event Management and Flood Control
procedure will be developed. Depending on the outcome of this process
there may need to be some changes to the way major weather events are
managed.
During 2012/13 an investigation will be undertaken by Council staff for the
Western Plains Drainage District to assess the appropriate level of service
for the foreshore stopbanks with particular regard to climate change and the
Waikato Regional Council foreshore stopbank standards.
Future Directions
There is a possibility that the Waikato Regional Council may take responsibility for some of the
Hauraki District Council’s Land Drainage and/or Flood Protection activity.
Future reviews of the Council’s climate change policy could result in changes to the design elements for
this activity.Land Drainage 147
Programmed actions for 2012-22
Capital Works Schedule – District-wide
$1.94 million of funding has been allocated for Land Drainage capital projects during the life of
this Plan. This is predominantly to upgrade existing networks and to provide for the
replacement of assets on the networks that have reached the end of their useful lives.
Capital projects include:
Canal reconstruction
Stopbank shaping and reconstruction
Foreshore stopbank reconstruction
Culvert replacement
The full list of capital works for the District can be found on page 22 in Volume 2 of the Plan and the major
capital works are listed below.
Community 2012/13 2013/14 2014/15 2015-22
Project
Outcome ($)000 ($)000 ($)000 ($)000
Land drainage
West Plains Drainage District pump screen
replacement: Replacement of four pump screens
- 68
in 2016/17 at the estimated end of their service
life.
Eastern Plains Drainage District Terrace
stopbank: Surveying the stop bank in 2012/13
6 74
with reconstruction of the stopbank to follow in
2013/14.
Komata North Drainage District Alexander
Canal: Stopbank Survey scheduled for 2013/14 6 164
with reconstruction to follow in 2015/16.
Tirohia Rotokohu Drainage District Kuaoiti
Canal: Stopbank Survey scheduled for 2020/21 256
with reconstruction to follow in 2021/22.
Flood Protection
Reconstruction Waitakaruru stopbank
shaping: Finishing the shaping/trimming of 80
material excavated in 2011/12.
Other stopbank reconstruction:
Reconstruction of the stopbanks from Karito
to Hot Springs, Karito to Indian floodgate, Hot
Springs to Boundary and Waitakaruru (all on
145 209 400
the Miranda-Waitakaruru foreshore area) are all
on a 10 year reconstruction cycle due to
foundation settlement and the need to maintain
levels of service.
Karito and Hot Springs Canals - stopbank
106 154
reconstruction.
Miranda Pump Switch Board: Switch boards
have an estimated life of 20 years and therefore 16
its replacement has been scheduled for 2015/16.
Smythe floodgate replacement: The
replacement of Smythes floodgate is to be
confirmed with a condition assessment however - - 249
the current estimated date of replacement is
2019/20.148 2012-22 Hauraki Long-Term Plan – Volume 1 of 2
What are the costs of operating Land Drainage?
Budget Forecast Forecast Forecast Forecast Forecast Forecast Forecast Forecast Forecast Forecast
2011‐12 2012‐13 2013‐14 2014‐15 2015‐16 2016‐17 2017‐18 2018‐19 2019‐20 2020‐21 2021‐22
$000 $000 $000 $000 $000 $000 $000 $000 $000 $000 $000
OPERATING EXPENDITURE
172 Vegetation Control 172 179 185 192 199 206 213 221 230 240
12 Maintenance/Fencing/Culverts 13 13 14 14 15 15 16 16 17 18
168 Mechanical Cleaning 171 177 184 190 198 205 212 220 229 238
21 Floodgates 21 22 23 23 24 25 26 27 28 29
170 Pumps 234 247 258 269 281 292 304 318 333 349
206 Overheads 194 200 205 210 216 222 228 234 241 248
86 Other 51 53 55 57 59 62 64 66 69 72
315 Depreciation 229 229 266 266 266 298 298 298 343 343
(42) Interest (39) (57) (68) (74) (75) (94) (116) (131) (141) (163)
1,108 1,046 1,063 1,122 1,147 1,183 1,231 1,245 1,269 1,349 1,374
OPERATING REVENUE
‐ Fees and Charges ‐ ‐ ‐ ‐ ‐ ‐ ‐ ‐ ‐ ‐
‐ External Subsidies ‐ ‐ ‐ ‐ ‐ ‐ ‐ ‐ ‐ ‐
1,052 Targeted Rates 1,053 1,067 1,088 1,104 1,122 1,140 1,159 1,178 1,199 1,220
186 General Rates 186 188 192 195 198 201 204 208 212 215
1,238 1,239 1,255 1,280 1,299 1,320 1,341 1,363 1,386 1,411 1,435
130 OPERATING SURPLUS/(DEFICIT) 193 192 158 152 137 110 118 117 62 61
CAPITAL EXPENDITURE
‐ Capacity Demand Increases ‐ ‐ ‐ ‐ ‐ ‐ ‐ ‐ ‐ ‐
125 Level of Service Increases ‐ ‐ ‐ ‐ ‐ ‐ ‐ ‐ ‐ ‐
400 Renewals 88 225 317 396 70 ‐ 146 249 8 441
‐ Other Capital Expenditure ‐ ‐ ‐ ‐ ‐ ‐ ‐ ‐ ‐ ‐
525 88 225 317 396 70 ‐ 146 249 8 441Land Drainage 149
Funding Impact Statement for Land Drainage
Budget Forecast Forecast Forecast Forecast Forecast Forecast Forecast Forecast Forecast Forecast
2011‐12 2012‐13 2013‐14 2014‐15 2015‐16 2016‐17 2017‐18 2018‐19 2019‐20 2020‐21 2021‐22
$000 $000 $000 $000 $000 $000 $000 $000 $000 $000 $000
SOURCES OF OPERATING FUNDING
General rates, uniform annual general charges,
186 rate penalties 186 188 192 195 198 201 204 208 212 215
Targeted rates (other than a targeted rate for
1,052 water supply) 1,053 1,067 1,088 1,104 1,122 1,140 1,159 1,178 1,199 1,220
‐ Subsidies and grants for operating purposes ‐ ‐ ‐ ‐ ‐ ‐ ‐ ‐ ‐ ‐
‐ Fees, charges, and targeted rates for water supply ‐ ‐ ‐ ‐ ‐ ‐ ‐ ‐ ‐ ‐
‐ Internal charges and overheads recovered ‐ ‐ ‐ ‐ ‐ ‐ ‐ ‐ ‐ ‐
Local Authorities fuel tax, fines, infringement
‐ fees, and other receipts ‐ ‐ ‐ ‐ ‐ ‐ ‐ ‐ ‐ ‐
1,238 Total Operating Funding (A) 1,239 1,255 1,280 1,299 1,320 1,341 1,363 1,386 1,411 1,435
APPLICATIONS OF OPERATING FUNDING
630 Payments to staff and suppliers 662 692 718 746 776 805 835 868 906 946
‐ Finance Costs ‐ ‐ ‐ ‐ ‐ ‐ ‐ ‐ ‐ ‐
163 Internal charges and overheads applied 155 142 138 135 141 128 112 103 100 85
‐ Other operating funding applications ‐ ‐ ‐ ‐ ‐ ‐ ‐ ‐ ‐ ‐
793 Total Applications of Operating Funding (B) 817 834 856 881 917 933 947 971 1,006 1,031
445 SURPLUS (DEFICIT) OF OPERATING FUNDING (A ‐ B) 422 421 424 418 403 408 416 415 405 404
SOURCES OF CAPITAL FUNDING
‐ Subsidies and grants for capital expenditure ‐ ‐ ‐ ‐ ‐ ‐ ‐ ‐ ‐ ‐
‐ Development and financial contributions ‐ ‐ ‐ ‐ ‐ ‐ ‐ ‐ ‐ ‐
102 Increase (decrease) in debt ‐ ‐ ‐ ‐ ‐ ‐ ‐ ‐ ‐ ‐
‐ Gross proceeds from sale of assets ‐ ‐ ‐ ‐ ‐ ‐ ‐ ‐ ‐ ‐
‐ Lump sum contributions ‐ ‐ ‐ ‐ ‐ ‐ ‐ ‐ ‐ ‐
102 Total Sources of Capital Funding (C) ‐ ‐ ‐ ‐ ‐ ‐ ‐ ‐ ‐ ‐
APPLICATIONS OF CAPITAL FUNDING
Capital Expenditure
‐ ‐ to meet additional demand ‐ ‐ ‐ ‐ ‐ ‐ ‐ ‐ ‐ ‐
125 ‐ to improve the level of service ‐ ‐ ‐ ‐ ‐ ‐ ‐ ‐ ‐ ‐
400 ‐ to replace existing assets 88 225 317 396 70 ‐ 146 249 8 441
22 Increase (decrease) in reserves 334 196 107 22 333 408 270 166 397 (37)
‐ Increase (decrease) of investments ‐ ‐ ‐ ‐ ‐ ‐ ‐ ‐ ‐ ‐
547 Total Applications of Capital Funding (D) 422 421 424 418 403 408 416 415 405 404
(445) SURPLUS (DEFICIT) OF CAPITAL FUNDING (C ‐ D) (422) (421) (424) (418) (403) (408) (416) (415) (405) (404)
‐ FUNDING BALANCE ((A ‐ B) + (C ‐ D)) ‐ ‐ ‐ ‐ ‐ ‐ ‐ ‐ ‐ ‐
Reconciliation of Cost of Service Statement to Funding Impact Statement
130 OPERATING SURPLUS/(DEFICIT) 193 192 158 152 137 110 118 117 62 61
315 Depreciation 229 229 266 266 266 298 298 298 343 343
‐ Subsidies and grants for capital expenditure ‐ ‐ ‐ ‐ ‐ ‐ ‐ ‐ ‐ ‐
‐ Development and financial contributions ‐ ‐ ‐ ‐ ‐ ‐ ‐ ‐ ‐ ‐
445 SURPLUS (DEFICIT) OF OPERATING FUNDING (A ‐ B) 422 421 424 418 403 408 416 415 405 404
The funding impact statement is required under the Local Government Act 2002 Schedule and conforms to clause 5 of the Local
Government (Financial Reporting) Regulations 2011. They cover the 10-year period from 2012/2013 to 2021/2022 and outline the
Council’s sources of funding and its Plan to apply them. Generally accepted accounting practice does not apply to the preparation of
the funding impact statements as stated in section 111(2) of the Local Government Act. The key divergences from generally
accepted accounting practice are the non inclusion of depreciation and the inclusion of internal charges.You can also read