LAND MANAGEMENT ACTIVITY - 1 MARCH TO 30 JUNE 2021 - Horizons Regional Council
←
→
Page content transcription
If your browser does not render page correctly, please read the page content below
LAND MANAGEMENT ACTIVITY –
1 MARCH TO 30 JUNE 2021
1. OVERVIEW
The purpose of this report is to update Council on the Land Management activity
within the Sustainable Land Use Initiative (SLUI), Regional and Coast, and Nursery
activities carried out under the Annual Plan and the Te Uru Rākau (TUR) contract.
The Land Management programme's primary activity is to reduce hill country erosion
in order to increase the resilience of the region to storm events and improve water
quality. At the end of 2021 financial year SLUI had completed more than 597,000 ha
of Whole Farm Plans (WFPs) across 822 farms.
The Land Management Programme’s progress in the 2020-21 financial year was:
SLUI – 23,000 ha of new WFPs, 3,832 ha of grant works. Meeting both Annual
Plan and Contract targets although the contract target for paddock maps was not
met, with 1,004 ha completed against a target of 2,000 ha;
Regional and Coast and Whanganui Catchment Strategy (WCS) – 197 ha of grant
works including cost-share work with the Whanganui River Enhancement Trust
(WRET) meeting their financial and Annual Plan targets (175 ha);
Industry Partnerships – supported seven initiatives, exceeding the target of
supporting at least five;
Nursery – last winter produced 32,600 poles for distribution to landowners for
works in the 2020-21 year, exceeding the target of 30,000, and this winter
approximately 37,500 poles will be distributed for works in the 2021-22 year;
Joint Venture Forestry – completed the silviculture work that was delayed last year
by Covid-19 and fire risk, and worked through a substantial amount of the 2020-
21 programme; updated measurements for forest growth and Emissions Trading
Scheme (ETS) requirements;
Nursery Irrigation – estimates and quotes received for parts of the development
with more work needed regarding the water supply.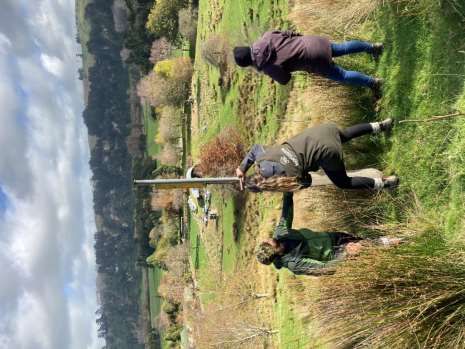
In the last few months of the financial year, staff concentrated on finishing as many
       claims as possible and processed 250. The bulk of these claims were for fencing
       (riparian or retirement) but there was also a large number of late pole claims for the
       year. In late May and June staff had to switch their priorities to allocation and
       distribution of the winter 2021-22 poles as harvesting from the nursery started in
       early June.

Photo 1 – Completing fencing claims in June – Ohakune. Photo: Ryan Connor

       Pole numbers are up this year with nearly 40,000 available for sale. By the end of
       June staff had orders for nearly 37,500 poles and were still working on finding homes
       for the remainder. This is a big increase on the 32,600 poles sold last year. There has
       been a slight over-demand for willow poles despite a solid increase in nursery stock.

       Staff completed the March and May milestone reporting and invoicing for the SLUI
       contract.

       Figures provided in this report were correct as at 30 June 2021 but there may be
       some adjustments as late claims are processed and the database is re-checked. There
       could be small adjustments made before the Annual Report is finalised. To this end all
       Annual Plan and contract targets should be considered provisional at the time this
       report was written.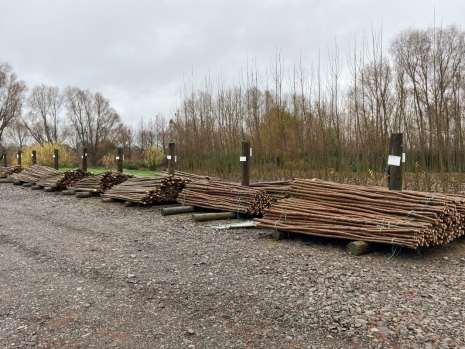
2 REPORT ON PROGRESS
2.1 ANNUAL PLAN AND CONTRACT TARGETS (2020-21)
The Annual Plan and Hill Country Erosion Fund (HCEF) contract targets for 2020-21
are shown in the table below.
Table 1: Annual Plan and HCEF contract targets 2020-21 – Correct at 30 June 2021
ANNUAL HCEF PROVISIONAL
MEASURE TARGET YTD
PLAN CONTRACT RESULT
Sustainable Land Use Initiative (SLUI)
Erosion reduction works
programmes in targeted 3,100 3,065 3,100 3,832 Met target
SLUI catchments (ha)
Whole Farm Plan properties
20,000 22,500 22,500 22,869 Met target
mapped per year (ha)
Farm or paddock
assessments mapped per 2,000 2,000 1,004 Not met target
year (ha)
Case study completed
1 1 1 Met target
(number)
Feasibility reports
6 6 4 Not met target
(number)
Regional and Coast
Manage grant programmes
to deliver erosion reduction 175 175 197 Met target
works (ha)
Support industry initiatives
that promote sustainable 5 5 7 Met target
land use (number)
Operate council nurseries
and source additional
commercial pole material to
30,000 30,000 32,600¹ Met target
deliver poplar and willow
poles to control erosion
(number of poles)
¹ This relates to poles distributed in winter 2020 for the 2000-21 financial year and meets the target for that
year. As noted, approximately 6,000 of these poles have not been claimed in Land work programmes in the
2020-21 financial year. These claims will be completed in 2021-22 along with the winter production of
approximately 37,500 poles.
All five of the Annual Plan targets and four of the six Contract targets were met. The
exceptions are:
Farm or paddock map assessment (HCEF Contract) 2,000 ha. These projects are
completed by staff and are either small extensions to existing farm plans,
mapping works before a farm plan is completed, or one-off assessments for one-
off jobs. They have tended to be lower priority and more reactive than proactive.
It is noted that the target for new Whole Farm Plans was 20,000 ha in the LTP and
22,500 ha in the HCEF contract, and the targets were exceeded with 22,869 ha
completed.
Feasibility Reports (HCEF Contract) six, completed four – these reports relate to
working with landowners who need more information around the feasibility of
establishing forestry blocks on their land. Four were completed in 2020-21, but
there was less demand from landowners than in previous years. Some used
forestry consultants while others were happy with their own knowledge or the
support from their LMA. This missed target has had no impact on getting
afforestation projects approved
The seven industry partnership programmes completed included support for:
Ballance Farm Environment Awards
The year was interrupted due to Covid-19,
Completed the 2019-20 winner’s field day in November 2020,
Started planning 2021-22 programme.
Beef and Lamb (B & L) and other partners
Catch cropping (using short term crop after grazing) project looking at ways to
reduce sediment loss, this project will wind up in spring,
Continued with intensive winter grazing project with sheep, to compare sediment,
nutrient and bacteria losses compared to cattle grazing,
Supported intensive winter grazing campaign to support best practice,
Spoke at B & L field days and workshops, including trees on farm and ETS.
Poplar and Willow Research Trust and other partners
Supported release of the Giant Willow Aphid parasitic wasp biological control
agent,
Supported a research project into the establishment, life cycle and potential
distribution of the poplar sawfly,
Horizons staff member continued as a Trustee of the Poplar and Willow Research
Trust,
Continued membership of the Technical Advisory Group and the Nursery
Managers’ Group,
Supported with sites and measurement of field trials.
Taumarunui Sustainable Land Management Group
Membership, and attendance at meetings.
New Zealand Farm Forestry Association
Membership,
Attended meetings and spoke at field days.
Farmed Landscape Research Centre (Massey University)
Sponsorship of annual workshop,
Input into development of Intermediate and Advanced Farm Environmental
Planning Courses.
LandWISE
Sponsorship of annual conference.
Photo 2 – Winter trees, Stormy Point. Photo: Georgia Hodgson.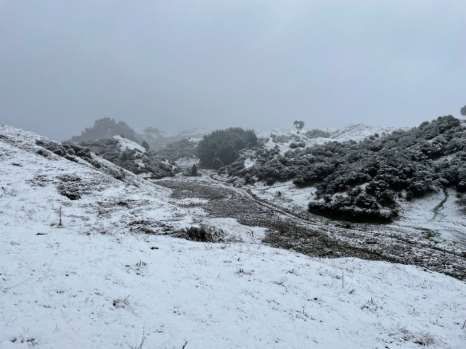
3        SLUI ACTIVITY
3.1      WHOLE FARM PLAN (WFP) PRODUCTION
         WFPs are a tool for bringing new land into the programme and for allocating grants to
         farms on various land types (priority land). An important part of maintaining the
         momentum of SLUI is the ability to bring new farms, new land and new work into the
         programme. This table shows the plans completed in SLUI’s life-to-date (LTD) and
         progress with bringing new plans into the programme.
Table 2: WFP production (life-to-date) – Correct at
30 June 2021

    No. of Plans       Hectares                                Comments
        795            575,000        WFPs completed in SLUI to 30 June 2020 – 51 plans
        42              22,869        Plans/ha mapped in SLUI in 2020-21
         0                 0          Plus plans/ha on list to be mapped in 2020-21
                                      Plans that were on the list to be mapped in 2020-21 but now
         7               4,283
                                      moved to 2021-22 financial year.

         Fifty plans were allocated to the contractor in 2020-21, with 42 completed, seven
         carried over to 2021-22 and one put on hold by the landowner.

         The seven plans (4,283 ha) carried over to this financial year will be first priority for
         mapping. There are 11 more plans on the list for this year so far, bringing the total
         allocated to 9,474 ha.

         A further eight plans (1,004 ha) were mapped by Horizons staff. These were a mix of
         paddock maps and extensions to existing farm plans.

3.2      WHOLE FARM PLAN ACTIVITY
         The contract targets focus on the number of plans completed and the activity of
         individual plans over the life of the programme. On an annual basis they provide
         another measure of SLUI activity. The number of plans active in any one year can and
         does change.
Farm Plan Activity For SLUI at July 2021
                                       900                                                                      900

                                       800                                                                      800

                                       700                                                                      700

                                       600                                                                      600
                Number of Farm Plans

                                       500                                                                      500

                                       400                                                                      400

                                       300                                                                      300

                                       200                                                                      200

                                       100                                                                      100

                                        0                                                                       0
                                             200 200 200 200 201 201 201 201 201 201 201 201 201 201 202 202
                                              6   7   8   9   0   1   2   3   4   5   6   7   8   9   0   1
       Cumulative Plans                      6   46 119 196 269 340 405 466 521 583 622 655 694 731 783 795
       Total plans done works LTD            0   11   36   84 151 195 256 318 358 421 473 527 569 612 647 677
       Plans done works                      0   11   32   72 122 131 180 205 195 257 257 298 301 314 310 271
       Active Plans                          0   11   36   84 151 187 238 285 311 353 375 419 441 456 470 469

Graph 1: Farm Plan Activity at July 2021 . Note this graph is not updated with all new
WFPs as at 30 June.

        Graph 1 looks at the farm plan activity as a whole and in any particular year. It is a
        “stacked column graph” where the orange, yellow and blue components of the column
        add up to the total number of plans in SLUI at the end of any given year. For example,
        in 2020-21 there were 795 plans completed over the life of SLUI, 677 had completed
        some works (85% active, up from 83% the year before), and 271 plans had
        completed some work in that year (i.e. 34% of plans active in 2020-21). The number
        of plans completing works is down from 310 in 2019-20 to 270 last year.

        The solid green line tracks “currently active” farm plans where active is taken to be
        “has completed works in the last three years”. The number of “currently active” plans
        at the end of 2019-20 was 470 (60%). In 2020-21 this decreased by one to 469.
        As expected, the data in Graph 1 shows a trend of more active plans (yellow stacked
        column) as we bring on 40-50 new plans per year. The number of plans active in any
        given three-year period (green line) has slowed. While to some extent this reflects
        older plans dropping off and becoming less active this year, we have had a number of
        new staff join the team and we have a number of claims that were not completed by
        the end of the financial year; while many of these will already have been “active”
        some would have added to the “currently active” set.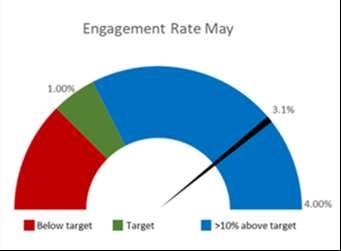
The plans that have done works this year dropped from 310 in the previous year to
                 271 in 2020-21. Active plans that have done works at least once in the last three
                 years decreased from 470 to 469. This was a result of staff prioritizing distribution of
                 the additional poles available for winter 2021 and deferring claim processing as a
                 result, rather than fewer farms doing works. Approximately 60 pole claims and 40
                 riparian fence claims were rolled over from last year to this year and if these claims
                 had been completed the numbers would have been higher.

3.3              SLUI LIFE-TO-DATE AND OUTCOMES
                 SLUI life-to-date annual works completed are shown in Graph 2.

                                                   SLUI Work 2007 to 2021
              8,000

              7,000

              6,000

              5,000
                                                                                                   Other
  Area (ha)

              4,000                                                                                On-Farm Conservation
                                                                                                   Retirement
              3,000
                                                                                                   Afforestation

              2,000                                                                                Target

              1,000

                 0
                      2007 2008 2009 2010 2011 2012 2013 2014 2015 2016 2017 2018 2019 2020 2021
                                                    Year Ending

Graph2: SLUI works completed by work type during the life of the programme against
annual contract targets (red line). See Graph 3 for the change in job status through the
year.

                 Each year since 2010 the contract target for hectares of works completed has been
                 exceeded.
                 The most work was completed last year with just over 7,000 ha of work. Afforestation
                 and retirement made up the bulk of the work.
                 The notable years for afforestation were 2013, when there was a high level of uptake
                 for the Afforestation Grant Scheme, and 2020, when there was a large amount of
                 carbon and carbon/timber forestry established.
Retirement programmes also peaked in 2013 and 2020. In 2013 this was due to a large amount of jointly funded Ngā Whenua Rāhui work completed in the Whanganui and Whangaehu catchments. In 2020 a large contribution was due to one major retirement project in the upper Rangitīkei Catchment with 1,315 ha completed, which was 50% of the total retirement work. On-farm conservation (purple) is predominantly space planting and gully planting with poplar and willow poles but also includes structures and earthworks. It is consistently about 500-1,000 ha per year and the limitation is largely pole supply. In the 2020-21 financial year there were approximately 60 pole claims outstanding and the works completed dropped to 404 ha. Pole supply has increased by around 5,000 poles for the 2021-22 financial year (approximately 15% increase). It is noted that pole supply is expected to be lower next winter for work in the 2022-23 financial year. At the current rate of progress, analysis suggests it will take 112 years to carry out works on all the top priority land that is currently in pasture. This calculation is based on completing approximately 3,000 ha of work per year with 1,000 ha on top priority land, about 500 ha of which is in pasture. The other 500 ha is retirement of existing tree-covered land. All the high priority land that is currently in pasture is estimated to take 252 years of works. Outcomes for SLUI have been modelled by Manaaki Whenua Landcare Research (MWLCR) and this work was reported for Horizons in the 2019 State of Environment Report (SOE) at page 19. https://www.horizons.govt.nz/CMSPages/GetFile.aspx?guid=a77bc2a4-381f-4660-8ef9- 4e2486ac7165 The Science and Land teams are working with MWLCR to update their modelling, which should be completed by June 2022. This work is focusing on modelling the outcomes of SLUI in relation to sediment in rivers, including the new targets of the National Policy Statement for Freshwater Management (NPS-FW). The work is scoped to investigate the impact of SLUI life-to-date i.e. if it continues at a similar pace or if it were doubled in pace, and what the impact of climate change would be on the mid- century and end-of-century outcomes. This is understood to be the first piece of work in New Zealand linking a land management programme with the NPS targets and climate change.
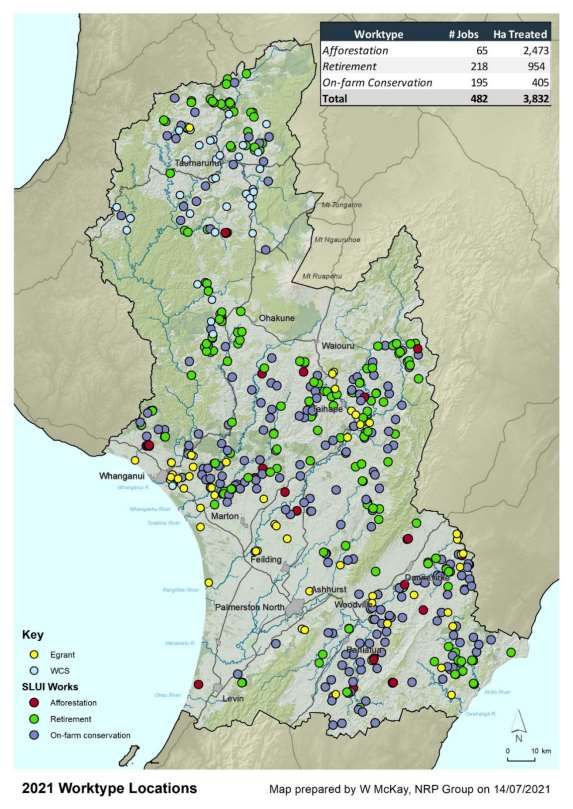
Map 1: Location of all grant works completed this financial year (SLUI and Regional and
Coast) . Note the hectares completed does not include the Regional Grant and WCS works.
3.4        YEAR-TO-DATE ACHIEVEMENTS
           The table below shows the types of works completed and claimed in the 2020-21
           financial year.
Table 3: Works year-to-date completed and claimed, by g rant amount and land priority
                                                                              Hectares By Land Type

                                                                     Not                    High         Top
                                                         Other                 Erodible                             Total
    Work Type       Claims     Farms       Grant $                 Erodible                Priority    Priority
                                                         (ha)                    (ha)                                Ha
                                                                     (ha)                   (ha)        (ha)

    Afforestation     65         39        857,663        25.7       229.4      1,046.8     896.8       274.5      2,473.2

    Retirement        77         65        539,233        8.0        43.0        198.7      198.5       174.3       622.4
     Riparian
                      115        81        727,612        1.4        43.3        91.9        40.5       119.3       296.4
    Retirement
     Wetland
                      25         23        118,368        0.0        13.3        20.3         0.5        0.8        35.0
    Retirement
     Managed
                       1          1         3,168          -          0.0         0.4          -           -            0.4
    Retirement
    Pole Planting     196       195        266,079        5.8        16.3        249.4       90.8        42.6      404.8¹

       Other           3          3        47,745          -           -           -           -           -             -

       Total          482       288      2,559,869       40.9        345.3      1,607.6    1,227.1      611.6      3,832.4

¹        As noted in Sections 4.2.5 and 4.3.6 – more poles went into the ground but approximately 60 claims are still
         to be completed; this may equate to approximately 5,000-6,000 poles, 150 ha of work and $70,000 grant
         cost.

           The 3,832 ha of works completed and claimed is 124% of the Annual Plan full-year
           target of 3,100 ha and 125% of the TUR Contract target

           Hectares completed by land type shows 1,839 ha (48%) of work claimed to date this
           financial year is on High priority and Top priority land. The bulk of this work has been
           completed on afforestation projects.

           There have been 482 claims completed on 288 farms. This is fewer than last year, a
           record year, but there are still potentially 60 pole claims and 40 fencing claims
           outstanding.

           There was 168 km of fencing completed, 2.8 million trees planted including 41,000
           riparian plants in the 2020-21 financial year.

3.5        FORECAST VS ACTUAL                           (TARGETS VS ACTUAL BY WORK TYPE)
           Table 4 shows the forecast and actual figures against target for
           2020-21. The work programme is fluid and changes throughout the year. Some
           changes are due to postponements or cancellations and some are due to new plans
           coming on-stream and bringing in new work programmes. The dollars shown in the
           table are the grant cost. It is unclear yet how Central Government’s Freshwater rules
           governing river fencing will affect the work programme but it is likely more riparian
           fencing will be completed and requests for funding will increase, although this is
already over-allocated. Further ahead, farmers may choose to redirect funding from
afforestation or other works to riparian protection, and as a result the programme
may struggle to meet some targets.
Table 4: Work during 2020-21 fi nancial year (contract vs forecast vs actual by hectares
and dollars).
Hectares Dollars $ x 1,000
Contract Forecast Actual Actual Contract Forecast Actual Actual
Work Type Target vs Target vs
Contract Contract
Afforestation 1,250 1,475 2,473 +1223 939 1,056 858 -81
Retirement 600 714 622 +22 261 819 539 +278
*A
Riparian Retirement 220 573 332 +111 357 1,672 846 +489
Managed Retirement 85 17 0.4 -84 25 27 3 -22
Space Planting &
900 665 404 -496 398 315 266 -132
Gully Planting
Structures/Earthworks 10 1 0 -10 60 7 0 -60
Other (inc. blank) 0 35 0 0 63 25 48 -15
Total *B
3,065 3,480 3,831.4 +767 2,103 3,921 2,560 +457
*A – includes wetland retirement
*B – Annual Plan Target is 3,100 ha, SLUI Contract Target is 3,065 ha.
SLUI Forecast and Claimed Works
5,000
4,000
Area (ha)
3,000
2,000
1,000
-
As at November
As at March 1 Year End 2021 2021-2022 year
1
Proposed 3,254.00 1,260.00 2,978.00
On-Track 1,135.00 874.00 591.00
Claimed 380.00 1,216.00 3,832.00
Total 4,769.00 3,350.00 3,832.00 3,569.00
Target 3,100.00 3,100.00 3,100.00 3,100.00
Graph 3: Changes to SLUI job status through the year and works allocated for the next
financial year. “On-track” means the Land Management Advis er has re-confirmed the work
with the landowner or i s confident the work will proceed . Graph 3 updates T able 4 with
more recent forecasts.Table 4 compares contract target (ha and $) to forecast and actual. Individual work
targets can vary widely, i.e. in reality the contract was to deliver 3,065 ha and the mix
of work types will change from year to year. Graph 3 tracks the changes in amount of
work and the certainty of that work being completed over the course of the year and
into next financial year, as understood through conversations with landowners.
Graph 3 shows that jobs allocated for the 2021-22 financial year sit above the target
at 3,569 ha. On-track works are largely those carried over from 2020-21. We are still
actively seeking works for the year.
3.6 JOINT VENTURE FORESTRY OPERATIONS
Horizons has interests in 10 joint venture (JV) forests (under a registered Forestry
Right) with a net stocked area of 1,387 hectares. A report on these forests was
provided to Council in April 2017. Work and expenditure in the forests includes rates
and insurance payments, maintenance of tracks and fences, pest control, audits and
inspections, monitoring and measurements, arranging silviculture, valuations for
external audit, maintaining ETS registration and reporting, and liaising with
landowners.
The Silviculture Contract with Penetito Forestry has been extended for a further two
years. This was agreed through the contract negotiations and procurement process
carried out and reported to Council in PX 19-200. A works plan for 2021-22 has been
written and agreed.
Thinning operations on Seddon’s forest have been completed. This operation required
use of a contractor to manage roading stop/go operations for trees on the road edge.
Wright’s and Thompson’s thinning was completed along with Thompson’s track
maintenance.
Forest 360 have completed plotting for carbon measurement.
Consultant Allan Bell completed a forest audit, checking our plotting and growth
measurements were being carried out appropriately.
Orme and Associates were engaged to carry out forest valuation work which was
completed in mid-June in order to meet end-of-year reporting requirements.
Pricewaterhouse Coopers have been engaged to report on a number of the forestry
issues, including how these forests are accounted for within the Horizons financial
system, accounting treatment of the valuation and how we report on potential income
and costs (including provision for replanting), and management and accounting
treatment of carbon. This report is nearing completion.4 REGIONAL AND COAST, WHANGANUI
CATCHMENT STRATEGY (WCS) AND
WHANGANUI RIVER ENHANCEMENT TRUST
(WRET)
4.1 PROGRESS ON ENVIRONMENTAL GRANT FUNDING
AND ADVICE
Environmental Grant funding is in place to support landowners to undertake works
that will reduce erosion and protect the environment. This funding is targeted slightly
differently between the Regional Land and Coast (RL&C) environment grant and the
Whanganui Catchment Strategy (WCS) grant. Under the WCS, support from
Whanganui River Environmental Trust (WRET) enables a greater variety of work to be
funded and at higher grant rates in some areas.
Table 5: Work area and budget expenditure 2020-21 – Correct at 30 June 2021
WORK AREA (ha) BUDGET ($)
Grant AP AP % AP AP %
Allocated Complete Allocated Complete
Type Target Complete Budget Complete
WCS 75 137 96 123 113,000*1 187,645 116,947 103
RL&C 100 151 101 114 80,000 138,691 77,185 96
Total 175 288 197 118 193,000 326,336 194,132 101
Note *1 - this is $50,000 Horizons and $63,000 WRET
WRET allocation of grant funding for the 2020-21 financial year was $63,000, with a
share cost invoiced to WRET of $61,508. This left a WCS grant cost to Horizons of
$55,439, slightly over budget.
Of the 100 projects completed, 51 were for pole planting, 21 riparian retirement and
nine for retirement.
The 51 pole planting projects totaled 3,891 poles.
Eighteen of the 21 riparian projects were completed in the WCS area, reflecting the
WRET commitment to these projects and the greater emphasis of riparian projects by
the Land team in this area with the Freshwater Team supporting other parts of the
region.
Eight afforestation projects were completed with 20,281 trees established.
It is noted that Dick Lancaster has stood down from the Taumarunui Sustainable Land
Management group due to health reasons. Dick has been the mainstay of the group
since its inception and his drive and influence will be missed.4.2 INDUSTRY PARTNERSHIPS
BALLANCE FARM ENVIRONMENT AWARDS (BFEA)
The local organising committee for the BFEA programme met in late May with Nadine
Olsen as the new coordinator. Entrants are open for the 2021-22 year and the BFEA
website has been updated to give potential entrants more information regarding the
process. Ballance Farm Environment Awards (nzfeawards.org.nz)
POPLAR AND WILLOW RESEARCH TRUST (PWRT)
The PWRT held a meeting in May and planned an extra meeting in mid-July to discuss
future planning, including long-term funding.
PWRT has used the new funding from the One Billion Trees programme to support
wider extension programmes with a workshop for regional council staff pm pole
planting, varieties, site selection and planting to be held in Masterton in September.
Land Management Advisor Weston Brown has supported the PWRT set up a new trial
site near Taumarunui which will evaluate establishment and growth of three-metre
poles, stakes and rooted cuttings.
BEEF AND LAMB NEW ZEALAND (BLNZ)
Staff attended two further BLNZ workshops covering farming and the ETS. BLNZ has
engaged Forest 360 to present to farmers about how the ETS may affect them and
Horizons staff have attended to clarify funding available through our grant
programmes.
The winter grazing campaign, a multi-funded project between industry bodies and
regional councils, continued this year.
The June update follows:
What was done in April & May?
Three advertisements were placed, in Central Rural Life (CRL), Southern Rural Life
(SRL) & Farmers Weekly.
Eight news stories were written and published (2 in B+LNZ eDiary, Rural Co
and Canterbury Farming, CRL and SRL)
Ten good management practice resources were shared through B+L social
media & eDiary.
What was happening in June?
Seven advertisements in Farmers Weekly, CRL & SRL
Fourteen good management practice resources
Three news stories.How are we tracking compared to last year? Beyond expectations with both metrics far above target levels for May 2021: Target ranges (green) are based off last year’s results. OTHER Staff attended and presented at a number of events including farm discussion groups and farmer visits. Central Government’s Freshwater rules, especially intensive winter grazing and the low-slope map for river fencing, have continued to dominate discussions. Staff attended the Horizons Oranga Wai meetings in Kimbolton, Taihape, Ohakune, Taumarunui and Whanganui, and report good landowner attendances. Land staff were on site at the Horizons display at the Central Districts Field Days. Where appropriate staff supported catchment care groups including Whangaehu, Otinui, Pohangina, Upper Manawatu, and others. Staff presented on erosion and land-use issues in the Whanganui Catchment to Lincoln University students on their annual North Island field trip. All Land Team were on site for a training day for planting poles. The day started at the Woodville Nursery and covered pole handling, health and safety, trailer loading and load security, before going on-farm to cover pole variety selection, siting and planting. We have five staff in their first year of advising farmers on poles so this was a very important opportunity for experienced staff to pass on their knowledge.
Photo 2 – Staff training in pole planting – Oroua catchment, London’s Ford. Photo:
Sara Mathieson.

4.3    SOIL HEALTH
       Soil Quality Monitoring (SQM) continued during autumn with 12 SMQ site visits
       between May and June. Nine of these sites were originally visited in Autumn 2016 and
       these were the first repeat visits.

       SQM site visits were undertaken on a range of land-use types including dairy, sheep,
       trees, dry-stock and vegetable farms. There was a particular focus on including
       vegetable farms, with three new sites added to the programme during the autumn
       2021 run. One was on Manawatu series soil (Recent) on the lower river flats in
       Palmerston North and two were on Ohakune series soils (Allophanic) between Raetihi
       and Ohakune.

       Samples from the autumn 2021 run have been sent to Manaaki Whenua Landcare
       Research (MWLCR) for analysis. Once these results are back, letters will be written to
the landowners to present and interpret the results. Visual Soil Assessments (VSAs)
conducted on the autumn 2021 SQM sites have been completed with eight able to be
compared to 2016 results. On average, the results indicate the Kairanga and
Tokomaru silt loam sites had improved their soil structure, colour and worm count in
spring 2021 compared with spring 2015. This appears to relate to a more favorable
preceding winter-spring, as well as a longer interval since the sites had been
cropped.
Full analysis of the soil physics, soil chemistry and VSA results will be conducted over
the coming months. Preliminary analysis of the VSA results shows that, SQM sites
generally have improved over time. This is likely related to the length of time under
pasture or a longer interval since the sites have been cultivated. Soil quality has been
shown to decline with increasing frequency of cultivation (Taylor et al. 2017). This is
highlighted by the decline in VSA scores for sites 16, 17 and 23 where the soil is subject
to continuous cultivation with little to no rest periods. The SQM programme aims to
share and explain soil quality information to landowners, to help influence land
management decisions.
4.4 SUPPORT FOR CONSENTS AND COMPLIANCE
Advice to landowners regarding the need for consents or compliance for a number of
activities which may be permitted or require consent, including:
One on vegetation clearance where a consent was required,
One on vegetation clearance where no consent was required,
One on tracking/earth disturbance on land in the hill country zone where consent
was required.5 NURSERY
5.1 WORK PROGRAMME TO DATE
WRET-supported nurseries in the Ruapehu District:
A small number of poles were harvested from the Manunui Nursery and a small
number of private grower poles will be available,
The WRET-funded nurseries are on track for harvest next winter.
Woodville:
The bulk of this year’s Horizons supply will be from the Woodville nursery. Harvest
started in the first week of June with the contractor’s crew ranging from 2-4 staff,
two being experienced workers. By the end of June 10,800 poles had been cut,
trimmed, sorted and stacked ready for distribution;
One truck and trailer load of poles and sleeves was delivered to Taihape (Photo 2),
with poles for both Taihape and Taumarunui deliveries.
Photo 3 – Bulk pole delivery from Woodville Nursery to Taihape depot. Photo: Sara
Mathieson. A number of shelterbelts need to be removed but finding contractors is
problematic as there are no contractors willing or able to do the full job;
Waste piles have been burnt and in future there will be more of an emphasis on
mulching as much material as possible;
Investigation into irrigation development continues and we have an estimate for
construction of a water storage dam, but are having difficulty getting confirmation
of water supply and dam liners from Tararua District Council;
A plant seedling storage area has been completed and is being utilised by the
Freshwater team to store bulk plant supplies for delivery to individual riparian
projects;
The pole storage system has now been in place for three years and is working
well. Individual bays contain bundles of poles that can be labeled with variety,
number in the bay and date cut so that staff will pick up the oldest poles and
record the number they have taken. The sprinklers placed on the tops of the bay
posts allow poles to be kept moist without being oversoaked.
Photo 4 – Pole storage bays at Woodville Nursery with each bay displaying
information on number of bundles, variety and date cut. Photo: Sara Mathieson.Bulls:
The Woodville harvest contractors were also completing the Bulls harvest. The
team switched from Woodville to Bulls in mid-June with completion due for the
end of June. An estimated 4,800 poles will be cut;
An outdoor cold shower has been installed for any chemical spills;
There was an attempted break-in to the shed. The area has been reinforced and
we have purchased two security cameras with one installed as a trial;
A newly-cleared area is being prepped for planting in willow stakes this spring.
Weber:
There will be a small harvest of 250 willow poles from Weber this winter;
We are reviewing our management of this area. The land is leased from Tararua
District Council and, if we decide to relinquish the lease, the area will have to be
cleared and
re-grassed.
5.2 ACTIVITY DURING JULY-SEPTEMBER
During July-September staff will:
Complete the SLUI WFP contract allocation to LandVision – at July 1 they had
been allocated 17 properties totaling 9,474 hectares with a further 11 properties
totaling 7,617 hectares to allocate. These will be assessed and allocated based on
Top priority farms first;
Update the grant allocations for the SLUI works programmes – currently 356 jobs
totaling 3,569 hectares are allocated to 2021-22 but most staff have yet to record
their pole-planting jobs. This indicates that we are going into the year with SLUI
more than fully allocated. Staff will continue to assess new jobs and add to this
during the 2021-22 year as past experience tells us some jobs will drop off, and
Council-approved use of reserves will allow for some over-allocation;
Update the Egrant and WCS allocations for works programmes – currently 25
Egrant jobs totaling 48 hectares, and 20 WCS jobs totaling 51 hectares;
Finalise the Forestry report undertaken by PWC with a draft already commented
on;
Continue to cost and firm up the Woodville Nursery irrigation development;
Finalise a project with Manaaki Whenua Landcare Research on an update to the
Sednet model incorporating all Land Management programmes i.e. not just SLUI; Continue with the pole sales and delivery, and assist and demonstrate planting.
This will be a major component of the
July-August workload;
Only carry out claim processing if contacted by landowners as this is a lower
priority than completing winter planting programmes;
Keep in contact with landowners carrying out afforestation programmes with 45
programmes at this stage totaling 1,131ha of afforestation ranging in size from 1-
140 hectares;
Deliver plans completed in the 2020-21 financial year. This involves working
through the information in each plan and discussing possible work programmes. It
may also include
on-farm inspections;
Complete end-of-year reporting for Annual Report, Contract Milestone reporting,
and Whanganui River Enhancement Trust;
Set a date for SLUI Advisory Group meeting.You can also read