Leading the Transformation - 2021 Virtual Analyst and Investor Conference of Volkswagen Aktiengesellschaft - Volkswagen AG

Page created by Leroy Gibson
 
CONTINUE READING
Leading the Transformation - 2021 Virtual Analyst and Investor Conference of Volkswagen Aktiengesellschaft - Volkswagen AG
Leading the Transformation
2021 Virtual Analyst and Investor Conference of
Volkswagen Aktiengesellschaft

16.03.2021
Leading the Transformation - 2021 Virtual Analyst and Investor Conference of Volkswagen Aktiengesellschaft - Volkswagen AG
Disclaimer

The following presentations as well as remarks/comments and explanations in this context contain forward-looking statements on the business
development of the Volkswagen Group. These statements are based on assumptions relating to the development of the economic, political and
legal environment in individual countries, economic regions and markets, and in particular for the automotive industry, which we have made on the
basis of the information available to us and which we consider to be realistic at the time of going to press. The estimates given entail a degree of
risk, and actual developments may differ from those forecast. Any changes in significant parameters relating to our key sales markets, or any
significant shifts in exchange rates or commodities relevant to the Volkswagen Group or deviations in the actual effects of the Covid-19 pandemic
from the scenario presented will have a corresponding effect on the development of our business. In addition, there may be departures from our
expected business development if the assessments of the factors influencing value enhancement and of risks and opportunities presented develop
in a way other than we are currently expecting, or if additional risks and opportunities or other factors emerge that affect the development of our
business.

We do not update forward-looking statements retrospectively. Such statements are valid on the date of publication and can be superseded.

This information does not constitute an offer to exchange or sell or an offer to exchange or buy any securities.

                                                                                                                                         16/03/21   2
Analyst and Investor Conference 2021

  Dr. Herbert Diess       Frank Witter              Helen Beckermann         Dr. Christian Dahlheim   Dr. Arno Antlitz

  Chairman of the Board   Chief Financial Officer   Head of Group Investor   Director Group Sales     CFO AUDI AG (Incoming
  of Management           Volkswagen AG             Relations Volkswagen     Volkswagen AG            CFO Volkswagen AG)
  Volkswagen AG                                     AG

                                                                                                                         16/03/21   3
We are fully focused and in execution mode to become a tech company!

                            • We delivered robust results
   2020 has been an
                            • We successfully started our BEV ramp up also in the volume segment
   unprecedented
   challenging year, but…   • We have laid the important groundwork to becoming a software-enabled
                              car company

                            • We are in full execution mode
   There is much more to
                            • We will continue to scale up our platforms
   come…
                            • We are very confident of our ability to be a winner in the transformation

         We continue to fully stick to our Strategic Targets for 2025!

                                                                                                          16/03/21   4
Financial Highlights – Volkswagen Group
(January to December 2020 vs. 2019)

Sales revenue                                                       Operating profit1)                    Profit before tax            Dividend proposal2)
  [€ million]                                                         [€ million]                          [€ million]                  [€/share]

                          -11.8%                                                            -45.0%                                                  Payout ratio
                                                                                                                         -36.4%
            252,632                                                              19,296                                                        18%           29%
                                                                                                                 18,356
                                 222,884
                                                                                                                                               4.86          4.86

                                                                                                                              11,667
                                                                                                 10,607

              2019                  2020                                           2019          2020             2019        2020             2019          2020

1) Before special items   2) Per preference share. Per ordinary share 4.80 (2019: 4.80) €                                                                          16/03/21   5
Volkswagen Group – Analysis of Operating Profit 1)
(January to December 2020)

[€ billion]
                                             Passenger Cars 2) 3)
      19.3

                            -7.4

                                                                                                              -1.7
                                                                                            3.8                                      0.0   -0.5                   10.6
                                                 -2.0                                                                                                -0.2                                    9.7
                                                                                                                                                                                -0.9
                                                                      -0.6

Jan-Dec 2019 Volume/                         Exchange Product Costs Fixed Costs                          Commercial     Power      Restructuring   Financial   Jan-Dec 2020 Special Items Jan-Dec 2020
  Operating   Mix/ Prices                     Rates /                                                     Vehicles** Engineering**                 Services      Operating                  Operating
Profit before                               Derivatives                                                                                            Division    Profit before                  Profit
Special Items                                                                                                                                                  Special Items

1) All figures shown are rounded, minor discrepancies may arise from addition of these amounts.   2) without FS   3) including PPA                                                         16/03/21      6
Automotive Division – Analysis of Net Liquidity 1)
 (January to December 2020)

 [€ billion]
                                                        Net Cash flow (€ 6.4 bn)
2019 19.4                          -1.9                      -0.7                      3.6            9.9         -6.3           0.0          -2.4       -0.2     21.3

                                                                                                                                 3.0          -2.4               26.8
                                                                                                                  -1.0                                   -0.4
                                                                                                      7.0
         21.3
                                   -2.5
                                                                                       3.0
                                                             -1.2

                                                                               Clean Net Cash flow before
                                                                                    Diesel and M&A
                                                                                      (€ 10.0 bn)

       Dec-19                   Diesel                     M&A                    China            Operating    Leasing      Hybrid Bond   Dividend to   Other   Dec-20
                               Outflow                                           Dividend          Business    Payment /                     VW AG
                                                                                                               Change in                   Shareholder
                                                                                                               Liabilities
 1) All figures shown are rounded, minor discrepancies may arise from addition of these amounts.                                                                 16/03/21   7
With a robust business model we strive for upside potential

                                                                                                                                     (Set in 11/20!)
                                                                                       2019       2020              2021                 2022               2025
  Key Financial Targets                                                                Actual    Actual           Outlook            Interim Targets   Strategic Targets

  Operating return on sales                                                             7.6%      4.8%           5.0 - 6.5%            6.0 - 7.0%         7.0 - 8.0%
  Before Special Items

  Return on investment                                                                 11.2%      6.5%             > 9.0%             10.0 - 12.0%         > 14.0%
  Automotive Division before Special Items

  CapEx ratio                                                                           6.6%      6.1%             ~6.0%                6.0-6.5%            ~6.0%
  Automotive Division

  R&D cost ratio                                                                        6.7%      7.6%             ~7.0%                6.5-7.0%            ~6.0%
  Automotive Division

                                a) Net Cashflow1)                                  € 13.5 bn.   € 10.0 bn.       > € 10 bn.            > € 10 bn.         > € 10 bn.
  Cash
  Automotive
  Division                                                                                                    moderately above                         ~10% of Group
                                b) Net Liquidity                                   € 21.3 bn.   € 26.8 bn.                             > € 20 bn.
                                                                                                             previous year's level                       turnover

1) Excluding Diesel payments and M&A.
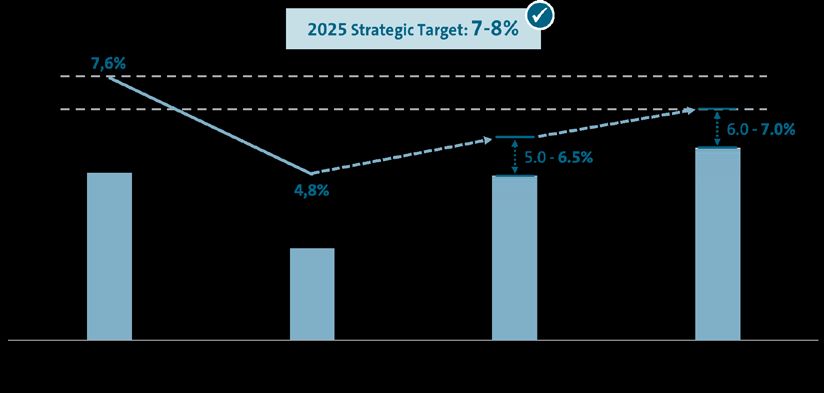
Please note: Navistar not yet included. The transaction is targeted to close in mid 2021.                                                                       16/03/21   8
Financial Outlook 2021
Operating result, operating return on sales

Volkswagen Group, before special items
[in €bn. / %]                             2025 Strategic Target: 7-8%
                        7.6%                                                         Strategic Corridor
       8%

       7%
                                                                                                 6.0 - 7.0%
                         19.3                                           5.0 - 6.5%

                                         4.8%

                                         10.6

                        2019             2020                 2021 Outlook           2022 PR 69 Target1)

1) Status as of mid-November 2020                                                                     16/03/21   9
Financial Outlook 2021 – Key Drivers of Performance
Further market recovery and continued discipline on the cost side

   Sales and revenue momentum
   (e.g. from product launches, BEV ramp-up)                    Operating result, operating return on sales

   Investment and cost discipline to secure
   operating results

   At the same time, no compromise when it comes
   to product investments in future technologies

   Strong net cashflow and liquidity focus

                            Ambition 2022: Re-entry into the strategic corridor of     7-8%

                                                                                                              16/03/21   10
With a robust business model we strive for upside potential

                                                                                                                                     (Set in 11/20!)
                                                                                       2019       2020              2021                 2022               2025
  Key Financial Targets                                                                Actual    Actual           Outlook            Interim Targets   Strategic Targets

  Operating return on sales                                                             7.6%      4.8%           5.0 - 6.5%            6.0 - 7.0%         7.0 - 8.0%
  Before Special Items

  Return on investment                                                                 11.2%      6.5%             > 9.0%             10.0 - 12.0%         > 14.0%
  Automotive Division before Special Items

  CapEx ratio                                                                           6.6%      6.1%             ~6.0%                6.0-6.5%            ~6.0%
  Automotive Division

  R&D cost ratio                                                                        6.7%      7.6%             ~7.0%                6.5-7.0%            ~6.0%
  Automotive Division

                                a) Net Cashflow1)                                  € 13.5 bn.   € 10.0 bn.       > € 10 bn.            > € 10 bn.         > € 10 bn.
  Cash
  Automotive
  Division                                                                                                    moderately above                         ~10% of Group
                                b) Net Liquidity                                   € 21.3 bn.   € 26.8 bn.                             > € 20 bn.
                                                                                                             previous year's level                       turnover

1) Excluding Diesel payments and M&A.
Please note: Navistar not yet included. The transaction is targeted to close in mid 2021.                                                                       16/03/21   11
CFO Agenda: Focus on financial steering of the transformation

Strategic CFO Targets                             CFO Focus Areas

                                                   Focus on product transformation

      Focused financial steering                   Digitalization: Advancing in software/ autonomous driving / services
        of the transformation
   (allocation of resources to future topics)      Capturing group-wide synergies

                                                   Groupwide cost & efficiency programs

   Safeguarding and strengthening                  Brand positioning/ pricing
       our financial foundation
    (… for continued investments in future
  technologies such as electrification, digital
     technology and autonomous driving)                          Acting based on integrity and values

                                                                                                                   16/03/21   12
Steering the transformation: Strong commitment to investment in new technology
  while keeping combustion engine cars competitive

  Investment in R&D/ CapEx1)                                                                              BEV Share Volkswagen Group
    in €bn                                                                                                    Worldwide, in % of sales

                                                   € 150 bn.
                                                                                                              100%

                                                                                                  Strong                                  ~20%
                                                      ~ 50%
   Share of            ~ 40%                                                                   commitment
electrification,                                                                                 to future               ~6%
digitalization                                                                                 technologies     3%
                     Planning                       Planning                Outlook Planning                      2020 2021                2025       2030/2031
                     Round 68                       Round 69                   Round 70                                                  (expected)   (expected)
                    (2020-2024)                    (2021-2025)                  (2022-2026)

  1) Strategic targets for R&D/ CapEx: 6% R&D, 6% CapEx (CapEx in validation)                                                                          16/03/21    13
Financing the transformation: Group-wide fixed cost initiative launched to provide
headroom for accelerating the transformation

Cost base of the program (w/o R&D, CapEx), Deliveries to customers
Volkswagen Group, Automobile division
Deliveries                              11     11      11
                          10
to customers                                                         9
[in mn. vehicles ]
                                                                         ~ -10%
Cost base
(w/o R&D, CapEx)                                                               -5%/ € 2 bn.
[in €bn. ]
                                                                                                         Financing our
                                                                                                         future:
                                                                                                         Continued
                                                                                                         volume growth
                                                                                                         while keeping
                                                                                                         overhead
                                                                                                         expenses under
                                                                                                         tight control
                        2016            2017   2018   2019         2020           2021         2023
                                                                Forecast,        Forecast     Ambition
                                                               Baseline for
                                                              cost reduction
                                                                                                               16/03/21   14
Step-by-step we will complement our current planning and steering of individual
brand performance with focus along value drivers                                                                              SCHEMATIC

                                  Strong
                                                   Volume                   Premium          Sports         Trucks     Strong positioning
                                  brands                                                                               of our China JV`s as
                                                                                                                       unique assets
                         Value drivers

BEV platforms

Software

Battery/ Energy/                                                                                                     Focus on
Charging                                                                                                             technology /
                                                                                                                     software roadmap
Mobility Platform                                                                                                    and mobility
                                                                                                                     services
Tech. Components

Group Services/
Financial Services

                                           Customers, brand positioning, performance programs, synergies, delivery

   In brand P&L/ books                                                                                                            16/03/21    15
Overall ambition: Leading the transformation with integrity and based on our values

                                       Strong brands

                  Financial strength
                                                                                BEV
         Integrity
                                                              Software

                                     AI / mobility services

                                                                                      16/03/21   16
You can also read