LEARNING ADVERSE EVENTS Te ako i ngā pāpono kōaro - Health Quality & Safety Commission
←
→
Page content transcription
If your browser does not render page correctly, please read the page content below
LEARNING            FROM
             ADVERSE EVENTS
             Te ako i ngā pāpono kōaro

Adverse events reported to the Health Quality & Safety Commission
                   1 July 2017 to 30 June 2018
Ngā pāpono kōaro i pūrongorongotia ki te Kupu Taurangi Hauora o Aotearoa i te
                  1 o Hōngongoi 2017 ki te 30 o Pipiri 2018
Published in December 2018 by the Health Quality & Safety Commission, PO Box 25496, Wellington 6146.
                                      ISBN (print) 978-0-908345-79-3
                                     ISBN (online) 978-0-908345-80-9
Citation: Health Quality & Safety Commission. 2018. Learning from adverse events: Adverse events reported to the
Health Quality & Safety Commission 1 July 2017 to 30 June 2018. Wellington: Health Quality & Safety Commission.
    This document is available on the Health Quality & Safety Commission website at: www.hqsc.govt.nz
                    This work is licensed under the Creative Commons Attribution 4.0 International License.
                    To view a copy of this license, visit http://creativecommons.org/licenses/by-nc-sa/4.0/
Acknowledgements | He mihi This report was prepared by the Health Quality & Safety Commission based on information and data provided by district health boards (DHBs) and other health and disability service providers. We acknowledge the experiences of the consumers and whānau affected by the events discussed in this report and we honour this with a commitment to learn and improve. We are grateful to everyone who has collectively contributed to this report; particularly those who have provided expert commentary and shared their experiences and learning stories relating to adverse events reporting, review and learning. Heather Gunter Mother of Matt Gunter Karyn Bousfield West Coast DHB Mo Neville Waikato DHB Paul Fake Wellington Free Ambulance Cheryl des Landes St John New Zealand Martin Carrell Pegasus Health Ann Rose Te Awakairangi Health Network Richard Whitney New Zealand Private Surgical Hospitals Association Acurity Health Group Barbara Ruby MidCentral Health Ngā pāpono kōaro i pūrongorongotia ki te Kupu Taurangi Hauora o Aotearoa i te 1 o Hōngongoi 2017 ki te 30 o Pipiri 2018 1
Foreword | Kupu whakataki

                          Adverse events have a devastating effect on consumers and their whānau. It is vital to
                          remember that every event described in this report has a person at its centre. Adverse events
                          reporting makes it possible to review each event, discover the reasons behind it and put
                          recommendations in place, with the aim of preventing anything like it from happening again.
                          It is important that health care providers enable a just culture where staff can report patient
                          harm, confident that the response will be to focus on learning rather than attributing blame.

    This, the 10th adverse events report published by the Health Quality & Safety Commission (the Commission),
    summarises adverse events reported between 1 July 2017 and 30 June 2018. As in previous years, numbers
    have increased, reflecting the ever-increasing maturity of health providers’ adverse event systems in New
    Zealand. It is important not to become complacent, however, as the events reported do not reflect the full
    amount of harm consumers have experienced.

    The aim of the Commission’s adverse events learning programme is to improve consumer safety by supporting
    organisations to report, review and learn from adverse events that occur in health and disability services. Its
    role is to promote a nationally consistent approach to reporting, reviewing and learning, and to share lessons
    learned nationally and across the health and disability sector.

    This is the first time since 2013 the Commission has reported on adverse events that occurred in the mental
    health and addiction sector. The Commission will use this information in the mental health and addiction
    quality improvement programme it is running. One of the aims of the programme is to support providers to
    learn from and reduce serious adverse events. We will achieve this aim by providing guidelines and facilitating
    timely, consistent reporting and reviews. Improving consumer involvement in adverse event reviews and
    sharing findings are also important.

    This has been the first year of reporting using the National Adverse Events Reporting Policy 2017,1 which has a
    stronger focus on involving consumers and their whānau in the review process. The policy is an important evolution
    in adverse event management in New Zealand. Consumers can provide insights into the circumstances of an
    adverse event that can shed greater light on what happened and lead to a deeper analysis of underlying causes.

    Adverse events reporting provides information about relatively infrequent episodes of individual harm within
    the health system. It is not a good way to measure the overall quality of a health system. Adverse events tend
    to be under-reported and providers vary in the way they classify events. Because of this, other data should
    be used to measure the success (or otherwise) of quality improvement initiatives. For example, quality and
    safety markers2 are one of the measures the Commission uses to evaluate the success of quality improvement
    programmes and determine if practices have changed and if harm and cost have reduced. The value of
    adverse events reporting is that it highlights the sorts of things that are going wrong in health care and cause
    preventable harm. Analysing these reports can show areas in which improvements need to be made. The
    Commission does have to prioritise the use of its limited resources, but it has programmes or initiatives that
    address many of the problems identified in this report.

    I would like to acknowledge all those consumers and their whānau who suffered harm from the adverse events
    described in this report, and the staff who reported the events, which led to the learnings set out here. Together
    we must continue to learn from these tragedies and work to reduce the likelihood of harm happening to others.

    Professor Alan Merry onzm frsnz
    Chair, Health Quality & Safety Commission

    1 www.hqsc.govt.nz/our-programmes/adverse-events/national-adverse-events-policy
    2 www.hqsc.govt.nz/our-programmes/health-quality-evaluation/projects/quality-and-safety-markers

2                          Adverse events reported to the Health Quality & Safety Commission 1 July 2017 to 30 June 2018
Contents | Rārangi take Acknowledgements | He mihi 1 Foreword | Kupu whakataki 2 Executive summary | Whakarāpopototanga matua 4 Adverse events reporting 2017/18 4 Actions for improvement 5 Introduction | Kupu arataki 6 Chapter 1: Learning from adverse events reported by DHBs | Wāhanga 1: Te ako i ngā pāpono kōaro kua pūrongorongotia e ngā Poari Hauora ā-Rohe 7 Total DHB adverse events 10 Whole-of-system approach to safety 10 Delayed diagnosis or treatment 11 Pressure injuries 12 Patient deterioration 13 Perinatal and maternal adverse events 14 Healthcare associated infections 14 Preventing harm from falls 15 Always report and review events 17 Demographic information 18 Chapter 2: Learning from adverse events reported by other health and disability providers | Wāhanga 2: Te ako i ngā pāpono kōaro kua pūrongorongotia e ērā atu kaiwhakarato hauora, hauā hoki 20 National ambulance sector 21 Aged residential care 23 Primary care 23 Private surgical hospitals 24 Chapter 3: Mental health and addiction | Wāhanga 3: Hauora ā-hinengaro me te waranga 26 Why adverse events reporting is important in mental health 27 What we can learn from MHA adverse events reporting 28 MHA quality improvement programme 31 Learning from MHA serious adverse events and consumer experience 32 The Suicide Mortality Review Committee 33 Chapter 4: Adverse events learning programme | Wāhanga 4: Hōtaka ako pāpono kōaro 36 National Adverse Events Reporting Policy 36 Opportunities for improvement for the adverse events learning programme 36 Whānau Māori experience of adverse events 37 Adverse event review training 37 Types of adverse event reviews 38 National sharing of lessons learned 38 Quality of reviews 38 Appendix A: Adverse events learning programme expert advisory group 2017/18 | Āpitihanga A: Rōpū mātanga tohutohu mō te hōtaka pāpono kōaro 2017/18 39 Appendix B: Event codes | Āpitihanga B: Uhingaro pāpono 40 Ngā pāpono kōaro i pūrongorongotia ki te Kupu Taurangi Hauora o Aotearoa i te 1 o Hōngongoi 2017 ki te 30 o Pipiri 2018 3
Executive summary | Whakarāpopototanga matua

    This is the Health Quality & Safety Commission’s (the Commission’s) 10th national report on adverse events in
    the health sector. Each of the events discussed in this and previous reports has caused, or had the potential to
    cause, harm or death to a consumer or a member of their whānau. Reporting these events gives voice to those
    harmed and allows providers to review what happened and put in place measures to prevent consumers from
    suffering harm in the same way in the future.

    From 1 July 2017 to 30 June 2018, health service providers reported a total of 982 adverse events to the
    Commission. The range of providers included district health boards (DHBs), ambulance services, private
    hospitals, primary care providers, aged residential care providers and the Defence Force.

    The 982 reported events represent a significant increase over last year. The analysis suggests that several factors
    influenced this increase, including changes in reporting requirements, and the Commission’s quality improvement
    programmes placing a spotlight on specific areas. The range of events has also expanded to include ‘behavioural’
    adverse events reported from the mental health and addiction sector (see Chapter 3). In addition, staff have
    reported more events because DHBs have worked diligently to increase their ability to recognise and report
    adverse events. The 2017/18 year also saw the introduction of the ‘always report and review’ list, which has
    increased reporting of near misses.

    Most events reported were from DHBs, in line with their positive culture of data capture, reporting and review
    of adverse events. The next largest group to report was members of the New Zealand Private Surgical Hospitals
    Association (NZPSHA) – which is similarly a reflection on their positive reporting culture, as well as indicating the
    large number of New Zealanders who receive health care from private surgical hospitals. As in previous years, the
    ambulance sector has engaged with the Commission to report events, along with other providers that reported a
    small number.

    As noted above, this year, for the first time since 2013, we are including summarised data relating to reported
    mental health and addiction adverse events. This information will also be presented in the Director of Mental
    Health and Addiction’s annual report.³ It is important to note that reporting timeframes vary between the two
    reports, which means that numbers of events reported will differ. Only high-level categories (suspected suicide,
    serious self-harm and serious adverse behaviour) are presented, and the Commission plans to work with DHBs in
    the upcoming year on the most effective way to present these events in the future.

    Adverse events reporting 2017/18

    The adverse events reported for 2017/18 are based on the National Reportable Events Policy 2012 and the
    National Adverse Events Reporting Policy 2017.4 The 2017 Policy came into effect on 1 July 2017, with providers
    having 2017/18 as a transition year to allow them time to update internal policies and processes to reflect the
    revised national policy.

    3 The Office of the Director of Mental Health and Addiction Annual Report 2017 will be published in late 2018.
    4 www.hqsc.govt.nz/our-programmes/adverse-events/national-adverse-events-policy

4                             Adverse events reported to the Health Quality & Safety Commission 1 July 2017 to 30 June 2018
Of the 982 reported adverse events:
631 232 91 18 1 9
were reported were reported were reported were reported was reported were reported
by DHBs from the by members by ambulance from the by other
mental health of the services primary care providers
and addiction NZPSHA sector
sector
(DHBs only)
Of the 631 events reported by DHBs:
317 31 20 3 5 255
were clinical were were related were due were were harm
management healthcare to medication to medical consumer because of
events associated or IV fluid devices or accidents falls
infections equipment
Actions for improvement
To continue to improve consumer safety, and to support providers to improve their systems and processes, the
Commission intends to complete the following workstreams in 2018/19.
• Release examples of severity assessment codes (SACs)5 specifically for maternity providers, to
complement the more general examples available.
• Actively engage with the aged residential care and primary care sectors to improve reporting and
management of adverse events in these areas.
• Work with the Commission’s mental health and addiction quality improvement programme to learn from
serious adverse events and the consumer experience.
• Conduct a survey in 2019 to establish sector capabilities and needs in adverse events and help us support
the needs of health care providers.
• Begin a review to explore the impact of adverse events on whānau Māori. This information will be used to
develop guidance on how to provide culturally appropriate care for Māori during and after an adverse event
and during the review process.
• Review the existing adverse events training to ensure it meets sector needs.
• Deliver an adverse event master class that builds on the content of the existing two-day course.
• Develop a guide to help adverse event review teams decide which type of review methodology to use.
5 SACs range from 1 as the most severe to 4 as the least severe adverse event.
Ngā pāpono kōaro i pūrongorongotia ki te Kupu Taurangi Hauora o Aotearoa i te 1 o Hōngongoi 2017 ki te 30 o Pipiri 2018 5Introduction | Kupu arataki
In 2012 Heather Gunter lost her son Matthew as a result of complications following surgery to remove his
appendix. He should not have died, and many opportunities were missed to intervene.
Karyn Bousfield is director of nursing at West Coast DHB and was part of the team that reviewed Matthew’s death.
Heather and Karyn regularly present together at the Commission’s adverse event review workshops, telling Matt’s
story. They give consumer and provider perspectives on what went wrong and what can be learned from it.
Heather Gunter: ‘Matt was 15 when he developed appendicitis. I took him to the local emergency department
and he had surgery that night to remove his appendix. He had complications following surgery and stopped
breathing. This was managed in recovery and Matt was eventually transferred to the ward to recover, despite
me raising concerns about how aggressive he was and after he coughed up pink foam. I was quite worried
about him, but Matt didn’t want me to stay overnight, so I went home.
‘The following morning, we received a phone call to say that Matt wasn't breathing, and we rushed to be
with him. Matt was being resuscitated when we arrived and after being ventilated he was transferred to
Christchurch Hospital by air ambulance. They gave him a 5 percent chance of survival. After a few days Matt
had an MRI, which showed his brain was not getting any oxygen. After discussion with the doctors, the heart-
breaking decision was made to turn off his life support.
‘I really want people to understand that adverse events aren’t just about what happens there and then. Behind
every event is a real person, with a real family who experience a real impact. Matt had a future, and that was
taken away from him because things went wrong. I’m really clear
that we can never stop harm completely – people make mistakes and
systems sometimes fail – but we can reduce the risk of it happening The Commission would
again because, while humans make mistakes, we can definitely learn like to take this opportunity
from them.’ to formally thank Heather
Gunter and Karyn Bousfield
Karyn Bousfield: ‘As health care professionals, we come to work
for their bravery in sharing
wanting to do the right thing, but no person or system is perfect all the
Matthew’s story and
time. What happened to Matt was a real tragedy and when something
acknowledge the significant
goes wrong like this, you don’t hide from it – you stare it in the face. You
impact it is having on
acknowledge what’s happened and do something with it. Matt’s death
improving patient safety.
caused us to take a step back, look at our mistakes and system errors,
and learn from them.
‘It’s not about blaming individuals. Everyone makes mistakes, and the ripple effect from an adverse event goes
beyond family, friends and whānau – it impacts on the staff involved as well. The important thing is to learn
from it. As clinicians we never stop learning and we do that by communicating with and supporting each other,
and by being upfront, open and honest. We all have a responsibility to work together to improve the system.
‘When Heather and I present at workshops, our hope is to support a culture where it is the norm for health
professionals, those we care for, and their families and whānau to work together to prevent harm and improve
health outcomes.’
David Hughes, clinical lead, adverse events learning programme: ‘I showed Matthew’s video at a grand
round recently and a number of staff came up to me afterwards saying how deeply it had affected them. I
commented that it had reminded me of times in my career where the care I had been part of providing had
not gone well and that communication within teams and my ability to speak up for safety were lacking. These
regrets can stay with us for years.’
6 Adverse events reported to the Health Quality & Safety Commission 1 July 2017 to 30 June 2018Chapter 1: Learning from adverse events reported by DHBs | Wāhanga 1: Te ako i ngā pāpono kōaro kua pūrongorongotia e ngā Poari Hauora ā-Rohe This chapter provides an overview of adverse events that DHBs have reported and describes emerging themes. It is generally based on initial notification information only, which means analysis is less detailed than it would be with information from provider reviews. Provider reviews, however, take more time to complete and share with the Commission: providers first notify us of events using the adverse event brief (AEB): part A6 and then provide an AEB: part B7 once they have completed the review of the event. The part A form contains information based on the initial understanding of the event, along with basic demographic information about the consumer involved. The part B form contains a summary of findings and recommendations, with some providers choosing to provide the full, anonymised report. Providers vary in the timeliness and number of AEB: part Bs they provide. They reported 863 SAC 1 or 2 events to the Commission in 2017/18 (Table 1); of these, we received only 363 part Bs (42 percent) by the closing date for data reconciliation. We intend to work with providers to identify reasons contributing to this low return and support them in identifying sustainable solutions. The numbers reported in this chapter are based on reporting requirements from the National Reportable Events Policy 2012 and National Adverse Events Reporting Policy 2017.8 Please note that in some categories or classifications, the numbers are small and so figures should be interpreted with caution. Reported adverse events increased in 2017/18. DHBs reported a total of 631 SAC 1 and 2 events (excluding code 10 behaviour events), which is 16 percent more than the total number of adverse events reported in 2016/17. The Commission believes that DHBs are improving in their ability to recognise and report adverse events. Local and international literature suggests the incidence rate for adverse events sits at approximately 10 percent.9, 10, 11 Considering that not all adverse events are SAC 1 or 2 (the threshold for reporting under the 2017 Policy), the numbers reported to the Commission in 2017/18 are well below the total that could be expected; this indicates that providers are only identifying and reporting a small percentage of adverse events that actually occur. This suggests that the increase in the number of events reported in 2017/18 is due to an increase in reporting rather than necessarily indicating more consumers are being harmed. 6 www.hqsc.govt.nz/our-programmes/adverse-events/publications-and-resources/publication/2939 7 www.hqsc.govt.nz/our-programmes/adverse-events/publications-and-resources/publication/2940 8 www.hqsc.govt.nz/our-programmes/adverse-events/national-adverse-events-policy 9 Davis P, Lay-Yee R, Briant R, et al. 2002. Adverse events in New Zealand public hospitals I: occurrence and impact. New Zealand Medical Journal 115(1167): U271. 10 Vincent C, Neale G, Woloshynowych M. 2001. Adverse events in British hospitals: preliminary retrospective record review. British Medical Journal 322(7285): 517–9. 11 de Vries EN, Ramrattan MA, Smorenburg SM, et al. 2008. The incidence and nature of in-hospital adverse events: a systematic review. Quality & safety in health care 17(3): 216–23. Ngā pāpono kōaro i pūrongorongotia ki te Kupu Taurangi Hauora o Aotearoa i te 1 o Hōngongoi 2017 ki te 30 o Pipiri 2018 7
Table 1: SAC 1 and 2 adverse events reported by DHBs, by World Health Organization category, 2017/18

                                                                                                          DHB-reported SAC 1 and 2
     General classification of event                                     Event code
                                                                                                           adverse events 2017/18
     Clinical administration                                                   01                                          20
     Clinical process/procedure                                                02                                         289
     Documentation                                                             03                                           0
     Healthcare associated infection                                           04                                          31
     Medication/IV fluids                                                      05                                          20
     Blood/blood products                                                      06                                           0
     Nutrition                                                                 07                                           0
     Oxygen/gas/vapour                                                         08                                           0
     Medical device/equipment                                                  09                                           3
     Behaviour*                                                                10                                         232
     Consumer accidents                                                        11                                           5
     Falls                                                                     12                                         255
     Infrastructure/buildings/fittings                                         13                                           0
     Resources/organisation/management                                         14                                           8
     Total                                                                                                                863
    SAC = severity assessment code.
    * Behavioural events are included here for completeness; for further commentary on this category of adverse events, see Chapter 3, which discusses mental
    health and addiction adverse events.

    Health care is complex, and several underlying factors may contribute to any one adverse event. This
    complexity means that the principal category a provider chooses to report is subjective and may not reflect all
    contributing causes. For these reasons, the numbers shown in Table 1 and the commentary that follows should
    be considered with caution.

    The adverse events in the categories with the event codes 01, 02 and 14 are combined to produce a more
    general category of ‘clinical management events’. Clinical management events represent events that occur in,
    or impact on, the clinical environment.

    Clinical management events were the most common event type reported, accounting for a total of 317 events.
    This represents 50 percent of all non-behavioural adverse events that DHBs reported to the Commission. It is
    only a minimal change from 2016/17, when 52 percent of all reported cases were in this category.

    These events can be further classified to provide clinical context (Table 2). The more detailed classifications
    are dependent on the information available from providers (reported through AEB: part A and part B forms)
    but give a general indication of types of clinical management events that occur.

    Table 2 highlights that delays (104 events), pressure injuries (84) and deterioration (50) represent the three
    largest sub-groups of clinical management events.

8                              Adverse events reported to the Health Quality & Safety Commission 1 July 2017 to 30 June 2018
Table 2: Clinical classification of clinical management events reported by DHBs, 2017/18
No of
Clinical management event classification Description example (hypothetical)
events
Issue in referral process results in delay
Delayed diagnosis or treatment 104
seeing specialist or receiving treatment
Initial assessment did not find the key
Assessment and diagnosis 2
clinical issue
Insufficient clinic, equipment, staff or
Resources/organisation/management 1
appointments to meet demand
Consumer deterioration not recognised
Deterioration 50
or managed in expected timeframe
Complication of treatment or procedure
Complication 27
(eg, stroke following surgery)
Item left inside the body beyond
Retained item 8
expected time
Pressure injury from insufficient position
Pressure injury 84
change/nutrition, etc
Adverse outcome 33 Unexpected, consumer death or outcome
Incomplete process during care
Clinical process 0
(eg, consent, coordination of care)
Wrong consumer/site/side 7 Wrong consumer in procedure room/theatre
Monitoring 0 Inadequacy of monitoring
(eg, breathing rate after morphine given)
Other 0 Security issue
Allergic reaction to products used
Treatment 1
for treatment
Harm related to transfer of care between
Transfer 0
services or providers
Total 317
Only a short time was available to reconcile the data in this report with providers. As a result, much of the
national learning about emerging themes is not known at the time of publication. Any learning from further
analysis and discussion will be updated in later reports and through Open Book reports.12
12 www.hqsc.govt.nz/our-programmes/adverse-events/projects/open-book
Ngā pāpono kōaro i pūrongorongotia ki te Kupu Taurangi Hauora o Aotearoa i te 1 o Hōngongoi 2017 ki te 30 o Pipiri 2018 9Total DHB adverse events
The total number of adverse events that DHBs reported between 1 July 2017 and 30 June 2018 has increased
since the previous report, consistent with the general trend since 2006/07 (Figure 1).
Figure 1: Reported DHB adverse events (excluding code 10 behaviour events), 2006/07–2017/18
700
631
600
542
525 520
500 454
437
Number of events
400 370 365
343
300
300
248
200 181
100
0
2006/07
2011/12
2007/08
2008/09
2009/10
2010/11
2012/13
2013/14
2014/15
2015/16
2016/17
2017/18
Year
Note: As this figure does not include mental health and addiction adverse event numbers, numbers before 2013 will differ from those in
previous adverse events reports.
It is important to note that 83 events reported to the Commission in 2017/18 occurred in previous years. The
reason for the delay was either that events did not become apparent until some time after the initial event,
or that notifications from external agencies, such as the Health and Disability Commissioner, may have taken
some time to reach the provider. The Commission reports events in the year they were reported to us, as a way
of giving all consumers who have suffered harm a voice in this report. This number is in line with reporting from
previous years and reflects the work that providers, especially DHBs, are doing to identify consumers who may
have been impacted by delays in diagnosis or treatment.
Whole-of-system approach to safety
The nature of adverse events reporting is changing. This year, harm from falls is again the second-largest
category of adverse events (Figure 2), with numbers at similar levels to the 2016/17 year.
However, we are seeing an increase in clinical management events, which is now our largest category of
adverse event reports from the health sector.
10 Adverse events reported to the Health Quality & Safety Commission 1 July 2017 to 30 June 2018Figure 2: DHB adverse events (non-mental health), by event type, 2017/18
Falls;
255
Clinical management;
317
Healthcare associated Medication; Other;
infection; 31 20 8
Table 2 details the range of events that fit within this broad category. Clinical management events have a
combination of contributing factors. Addressing much of the harm reflected in these adverse events requires
complex measures: organisations need to work across their boundaries, and national agencies need to
collaborate to find system-level resolutions.
The Commission, ACC and the Ministry of Health are working together to reduce consumer harm across the
health system.
Delayed diagnosis or treatment
The 2016/17 report highlighted issues with the health system related to delays in diagnosis and treatment.
Following on from this, the Commission’s board requested that further work be done to better understand the
extent of the problem.
The Commission facilitated a workshop, ‘Exploring the “why” of clinical delays’, in February 2018. The 50 invited
participants included mortality review committee chairs; the Commission’s adverse events learning programme and
other expert advisory group members; DHB leaders; consumer representatives; Ministry of Health representatives;
Office of the Health and Disability Commissioner representatives; ACC representatives; and key Commission staff.
Each organisation discussed their slightly different role in the system and how this resulted in a different lens
and approach to delays. Each presented their data and talked about their work. There was agreement and
acknowledgment that a system-level view is required to deal with complex system problems, such as delays. Each
organisation brings a part of the jigsaw puzzle, and the most useful view of the system contains all the pieces.
The Commission took up the issue of complex problems requiring system solutions in A Window on the Quality
of New Zealand’s Health Care 2018.13 Published in June 2018, the Window 2018 noted:
We are now seeing issues that do not lend themselves to the sort of targeted methods and
single-organisation approaches widely used in recent years. New approaches are needed,
grounded in co-design with consumers, their whānau and the health workforce. (p 6)
13 www.hqsc.govt.nz/our-programmes/health-quality-evaluation/publications-and-resources/publication/3364
Ngā pāpono kōaro i pūrongorongotia ki te Kupu Taurangi Hauora o Aotearoa i te 1 o Hōngongoi 2017 ki te 30 o Pipiri 2018 11As well as continuing quality improvement and further strengthening a safety culture, we need to develop
a whole-of-system approach to safety. That approach involves coordination of information (bringing the
pieces of the puzzle together) to identify emerging and complex issues requiring a system response, and to
collaborate so the response is appropriate and effective.
The Window 2018 also emphasised the collaborative nature of the response:
… no sole agency or service holds all the necessary levers to resolve an emerging issue.
Regulation, performance management, quality improvement activities, leadership development
or additional funding may all be appropriate responses to specific circumstances. However, each
organisation has a different role in the system, and with this comes a natural tendency to see that
specific role as the correct solution to any particular problem. Collaboration between agencies
with different roles and perspectives makes it more likely problems will be identified early in their
evolution, and effective and appropriate responses will be found in time to minimise harm to
consumers. (p 50)
Learning story from Waikato DHB
‘Waikato DHB has had a serious event review (SER) panel in place for a number of years, chaired by
the chief medical officer with core membership made up of the chief nursing and midwifery officer and
director of quality and consumer safety. During the past 12 months, we have continued to strengthen
our approach to reviews within the maternity service – this has included better engagement with lead
maternity carers (LMCs) and private birthing units. This has been brought about by improved working
relationships and trust across the teams. The result is that we now undertake SERs with the birthing
unit staff, LMCs, hospital midwives and obstetricians. Once the review is complete, the final report is
presented to the DHB SER panel with LMC and birthing unit staff invited to attend and participate in
the discussion and agreement of recommendations. There are a number of benefits to both staff and
birthing mothers with this approach including a safer whole of system.’
Mo Neville, director of quality and patient safety, Waikato DHB
Pressure injuries
Reporting of pressure injury serious harm events has increased significantly. Ways of encouraging this
reporting have included reminding staff of the harm caused by pressure injuries, providing guidance and
resources on pressure injury prevention and management, and recognising and sharing the good work already
happening across the sector. Another reason for the increase in reporting may have been that the Commission
included pressure injuries in its guide Severity Assessment Code (SAC) examples 2017–18.14 This guide categorises
grade 3, 4 and unstageable pressure injuries as SAC 2 events.
In 2017 the Commission developed a Guide to preparing and implementing a pressure injury measurement
programme15 through a pilot in partnership with four DHBs. We wish to acknowledge the efforts of Waikato,
Whanganui, Capital & Coast and Southern DHBs for helping to establish a robust approach to how we record
in-hospital pressure injuries. Their support was invaluable. We also appreciated that DHBs shared and agreed
to publishing their resources and tools.
14 www.hqsc.govt.nz/our-programmes/adverse-events/publications-and-resources/publication/2938
15 www.hqsc.govt.nz/our-programmes/pressure-injury-prevention/publications-and-resources/publication/3235
12 Adverse events reported to the Health Quality & Safety Commission 1 July 2017 to 30 June 2018This work has informed the development of a suite of pressure injury quality and safety markers across the
hospital sector. Data collection for these markers began on 1 July 2018.16 This process of measurement involves
reviewing notes of randomly selected consumers and undertaking a skin check, with consent, to determine
whether they have been assessed for the risk of developing a pressure injury, and whether a plan is in place to
prevent or treat any pressure injuries found.
While all the reported events this year are from the hospital sector, the aged residential care sector has also
focused strongly on pressure injury prevention and management. HealthCERT17 made this a focus topic in its
2016/17 audit programme and it continues to be a priority area in caring for this vulnerable population group.
Learning story from Waitemata DHB
In 2017 Waitemata DHB increased its focus on adverse events reporting. Because of the improvements
the DHB has made, there has been an increase in the number of pressure injuries reported. This focus
on reporting pressure injury adverse events shows a strong reporting culture that supports a strong
learning culture – the aim being to focus on reducing preventable patient harm.
Patient deterioration
The Commission’s patient deterioration programme aims to reduce harm from failures to recognise or respond
to physical deterioration of adult inpatients (excluding maternity) by July 2021. The programme has three
intervention workstreams that are phased over a five-year duration: recognition and response system; kōrero
mai – patient, family and whānau escalation; and shared goals of care.
In 2017/18 DHBs reported 50 SAC 1 and 2 events that related to not recognising or not managing inpatient
deterioration in an expected timeframe (compared with 26 in 2016/17). Because the evolution of recognition
and response systems in New Zealand hospitals has occurred locally rather than nationally, there has been
considerable variation in the vital sign triggers used to
prompt escalation of care, models of clinical response,
and organisational approaches to managing the care of
deteriorating patients. Key points
In late 2017, a Commission survey of DHB staff found that
The Commission has:
staff liked a recognition and response system because it
enabled and empowered them to escalate their concerns • published a national vital signs
to senior staff. The survey results indicated that being able chart with early warning score
to draw on a recognition and response system that had • supported DHBs to improve their
both a local and a national mandate helped staff address recognition and response systems.
issues such as a sense of lack of support, and a fear of being
blamed or reprimanded. Sixteen DHBs have either fully or
partially implemented improvements
On a national level, during 2017/18 the patient deterioration based on the Commission’s
programme supported all DHBs to prepare and implement improvement programme.
improvements to their recognition and response systems.
16 The pressure injury quality and safety markers will be first published mid-2019.
17 HealthCERT, as part of the Ministry of Health, is responsible for ensuring hospitals, rest homes, residential disability care facilities and fertility
providers provide safe and reasonable levels of service for consumers, as required under the Health and Disability Services (Safety) Act 2001.
Ngā pāpono kōaro i pūrongorongotia ki te Kupu Taurangi Hauora o Aotearoa i te 1 o Hōngongoi 2017 ki te 30 o Pipiri 2018 13Staff received education and training on local escalation pathways, and a national standardised vital signs chart
with early warning score was launched, along with localised clinical escalation and response processes.
By the end of June 2018, 11 DHBs had implemented these improvements across all their hospitals. An
additional five had implemented the improvements at their main hospital and were preparing to implement in
their other hospital(s). Four are continuing their preparations to implement improvements during the 2018/19
year.
Perinatal and maternal adverse events
The number of DHB reports of perinatal and maternal adverse events has increased to 42 events. This
increase is an encouraging sign of improved reporting as, previously, reported adverse events in this area
had represented only a small proportion of perinatal and maternal mortality and morbidity events reported
to the Perinatal and Maternal Mortality Review Committee and the Maternal Morbidity Working Group. The
Commission expects this increase in reporting to be sustained, as providers implement the maternal morbidity
review toolkit.
Some current workstreams of the Maternal Morbidity Working Group are:
• developing and testing a maternal morbidity review toolkit to provide consistency in local maternal reviews
• identifying and engaging local champions who are involved in the national maternal morbidity review panels.
The adverse events learning programme will support this work by releasing examples of SACs specifically for
maternal providers, to help them identify, report and review preventable harm.
Healthcare associated infections
The reporting of adverse events relating to healthcare associated infection (HCAI) has increased. The main
reason for the increase is that a small number of DHBs have focused on increasing their reporting of HCAIs.
This same focus is not reflected across the sector, which presents the Commission with an opportunity to work
with DHBs to increase reporting.
The following are current Commission programmes to reduce HCAIs.
Surgical Site Infection Improvement programme
The Surgical Site Infection Improvement programme focuses on reducing surgical site infections (SSIs)
following hip and knee arthroplasty and cardiac procedures through a bundle of interventions (clipping not
shaving the surgical site, alcohol-based skin preparation, and administering the appropriate antibiotics in the
right dose and in a timely manner). Standardised process and outcome data is recorded as quality and safety
markers on all hip and knee arthroplasty and cardiac procedures funded by DHBs, which total approximately
12,500 procedures each year. The process measures focus on the correct use of surgical antimicrobial
prophylaxis and use of alcohol-based skin preparation; the outcome measure is the SSI rate.
Public reporting of each DHB’s performance against the quality and safety marker targets helped to align and
coordinate quality improvement activities nationally. Multidisciplinary teams with strong clinical engagement
from individual DHBs implemented quality improvement initiatives based on their specific opportunities
and systems. The initiatives and key learnings were then shared at regional and national meetings so that
Surgical Site Infection Improvement programme teams in other DHBs could also benefit. The programme has
significantly improved quality and safety marker performance and most hip, knee and cardiac procedures now
comply with recommended best practice.
14 Adverse events reported to the Health Quality & Safety Commission 1 July 2017 to 30 June 2018Some DHBs have recently implemented a pre-operative bundle of interventions aimed at preventing Staphylococcus aureus-related SSIs. This bundle involves skin and nasal decolonisation by antimicrobial agents. Healthcare associated-Staphylococcus aureus bacteraemia Healthcare associated-Staphylococcus aureus bacteraemia (HA-SAB) data is currently the outcome marker for the Hand Hygiene New Zealand programme. In this programme, validated auditors collect and report data on hand hygiene compliance, which is one of the most important means of preventing HCAIs and directly contributes to reducing consumer harm. Peripheral intravenous catheter-related bloodstream infections The Commission’s infection prevention and control programme is starting some work on peripheral intravenous catheter-related bloodstream infections (PIVC-BSI). Although it is an informal component of the programme, many DHBs are focusing on this important topic. PIVC-BSI also overlap with HA-SAB, as some HA-SAB infections come from peripheral lines. Preventing harm from falls When the Commission was established in 2010, falls in hospitals accounted for the majority of reported adverse events. Due to the devastating impact of harm from falls for consumers and whānau, and the increase of reported falls events, in 2012/13 the Commission made reducing harm from in-hospital falls a high priority. This led to a national quality improvement programme in partnership with the sector to build on the good work already taking place. This programme has culminated in transitioning to falls prevention work as ‘business as usual’ on 30 June 2018. The Commission will continue to provide support by reviewing the evidence and updating key resources such as the falls 10 Topics.18 It will also monitor the in-hospital quality and safety markers, update the falls Atlas of Healthcare Variation19 and support the sector to maintain a strong consumer safety focus on falls and fracture prevention in the future. In 2017/18, 255 adverse events reported by DHBs related to harm from falls, of which 101 resulted in a neck of femur fracture (96 events) or hip fracture (5). Improved systems and processes within several providers have led to better identification and reporting, and this appears to be reflected in the number of reported falls. Although individual events have increased in 2017/18, this increase is currently within normal statistical variation. The Commission intends to monitor falls data from the adverse events system and the quality and safety markers to provide early warning if numbers increase beyond what might be expected from an improvement in reporting and systems. Complexity and context New Zealand has an increasingly ageing population. Many elderly people are frail and may suffer from a number of long-term medical conditions, including cognitive impairment and osteoporosis. People with osteoporosis have bones that break very easily with the impact of a fall. 18 www.hqsc.govt.nz/our-programmes/reducing-harm-from-falls/10-topics 19 www.hqsc.govt.nz/our-programmes/health-quality-evaluation/projects/atlas-of-healthcare-variation/falls Ngā pāpono kōaro i pūrongorongotia ki te Kupu Taurangi Hauora o Aotearoa i te 1 o Hōngongoi 2017 ki te 30 o Pipiri 2018 15
Every person harmed is a loved one who has their life changed forever, dies too soon or is admitted to aged
residential care earlier than expected. Maintaining a focus on falls prevention should be everyone’s business
and is a long-term commitment for all health care providers.
In New Zealand, we have embarked on a national approach to improve falls and fracture prevention, and
rehabilitation outcomes for older people as part of the Healthy Ageing Strategy.20
In the future, we would expect to see a positive impact from interventions now being promoted in the
community, with their focus on improving bone health and supporting improved physical strength and balance
through in-home and community-based exercise programmes.
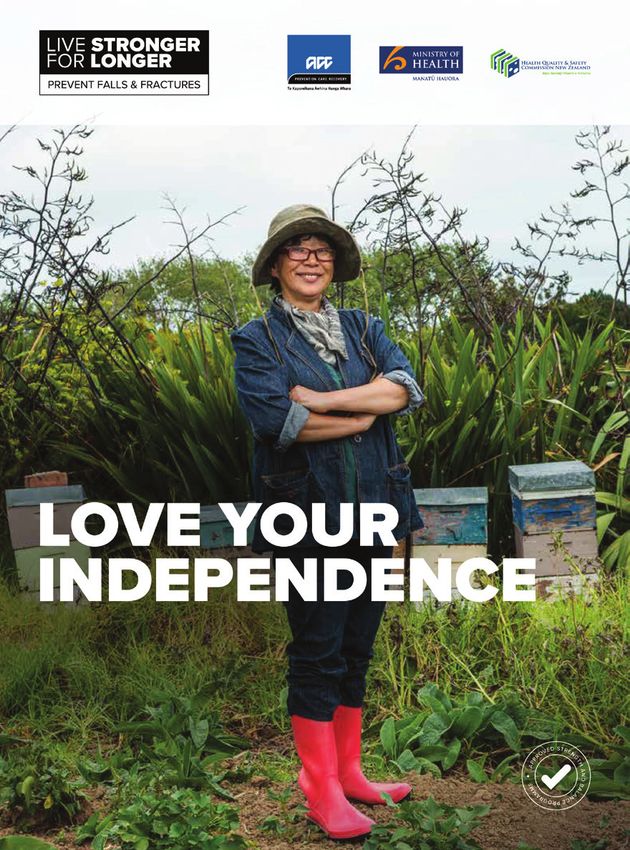
Supporting a whole-of-system approach through the ‘Live stronger for longer’ movement
While the Commission’s initial focus on reducing harm from falls was on consumers in the hospital setting,
this has broadened to a community and whole-of-system approach, given most falls and serious harm from
falls occur in the community. To meet the need in this setting, we have partnered with other central agencies
including ACC, the Ministry of Health and key stakeholders.
This approach responds to the challenges of an ageing population, which includes a need to understand and
identify frailty. It puts efforts into interventions where the evidence remains the strongest. It also keeps us all
working across the system to keep our older population living independently and safely in their place of choice.
ACC has accelerated this effort through a significant investment in and the development of a national
movement, ‘Live stronger for longer’.21 This brings together older people, health and community providers and
central funding agencies to promote the positive aspects of ageing and the value we place on older people by
supporting them to live independently and well at home, free from falls and fragility fractures.
20 www.health.govt.nz/publication/healthy-ageing-strategy
21 www.livestronger.org.nz
16 Adverse events reported to the Health Quality & Safety Commission 1 July 2017 to 30 June 2018The Commission has also worked with partners to develop a falls and fractures outcomes framework and dashboard,22 which identify five outcome domains: 1. fewer fall injuries 2. fewer serious harm falls 3. improved recovery (hospital) 4. improved recovery (home) 5. integrated care. These domains have been selected based on research that indicates benefits for a specific at-risk population across the entire health system from primary care through secondary care and returning home again. The framework helps to align data to key system-level measures and allows reporting back to the sector in a timely manner. The model is used to reflect an individual’s experience of care that is delivered in a collaborative and coordinated way throughout their health journey. Alliance partnerships at all levels The Commission continues to partner with ACC, the Ministry of Health and key stakeholders in supporting Key points the sector to work through local health system alliances, which will be vital in sustaining this whole-of- The Commission has: system approach to falls and fracture prevention and • worked with partners to develop management. Falls and fracture prevention is indeed a falls and fractures outcomes everyone’s business. framework and dashboard While we acknowledge the great work happening • partnered with ACC, the Ministry of across the sector, we encourage you all to maintain the Health and other key stakeholders to momentum and prioritise this work both in the hospital expand the work on reducing harm setting and through your local alliances. This is essential from falls to a community and whole- to help every older individual receive the seamless care of-system approach. they deserve and experience improved health outcomes. Always report and review events Following consultation with the sector, the 2017 Policy introduced always report and review events.23 These are a subset of adverse events that should be reported and reviewed, no matter whether they led to harm to the consumer or not. The Commission updates the always report and review list regularly in consultation with the sector. As this is the first year DHBs have reported on these events, it is difficult to identify trends, so the data is presented here with minimal commentary. Of the 84 always report and review events reported, 36 caused minimal harm or no harm24 or were near misses.25 This reporting is important as being able to identify, review and learn from events where little to no harm occurred offers the opportunity to fix system errors that may cause serious harm. 22 www.livestronger.org.nz/home/resources/resources#ResourceSection-13 23 Always report and review events are events that can result in serious harm or death but are preventable with strong clinical and organisational systems. 24 A no-harm event is one where an adverse event occurs, but the consumer does not suffer any harm because of it. For example, a consumer receives a larger dose of a drug than intended but does not suffer any harm because of it. 25 A near miss is an event that has potential for harm, but the event is managed before harm can occur. For example, the wrong consumer is taken for an X-ray but the error is noticed before the procedure begins so that patient is not X-rayed. Ngā pāpono kōaro i pūrongorongotia ki te Kupu Taurangi Hauora o Aotearoa i te 1 o Hōngongoi 2017 ki te 30 o Pipiri 2018 17
Forty-four percent of the reported events for wrong site, wrong implant/prosthesis, wrong consumer/procedure
     involved radiology services. This should prompt providers to consider ways to translate evidence-based
     processes and improve teamwork and communication to areas outside of operating theatres.

     The Commission has published an Open Book on this topic: Under the radar: Interventions or procedures
     performed outside operating theatre settings – wrong procedure/wrong site/wrong person.26

     Retained item and wrong consumer/site/side/treatment/procedure events are part of the new always report
     and review list in the 2017 Policy.

     Table 3 shows the always report and review events reported, broken down by the degree of harm they caused
     to the consumer.

     Table 3: Always report and review events DHBs reported, by the degree of harm caused to the
     consumer, 2017/18

                                                                                                                                   SAC 4/
      Always report and review event                                                    Total          SAC 2          SAC 3
                                                                                                                                  near miss
      Wrong blood component                                                              3                0              1             2
      Retained foreign object post-procedure                                             27               9              7             11
      Wrong site, wrong implant/prosthesis,
                                                                                         54               10            21            23
      wrong consumer/procedure
      Total                                                                              84               19            29            36
     SAC = severity assessment code; 1 = most severe, 4 = least severe adverse event.

     Demographic information
                                                                                                Key points
     Demographic information provides a snapshot across
     a range of individuals where information has been                                          Many always report and review events
     collected about them at a particular point in time.                                        involved radiology services. Providers
     This is the first year that the Commission has collected                                   need to have robust systems for ensuring
     and reported on demographic data, and we plan to                                           right site, right implant/prosthesis (where
     review this data further over the coming year. Of the                                      applicable) and right consumer/procedure.
     631 individuals for whom DHBs have recorded an
     adverse event in 2017/18, only one individual’s age
     was not recorded.

     Most consumers who suffered adverse events in this reporting period were aged 50 years or over (a total of
     500 individuals), which is approximately 79 percent of the total number of reported events (Figure 3). This age
     group may be reflected in the high number of events reported for falls causing serious harm.

     26 www.hqsc.govt.nz/our-programmes/adverse-events/publications-and-resources/publication/3091

18                              Adverse events reported to the Health Quality & Safety Commission 1 July 2017 to 30 June 2018
Figure 3: Age range of consumers suffering SAC 1 and 2 adverse events reported by DHBs, 2017/18
350
307
300
250
Number of consumers
193
200
150
100
78
52
50
1
0
< 24 25–49 50–74 75+ Not recorded
Age group
Most individuals were of New Zealand European ethnicity (Figure 4). The second-highest ethnicity was Māori
(11 percent), with ‘other’27 the third-highest category. We will be working to understand this data in 2018/19
(see Chapter 4 for details on this work).
Figure 4: Ethnicity of consumers suffering SAC 1 and 2 adverse events reported by DHBs, 2017/18
450
424
400
350
300
Number of consumers
250
200
150
100
68
53
50 36
22
14 14
0
New Zealand New Zealand Pacific Asian Indian Other Unknown
Māori European peoples
Ethnicity
27 Ethnicities are grouped as ‘other’ if there were two or fewer consumers reported for an ethnicity.
Ngā pāpono kōaro i pūrongorongotia ki te Kupu Taurangi Hauora o Aotearoa i te 1 o Hōngongoi 2017 ki te 30 o Pipiri 2018 19Chapter 2: Learning from adverse events reported
by other health and disability providers | Wāhanga 2:
Te ako i ngā pāpono kōaro kua pūrongorongotia e ērā
atu kaiwhakarato hauora, hauā hoki
This chapter details reports received from the national ambulance sector, aged residential care, primary care
and private surgical hospitals. It includes learning stories from several organisations about the work they are
doing to improve adverse event management within different sectors of the health system.
The 2017 Policy is intended to be relevant to all health and disability services that use it to support consumer safety
and quality improvement systems and processes. We encourage and welcome reporting from across the sector and
have received reports of a total of 119 adverse events in 2017/18 from health and disability providers other than DHBs.
We continue to work with ACC, the ambulance sector and members of the New Zealand Private Surgical Hospitals
Association (NZPSHA) on reporting adverse events, with a common purpose of improving consumer safety.
The Commission also continues to engage with other providers, especially the primary care and aged
residential care sectors, to help them to implement the 2017 Policy.
Table 4 sets out the SAC 1 and 2 adverse events reported by other health and disability providers, broken down by
type of event. Table 5 focuses on clinical management events with details of the clinical classifications of events
within this category.
Table 4: SAC 1 and 2 adverse events reported by other health and disability providers (excluding
events from NZPSHA members),28 by World Health Organization category, 2017/18
Reported non-DHB SAC 1 and 2
Adverse event category Event code
adverse events 2017/18
Clinical administration 01 11
Clinical process/procedure 02 12
Documentation 03 0
Healthcare associated infection 04 0
Medication/IV fluids 05 1
Blood/blood products 06 0
Nutrition 07 0
Oxygen/gas/vapour 08 0
Medical device/equipment 09 0
Behaviour 10 2
Consumer accidents 11 0
Falls 12 2
Infrastructure/buildings/fittings 13 0
Resources/organisation/management 14 0
Total 28
SAC = severity assessment code.
28 The NZPSHA provides a single aggregated number of events, rather than reporting individual events by category. This means they cannot be included in
any analysis.
20 Adverse events reported to the Health Quality & Safety Commission 1 July 2017 to 30 June 2018Table 5: Clinical classification of clinical management events reported by other health and disability
providers, 2017/18
No of
Clinical management event classification Description example (hypothetical)
events
Issue in referral process results in delay
Delayed diagnosis or treatment 16
seeing specialist
Initial assessment did not find the key
Assessment and diagnosis 1
clinical issue
Insufficient clinic, equipment, staff or
Resources/organisation/management 0
appointments to meet demand
Consumer deterioration not recognised or
Deterioration 3
managed in expected timeframe
Complication of treatment or procedure
Complication 2
(eg, stroke following surgery)
Item left inside wound beyond
Retained item 0
expected time
Pressure injury from insufficient position
Pressure injury 1
change or nutrition, etc
Adverse outcome 0 Unexpected consumer death or outcome
Incomplete process during care
Clinical process 0
(eg, consent, coordination of care)
Wrong consumer/site/side 0 Wrong consumer in procedure room/theatre
Inadequacy of monitoring
Monitoring 0
(eg, breathing rate after morphine given)
Other 0 Security issue
Allergic reaction to products used
Treatment 0
for treatment
Harm related to transfer of care between
Transfer 0
services or providers
Total 23
National ambulance sector
There were 533,669 ‘111’ calls for ambulance services in 2017/18, which is a 5.4 percent increase in calls from
2016/17. The two emergency ambulance providers reported 18 adverse events in 2017/18 – delay in treatment
(14); missed diagnosis (1); deterioration (1); complication (1); and failure to monitor (1).
The sector adverse events review group has continued to bring sector representatives, the National Ambulance
Sector Office and the Commission together, and now includes representatives from several of the air ambulance
providers nationally. This cooperation between the adverse events review group and the Commission is invaluable
in assisting the sector to achieve consistency with the wider health sector. Areas the sector has focused on are
embedding the national policy, improving systems and processes, and aligning reporting.
The ambulance sector has continued to build ties with the wider health sector around adverse events.
Staff from DHBs and ambulance providers collaborate on reviews of adverse events that involve an overlap
between organisations.
Ngā pāpono kōaro i pūrongorongotia ki te Kupu Taurangi Hauora o Aotearoa i te 1 o Hōngongoi 2017 ki te 30 o Pipiri 2018 21You can also read