Liability Limit Benchmarks & Large Loss Profile by Industry Sector 2020 - Chubb Bermuda
←
→
Page content transcription
If your browser does not render page correctly, please read the page content below
Liability Limit Benchmarks
& Large Loss Profile
by Industry Sector
2020

Chubb Bermuda

The Cyclical Nature
of Insurance Markets

During the past decade, the insurance industry has faced a
dramatic alteration in the landscape of loss, with both frequency
and severity rising to unanticipated and previously unheard-of
levels. Each weekly newscast seems to feature yet another
multi-billion-dollar event. Wildfires and earthquakes in many parts
of the world. Mass shootings in schools, malls, churches, concert
venues. D&O class-action harassment and misconduct lawsuits
propelled by the #MeToo movement. Lawsuits stemming from
large-population pharmaceutical substance addiction and abuse.
Auto liability-related suits involving contractor-owned vehicles.
It’s a list of events that often appears endless.

In the past ten years, large scale catastrophes — or “CAT events”
— have seemingly become commonplace. Previously occurring as
high-severity/low-frequency events, they have increasingly morphed
into high-severity and high-frequency catastrophes. Almost without
exception, these events involve multi-billion-dollar losses, which
have naturally contributed to an industry-wide need to improve rate
adequacy and heightened scrutiny of capacity deployment.

                                                                      1
In addition to the high frequency and severity of catastrophe events,
    the excess liability market has been further impacted by other economic
    phenomena, such as:

    1. Social Inflation — The term, “social inflation,” can refer to the
      perception — or even expectation — by plaintiffs and courtroom juries
      that injured parties should receive inflated multi-million (or billion)-
      dollar settlements. Since the financial market crash of 2008, there
      has been a general public mistrust of big business — a distrust that
      has moved into the courtroom, producing increased plaintiff activity,
      an increasingly well-funded plaintiffs bar, and desensitization of
      jury awards.

    2. The Prevalence of Nuclear (or Super-Nuclear) Verdicts — According
      to the Wall Street Journal analysis of data from verdictsearch.com, in
      2019, there was a 300% increase in “nuclear verdicts” compared to the
      prior ten years.

    3. Continuing Increase in Loss Cost Trend — The cost to settle a
      claim costs significantly more than it does in prior years due to several
      factors including rising inflation, medical costs, legal and investigative
      costs, a larger and more public universe of "deep pocket" targets, etc.

    As we navigate through this challenging environment, we want to
    reassure our customers of the role that we can and will continue to play.
    We continue to offer what we have always provided: creative solutions,
    consistent and customized large-block capacity, powerful expertise
    and advocacy for mitigating losses, and data insights to facilitate
    decision making. In short, our promise of trusted protection and true
    partnership remain.

2
The Cyclical Nature of Insurance Markets

                                           3
Chubb Bermuda Insurance Limited is pleased to deliver our 2020
    report which includes:

    • Median liability limits purchased by industry sector, over a 10 year
     period, based on Chubb Bermuda’s 2019 year-end portfolio data

    • A sampling of large losses in specific industry sectors, leading with
     those sectors most impacted in 2019

    • Average CODA limits purchased, and examples of large losses
     and exposures driving the purchase of dedicated Side A limits for
     directors and officers

4
Contents

Industry Sectors

Utilities                                6
Real Estate & Hospitality                8
Rail                                    10
Chemical                                12
Consumer Products                       14
Food & Beverage                         16
Healthcare                              18
Life Sciences                           20
Manufacturing                           22
Oil & Gas                               24

In-Depth Feature — Are You Protecting
Your Directors & Officers?              27

                                             5
Utilities
    Companies engaged in the generation, transmission,
    and distribution of electricity, including transmission
    or distribution of gas.

6
Utilities Sector*

                      Sample Large Losses

                                                                                                                                                    Incurred
                          Date of Loss Loss Details                                                                                     Location    Amount
                                2008         Impoundment failure                                                                            USA        $1.1B
                                 2015        Natural gas leak resulted in alleged illness and mandatory evacuations                         USA        $1B1
                                             Utility employee alleged negligence led to an explosion when plaintiff
                                20162                                                                                                       USA        $20M
                                             lit cigarette at home
                                             A loose wire on a utility pole became electrified killing one worker and
                                  2017                                                                                                      USA       $100M3
                                             causing a double amputation to another
                                 20172       Child electrocuted while climbing trees near power lines                                       USA        $24M
                                             Wildfires allegedly caused by power and distribution lines, conductors
                           2017/2018                                                                                                        USA      $12B–24B
                                             and failure of power poles

                                 2018        Alleged negligence in vegetation management when a tree falls on a child
                                                                                                                                            USA        $48M
                                             who loses a leg
                                             Gas leak and explosion kill one, injure over 25 and impact over 8,000
                                 2018                                                                                                       USA     Over $790M
                                             customers
                                 2019        Three individuals injured by electric ground box shock                                         USA       $25M3
                      1   Estimate                            2 Disposition   date           3 Demand

                      Limits Purchased vs. Loss Costs

                                      700
                           Millions

                                      600

                                      500

                                      400

                                      300

                                      200

                                      100

                                       0
                                            $400M       $393M          $373M         $400M    $350M      $355M      $355M      $350M        $335M   $371M
                                            2010          2011          2012          2013      2014      2015        2016       2017        2018    2019
                                                       Median Total Limits above SIR                    Half of insureds purchased limits
                                                       Loss Costs are trended using the                 within the bars
                                                       ISO Trend Circular

                      * Includes crude, petroleum products.

Liability Limit Benchmarks & Large Loss Profile by Industry Sector 2020                                                                                         7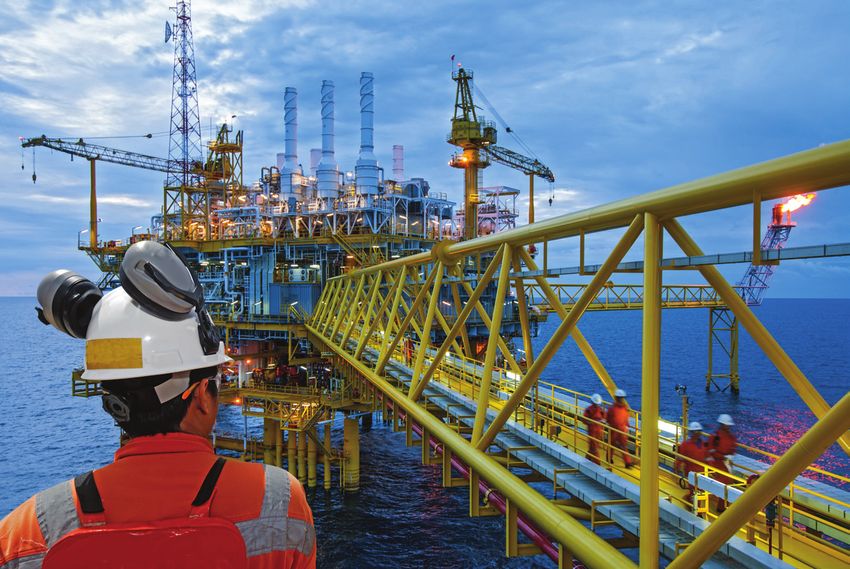
Real Estate & Hospitality
    Companies engaged in the ownership, operation or
    management of all types of premises/occupancies,
    including commercial and residential buildings, hotels,
    and arenas/stadiums.

8
Real Estate & Hospitality Sector
Sample Large Losses
Incurred
Date of Loss Loss Details Location Amount
20151 Second story apartment floor and balcony collapsed USA $25M
2015 Hotel guest secretly videotaped in the shower USA $100M
2015 Pedestrian shelter collapsed at the airport USA $115M
The construction of illegal partition walls blocked access to fire escape
2016 USA $183M
resulting in fatalities
Hotel nightclub security alleged to have caused VIP guest traumatic
20171 USA $161M2
brain injury
2018 Shooting from hotel leaves 58 dead and hundreds injured USA $800M
2018 1
Hotel liable for failure to respond to murder in guestroom USA $41M
2018 1
Hotel failed to intervene in ongoing domestic abuse USA $42M
20191 Property association liable for bicyclist’s crash into improperly place pole USA $41M
20191 Apartment’s substandard living condition lead to death USA $125M
2019 1
Tour operator crash killing 5 and injuring 60 USA $123M
1 Disposition date 2 $161M verdict, but
later settled at a lower
undisclosed amount
Limits Purchased vs. Loss Costs
600
Millions
500
400
300
200
100
0
$335M $350M $350M $350M $350M $350M $325M $338M $350M $350M
2010 2011 2012 2013 2014 2015 2016 2017 2018 2019
Median Total Limits above SIR Half of insureds purchased limits
Loss Costs are trended using the within the bars
ISO Trend Circular
Liability Limit Benchmarks & Large Loss Profile by Industry Sector 2020 9Rail
Companies engaged in the transportation of
passengers and/or products by rail.
10Rail Sector
Sample Large Losses
Incurred
Date of Loss Loss Details Location Amount
Train operator alleged to have fallen asleep, and a passenger train
2013 USA $60M
derailed on a curve killing four and injuring around 70
20131 Train struck vehicle at railway crossing USA $15M
2013 Two-train collision following derailment, injuring 65 passengers USA $21.7M
Train derailment resulted in multiple fatalities, injuries, and
2013 Canada $430M
property damage
2015 High-speed derailment kills eight and injures over 200 USA $265M
Train strikes car at railroad crossing killing one and severely
20161 USA $37.5M
injuring four
2017 Train derails on newly opened route killing three and injuring about 100 USA $31.7M
2018 1
Railroad worker exposed to toxic fumes from leaking railcar USA $15M
2019 Train derails into a river, killing three crew members Canada Pending
Single vehicle crash involving a concrete barrier at a railroad crossing
20191 USA $17M
results in severe injuries
1 Disposition date
Limits Purchased vs. Loss Costs
1,600
Millions
1,400
1,200
1,000
800
600
400
200
0 $797M $1,000M $825M $858M $890M $875M $875M $825M $703M $975M
2010 2011 2012 2013 2014 2015 2016 2017 2018 2019
Median Total Limits above SIR Half of insureds purchased limits
Loss Costs are trended using the within the bars
ISO Trend Circular
Liability Limit Benchmarks & Large Loss Profile by Industry Sector 2020 11Chemical
Companies engaged in research, development,
manufacturing, marketing, and distribution of
petrochemicals, basic and specialty chemicals,
agricultural chemicals, and chemical intermediates.
12Chemical Sector
Sample Large Losses
Incurred
Date of Loss Loss Details Location Amount
20171 Exposure to toxic chemical in drinking water alleged to cause cancer USA $13M
Class action lawsuit alleges medical marijuana customers were made ill
2017 Canada Pending
by cannabis tainted with pesticides
Class action settlement for personal injuries resulting from exposure
2017 USA $671M
to chemical
20182 Toxic product to be removed from homes USA $60M
2019 1
Wrongful death verdict for two workers exposed to toxic solvents USA $21M
20191 Private citizen’s lawsuit alleging illegal pollution discharge into waterways USA $50M
Groundwater contamination alleged from application of pesticide
20191 USA $63M
fumigants
Potential class action from thousands of claimant allegations that an
Various USA $10B3
agrichemical causes personal injuries
20201 Crop damage resulting from third party use of herbicides USA $265M
1 Disposition date 2 Date of settlement 3 Defense settlement offer
Limits Purchased vs. Loss Costs
800
Millions
700
600
500
400
300
200
100
0
$463M $475M $500M $500M $500M $500M $475M $488M $475M $490M
2010 2011 2012 2013 2014 2015 2016 2017 2018 2019
Median Total Limits above SIR Half of insureds purchased limits
Loss Costs are trended using the within the bars
ISO Trend Circular
Liability Limit Benchmarks & Large Loss Profile by Industry Sector 2020 13Consumer Products
Companies engaged in manufacturing, distribution,
marketing, and sale of consumable goods.
14Consumer Products Sector
Sample Large Losses
Incurred
Date of Loss Loss Details Location Amount
20111 Defective plumbing USA/Canada $200M
2011 Defective heater started a fire USA $47M
2012 2
Footwear alleged to cause health risks USA $401M
20162 Alleged concussion-related injuries USA $1B3
20161 Defective infant car seat design led to spinal injury USA $34M
2017 Faulty refrigerator alleged to have contributed to a deadly fire that killed 79 UK Pending
2018 2
Defective furniture killed three children USA $50M
20181 Workers allege that defective dust makes lead to disease USA $67M
2018 1
Faulty vehicle seat design injuries to two children USA $209M
2018/20194 Talc litigation USA $5B
2019 1
Federally-approved seat-belt design considered defective USA $37M5
20202 Defective furniture design leads to wrongful death single plaintiff lawsuit USA $46M
1 Disposition date 3 Estimateof class action 4 Date of verdicts
2 Date of settlement settlement over 65 years 5 Single plaintiff verdict
Limits Purchased vs. Loss Costs
500
Millions
450
400
350
300
250
200
150
100
50
0
$300M $300M $300M $300M $300M $300M $288M $275M $300M $300M
2010 2011 2012 2013 2014 2015 2016 2017 2018 2019
Median Total Limits above SIR Half of insureds purchased limits
Loss Costs are trended using the within the bars
ISO Trend Circular
Liability Limit Benchmarks & Large Loss Profile by Industry Sector 2020 15Food & Beverage
Food companies face a unique and complex set of
risks with high competition, low margins, numerous
regulations, and consumers who are ever more
aware of food safety issues and concerned about the
environmental impact.
16Food & Beverage Sector
Sample Large Losses
Incurred
Date of Loss Loss Details Location Amount
2010 Product for consumption contaminated with Salmonella USA $33M
Food truck explosion that killed two and injured 11 was allegedly cause
2014 USA $160M
by company refilling propane tanks for the food industry
Restaurants alleged lack of security resulted in patron being beaten
20141 USA $27M2
to death
Restaurant’s service of alcohol to an underage patron resulted in
20151 USA $60M
life-altering injury car crash
20161 Explosion at food plant killed four and injured over 60 USA $109M
Edible marijuana manufacturer and dispensary failed to warn
20163 USA Pending
of products potency and side effects
20181 Industrial farm created a noise and odor nuisance for residents USA $98M
Grocery store’s failure to provide adequate security led to
20191 USA $70M
mugging injury
1 Disposition date 2 Subsequently settled 3 Filing date
post-verdict for an
undisclosed sum
Limits Purchased vs. Loss Costs
800
Millions
700
600
500
400
300
200
100
0 $475M $475M $375M $388M $400M $350M $300M $300M $300M $325M
2010 2011 2012 2013 2014 2015 2016 2017 2018 2019
Median Total Limits above SIR Half of insureds purchased limits
Loss Costs are trended using the within the bars
ISO Trend Circular
Liability Limit Benchmarks & Large Loss Profile by Industry Sector 2020 17Healthcare
Hospitals, teaching universities/medical schools,
long-term care/assisted living facilities, Managed Care
Organizations, Health Maintenance Organizations
(HMOs), Preferred Provider Organizations (PPOs),
Physician-Hospital Organizations (PHOs) and clinical
trial/contract research organizations.
18Healthcare Sector
Sample Large Losses
Incurred
Date of Loss Loss Details Location Amount
Plaintiff contracted antibiotic-resistant bacteria in hospital after
2015 USA Pending
exposure to contaminated equipment
Lawsuit alleged inappropriately 20 missteps by doctors and nurses
20161 USA $52M
resulting in serious permanent injury
20181 Doctor’s negligence resulted in severe permanent injury USA $73M
Botched surgery resulted in infection by a flesh-eating bacteria
20181 USA $109M
and amputations
20181 University physician alleged sexual abuse and harassment USA $225M
2018 1
Clinic’s negligence with a medical device resulted in wrongful death USA $384M2
20181 University sports physician sexually abused girls and women USA $500M
2019 3
Hospital liability for infant brain damage USA $50M4
20191 Catastrophic infant brain injury caused during delivery USA $205M4
1 Disposition date 2 Verdict,
later reduced to 3 Date of verdict 4 Reduced by settlement
a confidential settlement from $101M jury verdict
Limits Purchased vs. Loss Costs
800
Millions
700
600
500
400
300
200
100
0 $475M $475M $375M $388M $400M $350M $300M $300M $300M $325M
2010 2011 2012 2013 2014 2015 2016 2017 2018 2019
Median Total Limits above SIR Half of insureds purchased limits
Loss Costs are trended using the within the bars
ISO Trend Circular
Liability Limit Benchmarks & Large Loss Profile by Industry Sector 2020 19Life Sciences
Companies engaged in the research, development,
manufacturing, marketing, distribution or sale of
pharmaceuticals, biologics, and medical products/
devices, including biomedical research/technology.
20Life Sciences
Sample Large Losses
Incurred
Date of Loss Loss Details Location Amount
Contaminated equipment used during surgery alleged to cause severe
2015 USA $215M
and life-threatening infections
20161 Schizophrenia and bipolar disorder drug caused a disturbing side effect USA $70M
Design defects of the implanted medical device caused severe
20171 USA $57M
personal injuries
2017 Blood pressure drug caused gastrointestinal injuries USA $300M
Blood-thinning drug alleged to cause internal bleeding, stroke,
2019 USA $775M
and death
17 patients with alleged personal injuries from defective
Various USA $941M
metal-on-metal hips
Various Opioid litigation USA $48B+ 2
1 Disposition date 2 Proposed settlement
Limits Purchased vs. Loss Costs
700
Millions
600
500
400
300
200
100
0 $300M $300M $253M $260M $260M $270M $300M $254M $250M $243M
2010 2011 2012 2013 2014 2015 2016 2017 2018 2019
Median Total Limits above SIR Half of insureds purchased limits
Loss Costs are trended using the within the bars
ISO Trend Circular
Liability Limit Benchmarks & Large Loss Profile by Industry Sector 2020 21Manufacturing
Companies engaged in the design, development,
assembly, manufacturing, marketing, distribution
and sale of industrial equipment, motor vehicles,
and component parts used in various industries.
22Manufacturing Sector
Sample Large Losses
Incurred
Date of Loss Loss Details Location Amount
Seatbelt’s defective design caused the driver to strike head during
20141 USA $55M
low-speed rollover
2016 Car seat defects caused injury to children during a collision USA $213M
2017 Cladding alleged to fuel a building fire causing multiple fatalities UK Pending
2017 1
Car accident caused by faulty brakes USA $24M
Bankruptcy judge approved a fund for victims of exploding
20181 USA Up to $137M
airbag inflators
Industrial emissions from processing plant affected neighboring
20182 USA $51M
properties
20191 Vehicle accident caused by safety defect resulted in paralysis USA $151M
2019 2
Refinery explosion resulting from alleged manufacturing defects USA $317M3
20194 Engine defect litigation USA $758M
2020 2
Auto suspension defect class action litigation USA $57M
1 Disposition date 2 Date of settlement 3 Reduced to $195M 4 Date of proposed
by settlement prior settlement
to jury verdict
Limits Purchased vs. Loss Costs
700
Millions
600
500
400
300
200
100
0 $400M $491M $475M $419M $400M $400M $325M $350M $400M $400M
2010 2011 2012 2013 2014 2015 2016 2017 2018 2019
Median Total Limits above SIR Half of insureds purchased limits
Loss Costs are trended using the within the bars
ISO Trend Circular
Liability Limit Benchmarks & Large Loss Profile by Industry Sector 2020 23Oil & Gas
Companies engaged in the exploration, production,
refining, processing, marketing, and distribution
of natural gas, oil, liquids, and derived products —
including contract drilling and other oilfield products
and services.
24Oil & Gas Sector
Sample Large Losses
Incurred
Date of Loss Loss Details Location Amount
2010 Operator of sub-sea well blowout with multiple fatalities USA $44B1
2012 Sinkhole resulted in contamination USA $200M+
2013 Plant explosion kills two and injures over 160 USA $30M
Contractor error in the provision of services allegedly impacting
20142 USA $1.1B
sub-sea well blowout
20152 Workers burned in refinery explosion and fire USA $159M
2015 2
Owner of sub-sea well blowout with multiple fatalities USA $211M
2016 Gas pipeline explosion kills two and injures several USA Pending
2017 Gas truck struck a motorcyclist causing injuries USA $46M
2018 Fatal oil rig blowout kills five workers USA $20M3
20182 Oil services company truck driver plowed into the back of a pickup truck USA $33M
2019 Natural gas pipeline built in the 1950s exploded USA Pending
20194 Coastline damage allegedly caused by oil and gas drilling USA $100M
1 2016 after-tax update, 2 Disposition date 3 Wrongful death verdict for 4 Date of settlement
inclusive of economic loss two of the five killed
Limits Purchased vs. Loss Costs
900
Millions
800
700
600
500
400
300
200
100
0 $500M $530M $500M $529M $558M $590M $538M $540M $518M $525M
2010 2011 2012 2013 2014 2015 2016 2017 2018 2019
Median Total Limits above SIR Half of insureds purchased limits
Loss Costs are trended using the within the bars
ISO Trend Circular
Liability Limit Benchmarks & Large Loss Profile by Industry Sector 2020 2526
Are You Protecting
Your Directors & Officers?

In 2019, there were 428 class action filings, breaking the
previous record of 420 set in 2018.1 Another new record was
set in 2019: public companies on US stock exchanges had the
highest probability of getting sued than any other time.1 Health
Care continues to be a popular target of plaintiffs, and the
frequency of securities cases against companies classified as
Industrials and Consumer Staples saw an increase in 2019.1

Another significant development in 2019 was the settlements
of several so-called “mega derivative actions.” Settlements
in excess of $100 million and even $200 million suggest that
Side A towers may need to respond at levels typically only
seen for securities class actions. Because derivative actions are
generally not indemnifiable by the company, any insurance
buyer should undertake a careful analysis to determine if there
is sufficient Side A cover to protect the personal assets
of directors and officers.

1
    https://www.cornerstone.com/Publications/Reports/Securities-Class-Action-Filings-2019-Year-in-Review

                                                                                                           27
Data points, insights, and real-life cases of Side A
policy payouts help you determine how much D&O
coverage you need.
Emergent liability threats against their personal assets that directors
and officers face include:
• Event-driven risks: merger objection claims
• D&O derivative risks: cyber data breach claims
• Employment practices liability risks: derivative claims, fueled by #MeToo
• SEC regulatory investigation risks: continued SEC focus on individuals
SCA Frequency
6,000 7.0%
Percentage of Companies Subject to Core SCA Filings
5,000 6.0%
5.0%
4,000
Number of Publicly Traded Firms
4.0%
3,000
3.0%
2,000
2.0%
1,000
1.0%
0 0.0%
2005 2006 2007 2008 2009 2010 2011 2012 2013 2014 2015 2016 2017 2018 2019
Sample Side A Payments in Shareholder Derivative
Litigation Settlements
$25 million
Communications Sector
A Side A policy paid to settle a lawsuit alleging insider trading and fraudulent
accounting, while a related class-action lawsuit settled for $400 million.
$21 million
Consumer Products & Services
A Side A policy paid to settle a lawsuit alleging the company founder and chairman
made unwanted sexual advances toward employees, and despite being aware of the
behavior, directors did nothing to stop that pattern of sexual misconduct.
$60 million
Energy
A Side A policy paid to settle a lawsuit alleging the directors of an automobile
company breached their fiduciary duties by approving an excessively priced solar
energy company purchase when that company was controlled by the automobile
company’s CEO and Chairman.
28Are You Protecting Your Directors & Officers?
Class Action Filings 160
198 182
84
34
7 43 13 12
39 12
182 120 177 224 157 135 146 142 152 158 183 204 215 238 268
2005 2006 2007 2008 2009 2010 2011 2012 2013 2014 2015 2016 2017 2018 2019
Core Filings M&A Filings 1997–2018 Average
https://www.cornerstone.com/Publications/Reports/Securities-Class-Action-Filings-2019-Year-in-Review.pdf
$240 million
Financial Services
A Side A policy paid to settle a lawsuit alleging bank directors breached their
fiduciary duty by knowingly, or consciously disregarded, a widespread practice
of cross-selling by bank employees.
$60 million
Healthcare
A Side A policy paid to settle a lawsuit alleging the company’s directors and officers
breached their fiduciary duty by allowing an unlawful patient admissions policy
resulting in artificially inflated reimbursement payments from Medicare and others.
$175 million
Pharmaceuticals
A Side A policy paid to settle a lawsuit alleging company directors breached their
fiduciary duties by allowing the illegal distribution of highly addictive opioid painkillers.
29Contact Us
For additional information about
Chubb Bermuda’s insurance products
please contact your Bermuda or
non US-based broker.
www.chubb.com/bm
If you have any questions about this
report or would like to provide feedback,
please scan here:
Chubb. Insured.
SM
Published 4/2020
The information contained in this document is intended for general marketing purposes and information only. For
terms and conditions of coverage, please refer to the specific policy wording.
Chubb Bermuda is regulated by the Bermuda Monetary Authority. It is not licensed in the U.S. as an admitted insured
nor is it an eligible excess and surplus lines insurer.
This information is intended to be illustrative of the average limits of liability being purchased by companies within
particular industry sectors, and of notable large loss industry events which have given rise to liability claims. The
Estimated Loss Amounts may or may not include defense costs. The Estimated Loss amounts shown for earlier years
have not been trended or developed.
No inference should be drawn from the loss information that such an event or resultant liability claims would (or
would not) be covered by a Chubb Policy.
© 4/2020You can also read