Lithium Niobate application note - single crystal substrates
←
→
Page content transcription
If your browser does not render page correctly, please read the page content below
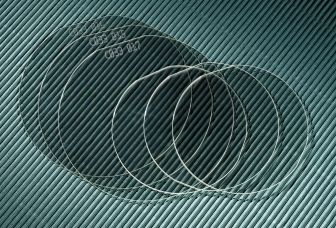
Lithium Niobate
application note – single crystal substrates

                                              Since 1967 Crystal Technology has
                                              been supplying high quality, leading
                                              edge lithium niobate (LN) for a variety
                                             of applications including SAW (surface
                                           acoustic wave) devices, integrated optic
                                        devices, refractive elements and passive
                             detectors. As a world leader in lithium niobate we are
                             committed to continuously improving the quality of LN
                             to meet the ever increasing performance demands of
                             these technologies.
In this application note, we discuss various issues that may prove       charge on the wafer causes it to act as a ‘dust magnet’, and spe-
useful to customers involved in processing lithium niobate (LN)          cial care must be taken to maintain a particulate-free environment
single crystal substrates. They reflect common concerns and              during and after thermal processing. Such charges may also cre-
questions we have encountered from existing customers using              ate mechanical strains in the crystal, and thereby increase the risk
LN in a variety of applications. The discussion is divided into the      of wafer breakage. Thermal shock should be avoided by allow-
following sections:                                                      ing for gradual heating and cooling ramps (as a rule of thumb,
                                                                         we recommend ~1 degree Celsius/minute). In routine process-
          ■   Handling                                                   ing the piezoelectric properties of LN shouldn’t present a prob-
                                                                         lem, as long as the wafer is not squeezed excessively in fixturing
          ■   Cleaning                                                   or during handling.
          ■   Surface Quality
          ■   Wafer Flatness                                             CLEANING

          ■   Crystal Polarity                                           In standard volume wafer production, CTI uses either cassette-to-
                                                                         cassette automated wafer scrubbing or sonic batch cleaning. In
                                                                         the scrubbers, the wafer surface is sprayed with an ammonia-
                                                                         based cleaning solution, scrubbed by soft nylon bristle rollers,
HANDLING                                                                 then rinsed in D.I. water and spin-dried under a dry nitrogen air-
As is the case with most substrate materials used in device manu-        jet. Sonic batch cleaning uses first an ultrasonic bath to remove
facture, operators should take the precautions of using gloves           the larger particulates (>10µm), then a megasonic bath to
and vacuum wands when handling LN substrates. The plastic                remove the smaller particulates (
SURFACE QUALITY
Scratch # Max width Dig # Max diameter
The U.S. Military Surface Quality Specification, MIL-O-13830A, is a
standard for the specification of surface quality in optical compo- (in microns) (in microns)
nents. This standard is used at CTI to specify various levels of sur- 10 1 5 50
face quality in our products, and is commonly referred to as 20 2 10 100
‘scratch-dig’. We compare our products with scratch and dig
standards manufactured according to U.S. military drawing 40 4 20 200
C7641866 Rev L, and our inspection areas are equipped with 60 6 40 400
lighting which meets the standard’s requirements.
TABLE 1. SCRATCH-DIG
In the scratch-dig system, a given quality level is expressed as two
numbers—the first specifies the maximum allowable width of
scratches, and the second specifies the maximum allowable
diameter of digs, or pits. Typical scratch-dig numbers used at CTI WAFER FLATNESS
range from 10-5 to 60-40, and specify defect size limits as shown Flatness is a critical parameter in many applications for LN wafers,
in Table 1. particularly those involving the photolithography of fine struc-
tures (TOTAL THICKNESS VARIATION (TTV)
The difference between the highest and lowest point on the top surface of
the wafer.
TTV
Total Thickness LOCAL THICKNESS VARIATION (LTV)
Variation
A stepper exposure simulation measures the difference between the highest
and lowest point on the top surface of the wafer for each exposure site.
Results can be reported as the maximum value found for each wafer or the
percent exposure sites under a given LTV value. Common site areas used are
5x5mm and 10x10mm.
Selected Focal Plane TAPER
The lack of parallelism between the back surface of the wafer and the selected
focal plane (best fit plane). The value reported is the amount of rise in the
focal plane, not the slope of the surface, and is therefore expressed in microns
Taper for the entire given diameter.
A
B
TOTAL INDICATED READING (TIR)
The difference between the highest and lowest point on the wafer surface
measured normal to the selected focal plane. This essentially removes overall
Selected taper of the wafer from the measurement.
Focal Plane TIR = |A| + |B|
A
B
Focal Plane FOCAL PLANE DEVIATION (FPD)
(retilted)
The greatest distance above or below the selected focal plane (best fit plane).
Measurements are reported as positive or negative, whichever is greater.
FPD = A or B
(whichever is greater)
WARP
The difference between the highest and lowest point on the wafer surface
measured normal to the selected focal plane in the free state.
Selected
Focal Plane Warp
Bow
BOW
The difference between the selected focal plane and the surface of the wafer
at the center in the free state. This value can be positive or negative.
Selected
Focal Plane
FIGURE 1. FLATNESS PARAMETER DEFINITIONS
1040 East Meadow Circle, Palo Alto, California 94303 Tel: 650-856-7911
www.crystaltechnology.com Fax: 650-354-0173CRYSTAL POLARITY
Many LN applications call for the specification of electrical polarity cates the polarity of a given face. In practice, we have found that
of the various faces of the fabricated substrate. Our convention heating the crystal, as opposed to squeezing it, provides the least
for specifying and measuring LN crystal polarity is based on the ambiguous result and the least potential for damaging polished
standard method described by R.S. Weiss and T.K. Gaylord in the surfaces.
article titled “Lithium Niobate: Summary of Physical Properties and
Crystal Structure,” Applied Physics A 1985, p. 192. Upon heating The diagram in figure 2 shows the measurement apparatus. A
or compression of lithium niobate across the c axis, the lithium flat clean conductive surface can serve as the bottom electrode,
and niobium ions move closer to their centered (paraelectric) and a small square of conductive foil as the top electrode. Use a
positions relative to the oxygen layers of the unit cell. This heat gun (or a blow-dryer) to gently heat the wafer and take
reduced net polarization allows a compensating buildup of elec- note of the needle deflection. If you choose to use the compres-
trons on the plus face, causing it to become negatively charged. sion method instead, use a pencil eraser or similar soft instrument
to apply a gentle, increasing pressure over the top foil electrode.
Accordingly, LN polarity is determined by measuring the charge
generated from heating or squeezing a part with a micro-volt-
meter. The deflection of the needle (positive or negative) indi-
B
Pressure
Top Voltimeter
Electrode
Positive (+) Face
Lithium Niobate
Bottom
Electrode
FIGURE 2. CRYSTAL POLARITY MEASUREMENT
References
[1] D. Mayden , “Acousto-optical Pulse Modulators”, Journal of Quantum Electronics,
vol. QE-6, no. 1, pp. 15-24 (January 1970)
[2] Young and Yao, “Design Consideration for Acousto-optic Devices, ” Proceedings of IEEE,
vol. 69, no. 1, pp. 54-64 (January 1981)
[3] Richard V. Johnson, “ Temporal Response of the Acousto-optic Modulator in the High
Scattering Efficiency Regime”, Applied Optics, vol. 18, pp. 903-907 (March 1979)
Crystal Technology, Inc. makes no warranty regarding the performance of its products as
described herein, nor do we warrant their suitability for an application. DC-18 3/01
1040 East Meadow Circle, Palo Alto, California 94303 Tel: 650-856-7911
www.crystaltechnology.com Fax: 650-354-0173You can also read