Longford County Development Plan 2015 2021
←
→
Page content transcription
If your browser does not render page correctly, please read the page content below
Longford County                                N55

Development Plan
2015 – 2021

                   14
                                                            35

   7                                              35

                         2,000m

                                  1,000m

                                           500m

                    N5
                                           2

                                                                 R198

                                                       16
                                                            19

              N4

        16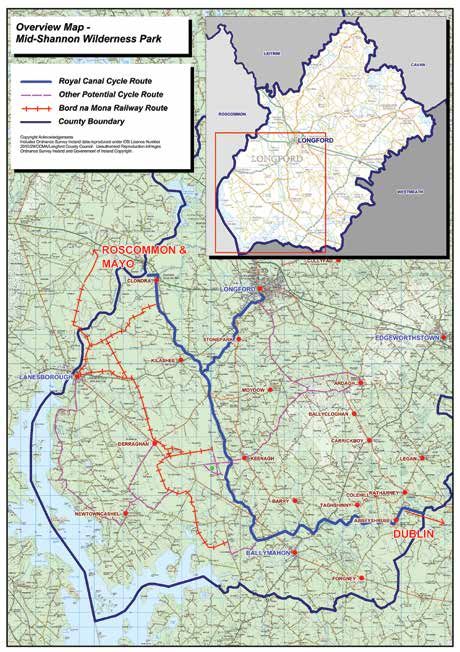
7                            35

                              2015 – 2021

    2,000m

             1,000m

                      500m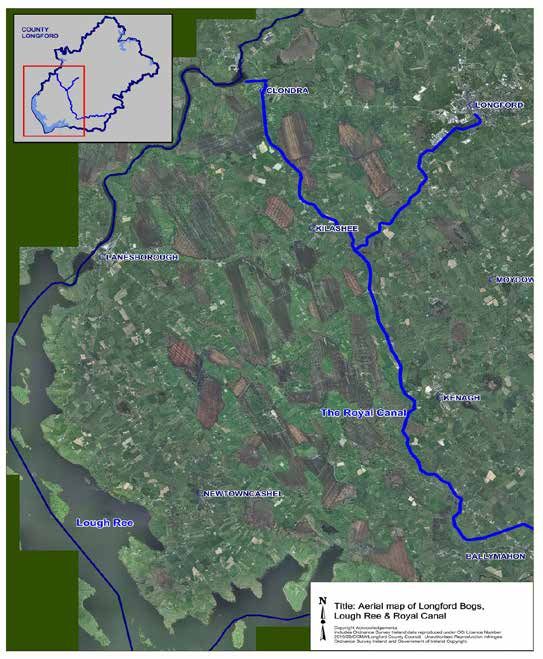
Contents
ANNEX
Annex 1: 10 5 Housing Strategy Objectives 36 Annex 2: 39 5.0 Retail Strategy and Policy Guidance 63
Housing Strategy 5.1 Key Principles of the Housing Strategy 36 Retail Strategy 5.1 Retail Objectives and Policy Recommendations 63
5.2 Development Plan Housing Objectives 36 5.2 Retail Strategy Overview 63
5.2.1 General Housing Objectives 37 5.3 Retail Objectives 64
Executive Summary 10 Executive Summary 39
5.2.2 General Objectives Relating to Social 5.4 Retail Policies 64
and Specialist Housing 37
1.0 Introduction 40 5.5 Criteria for the Assessment of Future
1. Introduction 11
5.3 Strategy Implementation 37 Retail Development 66
1.1 Methodology 11 1.1 Function of the Updated Longford Retail Strategy 40
5.6 Criteria for the Assessment of Different
1.2 Review of Part V 12 1.2 Methodology 40 Development Types 67
6 Conclusion 38
1.3 Revised Population Projections - Regional 1.3 Definition of Retail Typologies 42 5.7 Monitoring and Review 67
Planning Guidelines for the Midland Region 12 1.4 Revised Regional Planning Guidelines
for the Midland Region Population Projections 42
6.0 Conclusion 67
2. Housing in Longford: A Market Assessment 12 1.5 The Retail Hierarchy 42
2.1 Introduction 12 1.6 Core Retail Areas 43
2.2 Population and Housing Growth 2002-2011 13
2.3 Current and Future Outlook 14 2.0 Retail Trend Analysis and Assessment
of Competing Centres 44
2.1 Current Retail Trends 44
3. Housing Demand 15
2.2 Assessment of Competing Retail Centres 46
3.1 Introduction 15
3.2 Housing Demand Methodology 15
3.0 Health Check Analysis 49
3.3 Population and Household Projections 16
3.1 Retail Health Check Analysis
3.4 Disposable Income Projections 18 of County Longford 49
3.5 House Price Assessment and Projection 20 3.2 Longford Town 50
3.6 Household Affordability 23 3.3 Granard 51
3.4 Edgeworthstown 52
4. Housing Supply 29 3.5 Ballymahon 53
4.1 Housing Permitted and Completed 29 3.6 Lanesborough 53
4.2 Housing Targets 31 3.7 Other Settlements 54
4.3 Land Supply 31 3.8 Summary of Commercial Floorspace
4.4 Unfinished Housing Estates Survey 2011 32 Activity Since 2007 54
4.5 Social and Affordable Housing Provision 32 3.9 Healthcheck Conclusions 56
4.6 Meeting Social and Affordable Housing Demand 33
4.0 Projected Floorspace Requirements 56
4.6.1 Provision of Social Housing under Part V 33
4.1 Introduction 56
4.6.2 Rental Accommodation Scheme, Leasing
Initiatives and Housing Assist Payment 33 4.2 Population 56
4.6.3 Provision of Social Housing with Voluntary 4.3 Expenditure Estimates 57
Bodies and Housing Co-Operatives 34
4.4 Turnover and Floorspace Capacity 61
4.6.4 Casual Vacancies 35
4.5 Additional Retail Floorspace Requirements 62
4.6.5 Temporary Hostel Accommodation 35
4.6 Additional Retail Floorspace Requirement
4.6.6 Purchase of new or second hand dwellings 35 Summary 62
4.7 Travellers and People with Disabilities 35
4 Longford County Development Plan 2015 – 2021 5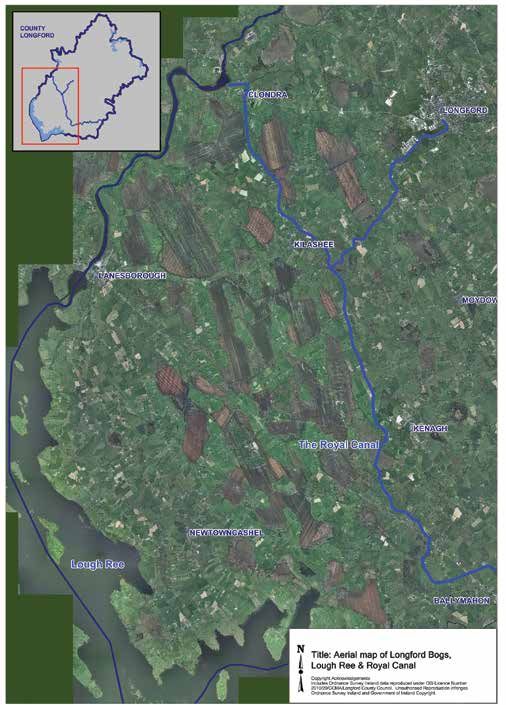
ANNEX
Annex 3: 68 Annex 4: 79 Human Influence 89 Human Influence 94
Rural Design Guidance Landscape Character • Settlement pattern 89 • Settlement pattern 94
Assessment • Transport and Communications 89 • Transport and Communications 94
• Agriculture 90 • Agriculture 94
Introduction 69
• Industry and services 90 • Industry and Services 94
1. Introduction And Context 79
Stage 1 - Basic Concepts 69 • History, Archaeology and Culture 90 • History, Archaeology and Culture 95
1.1 Scope 80
Need Type 69 • Recreation and Amenity 90 • Recreation and Amenity 95
1.1.1 Purpose and Aims 80
Longevity And Adaptability 69 Landscape Sensitivity 90 Landscape Sensitivity 95
1.1.2 Stakeholder Input 80
Sustainability 69 • Threats 90 • Threats 95
1.2 Methodology 80
Budget V 69 • Opportunities 90 • Opportunities 95
1.2.1 Desk Study 80
• Policy Responses 90 Policy Responses 95
1.2.2 Field Survey 80
Stage 2 - Site Selection 69 Landscape Unit 2 – Northern Upland 91 Landscape Unit 4 – Central Corridor 95
1.3 Current Landscape Policies 80
Location and Physical Characteristics 91 Location and Characteristics 95
1.3.1 National Spatial Strategy 80
Stage 3 – Site Layout 70 • Landcover 91 • Landcover 96
1.3.2 Midland Regional Planning Guidelines 81
Access And Roadside Frontage 70 • Topography 91 • Topography 96
1.3.3 Longford County Development Plan, 2015-2021 82
Landscaping 73 • Geology and Soils 91 • Geology 96
1.3.4 Conclusion 82
• Drainage patterns 91 • Drainage patterns 96
2. Landscape Character 83 Human Influence 92 Human Influence 96
Stage 4 – Detailed House Design 73 • Settlement pattern 92 • Settlement pattern 96
2.1 County Overview 83
Shape And Form 73 • Transport and Communications 92 • Transport and Communications 96
2.1.1 Landform 83
Annexes And Garages 74 • Agriculture 92 • Agriculture 96
(a) Topography 83
Materials And Finishes 74 • Industry and services 92 • Industry and Services 96
(b) Geology and Soils 83
Windows 75 • History, Archaeology and Culture 93 • History, Archaeology and Culture 96
(c) Drainage patterns 85
Doors And Porches 76 • Recreation and Amenity 93 • Recreation and Amenity 96
2.1.2 Landcover 85
External Finishes 76 Landscape Sensitivity 93 Landscape Sensitivity 97
2.1.3 Human Influence 86
Roofs 77 • Threats 93 • Threats 97
(a) Settlement pattern 86
Contemporary House Design 78 • Opportunities 93 • Opportunities 97
(b) Agriculture 87
(c) Forestry 87 Policy Responses 93 Policy Responses 97
(d) Archaeology 87 Landscape Unit 3 – Shannon Basin/Lough Ree 93 Landscape Unit 5 – Inny Basin 97
(e) Culture 88 Location and Physical Characteristics 93 Location and Characteristics 97
2.2 Landscape Character Units 88 • Landcover 93 • Landcover 97
Landscape Unit 1 – Northern Drumlin Lakeland 88 • Topography 94 • Topography 97
Location and Physical Characteristics 88 • Geology 94 • Drainage patterns 97
• Landcover 89 • Drainage patterns 94
• Topography 89
• Geology/Soils 89
• Drainage patterns 89
6 Longford County Development Plan 2015 – 2021 7
ANNEX
Human Influence 98 Landscape Sensitivity 102 Annex 5 111 Annex 6 120
• Settlement pattern 98 • Threats 102 The Corlea Archaeological Mid Shannon
• Transport and Communications 98 • Opportunities 102 Settlement and Biodiversity Wilderness Park
• Agriculture 98 Policy Responses 102 Project
• Industry and Services 98
• History, Archaeology and Culture 98 2.3 Identification of Visual Units 102 1. Scope of Works 112 1. Introduction 121
• Recreation and Amenity 98 2.4 Identification of Image Units 102 1.1 Introduction 112
Landscape Sensitivity 98 2. Future of the Longford Bogs 121
1.2 Purpose of the Project 112
• Threats 98 3. Landscape Values 102 2.1 Draft National Peatlands Strategy 2014 121
1.3 Project Sequential Approach 112
• Opportunities 98 2.2 Bord na Mona Bogs 122
1.4 An Ecotourism Project 113
Policy Responses 98 4. Landscape Sensitivity 103
2.3 Corlea Archaeological Project 123
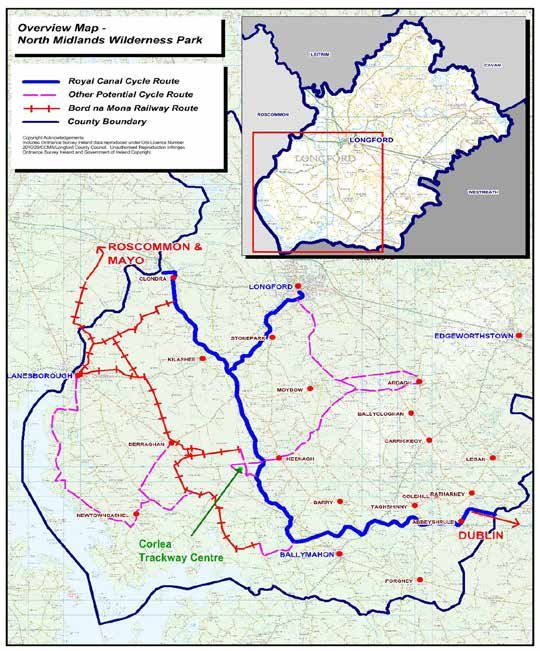
Landscape Unit 6 – Peatlands 98 2. Description of the Project 114
Appendix 1 – Landscape Unit Maps 104
Location and Characteristics 98 2.1 Archaeology 115 3.0 Mid Shannon Wilderness Park 123
• Landcover 98 2.2 Biodiversity 116 3.1 Amenity Potential of Mid Shannon
Wilderness Park 124
• Topography 98 2.2.1 Nature Conservation and biodiversity corridors 117
• Drainage patterns 99
4.0 An Ecotourism Project 127
Human Influence 99
3. Mid Shannon Wilderness Park 117 4.1 Biodiversity 127
• Settlement pattern 99
4.2 Nature Conservation and Biodiversity Corridors 128
• Transport and Communications 99 Maps:
• Agriculture 99 Map 3: Bord na Móna Bogs 117 5.0 Time Frame for Mid Shannon
• Industry and Services 99 Wilderness Park 128
Map 4: Lanesboro/Roscommon Bogs 117
• History, Archaeology and Culture 99 Map 5: Mid Shannon Wilderness Park 118
• Recreation and Amenity 99 Map 6: Walking/Cycling Network Map 119
Landscape Sensitivity 100
• Threats 100
• Opportunities 100
Policy Responses 100
Landscape Unit 7 – Open Agricultural 100
Location and Characteristics 100
• Landcover 100
• Topography 100
• Drainage patterns 100
Human Influence 100
• Settlement pattern 100
• Transport and Communications 101
• Agriculture 102
• Industry and Services 102
• History, Archaeology and Culture 102
• Recreation and Amenity 102
8 Longford County Development Plan 2015 – 2021 9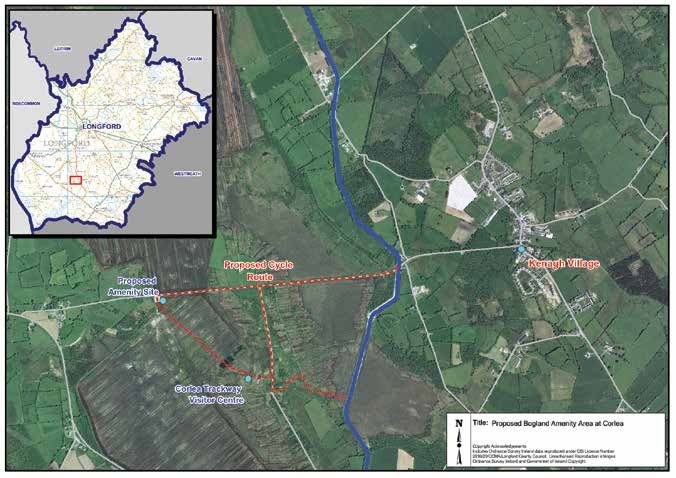
14 This strategy is framed in the context of the Government’s –– An assessment of the changing demographic profile of
ANNEX
current stated position with respect to Part V of the Planning Longford suggests there will be an identifiable need to
and Development Act 2000 (as amended) and takes account of provide a greater mix of housing types and sizes in the
the recently revised population forecasts for County Longford future, including that to cater for specialist needs such
contained within the Regional Planning Guidelines for the as the elderly and those with disabilities.
Midland Region 2010-2022. The strategy has been prepared
–– The Housing Strategy is being drafted during a period
against the backdrop of significant challenges in the current
of great uncertainty in the housing market and the Irish
housing market and accordingly, it draws on relevant national
economy, and should therefore be kept under review,
and local market expertise to inform both the approach taken
as necessary, in line with provisions in the Planning and
and subsequent findings.
Development Acts 2000 (as amended) to take account of
The main findings and recommendations of this Housing any significant changes in the housing market or in national
Strategy include the following: planning policy.
–– Drawing upon the Regional Planning Guidelines for the
Midland Region’s1 revised population forecasts, the
population of Longford is expected to increase by 5,603 1.
people over the period 2011-2022.
Introduction
–– The number of households in County Longford is expected
to increase from 14,748 in 2011 to approximately 16,980 in This Housing Strategy has been prepared by Future Analytics
2022, an increase of 2,335 units, or the equivalent of a per Consulting on the behalf of the Longford Local Authorities to
annum average of 212 units. meet statutory requirements set out under the Planning and
Development Acts 2000 (as amended) and in particular Part V
–– The average household size in 2011 was 2.64 and this is
of said Act. It also addresses relevant provisions contained
projected to fall to 2.40 by 2022. This will invariably have
within the Housing (Miscellaneous Provision) Act, 2009.
35
ANNEX implications on the annual target for housing production
7
over the life of the Housing Strategy which will fluctuate Under Part V of the Act, each planning authority must prepare a
accordingly. The reduced household size will also result Housing Strategy which will cover the period of its Development
Annex 1: in pressure for more units to accommodate the envisaged
population growth.
Plan. Each strategy must have regard to the proper planning
and sustainable development of the area and must address the
Housing Strategy –– This strategy identifies the need to provide 2,120 housing
overall supply of housing within the administrative boundary
of the Local Authority. Within this, the Planning Authority has a
units up to and including the end of the plan period in 2021.
statutory obligation to address needs for social and affordable
It is considered that there is currently enough zoned lands in
housing and to ensure that sufficient land is zoned for housing
the county to address future requirements.
over the period of its plan.
Executive Summary –– The anticipated social housing need for County Longford
between 2012-2021 is 293 units. On average, there is likely 1.1
to be a shortfall in the delivery of social housing of between Methodology
Future Analytics Consulting (FAC) was appointed by the 13.07% and 15.67% over this period. This equates to an
Longford Local Authorities to prepare a Housing Strategy average shortfall of 13.85% and this strategy proposes The previous Longford County Housing Strategy 2007-2016
was prepared during a period of unprecedented growth in the
to inform the County Development Plan for the period that the Longford Local Authorities set a requirement of a
minimum of 14% of units on all land zoned for residential national property market. The fundamental changes that have
2015-2021. uses for the purpose of social/specialised housing. taken place in the economy, and in particular, the housing
market in intervening years means that many assumptions
The overarching purpose of this Housing Strategy –– There is a significant number of constraining factors underpinning the previous strategy have changed considerably.
is to ensure that the proper planning and sustainable restricting the delivery of social housing in the current High levels of market uncertainty and the changing nature
climate and it is envisaged that future requirements will be of housing demand, including mitigating factors such as
development of Longford provides for the housing addressed via a combination of options including the Rental income, demographics and credit conditions are key aspects
needs of existing and future populations in an Accommodation Scheme (RAS) and partnership working with which underline the current housing market and the applied
appropriate manner. Voluntary Bodies and Housing Cooperatives. methodology considers these aspects in detail, providing a
robust and credible basis for the assessment of future housing
need in Longford.
2,000m
1
For reference purposes please see Section 1.3
of this document
10 Longford County Development Plan 2015 – 2021 11
This Housing Strategy has been prepared in accordance with 1.3 These connections between housing and population vary over At 25.31%, population growth in the Midland Region
ANNEX
national legislation and relevant guidance, with the stated aim Revised Population Projections - time and between places, and because of this, where possible, outstripped recorded levels of national growth over the period
of addressing the following: Regional Planning Guidelines local circumstances as well as prevailing economic and market of 2002-2011. A cursory comparison of Longford’s population
for the Midland Region conditions should be considered when producing a Housing performance relative to other counties in the Midland Region
–– To ensure that the overall future supply of housing in County
Strategy. This section provides an overview of national, regional reveals that in terms of levels of growth in the period 2006-2011,
Longford is sufficient to address planned population growth; The Regional Planning Guidelines for the Midland Region 2010-
and local housing activity in Longford over the last ten years, County Longford was only surpassed by County Laois (20.13%)
2022 (RPG) set a 2016 population target of 39,392 people for
–– To ensure that adequate housing is made available for people and draws on local auctioneer and market expertise to provide over that period, but this trend should also be framed in the
County Longford. High levels of housing delivery and significant
on different income levels in the County; commentary on the current and future outlook for the market. context of actual growth over that time – Longford’s percentage
in-migration to the County has resulted in the 2016 target
share of the total population growth in the Midlands Region only
–– To ensure that a mixture of house types and sizes is being exceeded in advance of the forecasted period. A revised
2.2 increased marginally from 13.78% in 2002 to 13.81% in 2011.
developed to reasonably match the requirements of different population target for 2016 of 43,080 people has subsequently
Population and Housing Growth As illustrated in Table 2.1 below, population gains were made
households in the County; been agreed with the Midland Regional Authority, and this
2002-2011 between 2006-2011, relative to Offaly and Westmeath, but they
target provides the basis for housing modelling carried out in
lagged behind that exhibited by Laois over this period.
–– To address the need for social housing in County Longford. this strategy. Between 2002-2011 the population of the state increased from
In line with statutory requirements contained within the 3,917,203 to 4,581,269 people, a growth rate of almost 17%.
Department of Environment, Community and Local Government Population growth over 2002-2006 was typified by trends
guidance Development Plans - Guidelines for Planning of strong net-inward migration, which has been tempered
2. considerably in recent years, by significant net outward migration.
Authorities, Longford County Council has an obligation to ensure
that sufficient zoned land is available to meet residential needs
Housing in Longford:
for the next 9 years and this strategy therefore covers the period A Market Assessment
to 2024. Table 2.1
Longford and Midland Region Population Analysis 1996-2011
A key intention was to produce a succinct and readable strategy
document. To avoid duplication with content in the Longford SUMMARY
County Development Plan 2015-2021, this document does not Area/ Popula- Popula- Popula- Popula- % Change % Change % Change Overall %
–– The population of Longford increased by 25.31%
include a chapter setting out the background policy context. Region tion 1996 tion 2002 tion 2006 tion 2011 1996-2002 2002-2006 2006-2011 Change
between 2002-2011.
1996-2011
1.2 –– Between 2006-2011, there was a 7% increase in the Laois 52,945 58,774 67,059 80,559 11.01 14.10 20.13 52.16
Midland Region
Review of Part V population of Longford Town, a 6% increase in Granard,
Longford 30,166 31,068 34,391 39,000 2.99 10.69 13.40 29.28
while Edgeworthstown and Ballymahon recorded
In June 2011, the Government published a ‘Housing Policy Offaly 59,117 63,663 70,868 76,687 7.69 11.32 8.21 29.72
population growth rates of 23% and 29% respectively.
Statement’ which will function as a framework to address short Westmeath 63,314 71,158 79,346 86,164 12.49 11.51 8.59 36.08
to medium term issues in the housing market. While reaffirming –– The average household size in County Longford fell
Total 205,452 225,363 251,664 282,410 9.69 11.67 12.22 37.46
the Government’s commitment to addressing social housing from 3.24 in 1996 to 2.64 in 2011.
needs, this statement outlined their intention to stand down
–– There were 3,051 housing completions in Longford
all existing affordable housing programmes to reflect current
over the period 2007-2013. Figures 2.2
affordability conditions. These will be wound up as part of
the ongoing review of Part V of the Act. The Government has
2 Longford and State Population Profiles 2011
–– The lowest average house prices in the country
outlined that a decision is not being taken to end Part V fully, are currently found in Longford at €132,000.
rather that it may be recast to incorporate relevant changes Longford 2011 – State 2011 –
Male Female Male Female
as necessary. This strategy is framed in the context of the –– The current average asking price of a 1 bed
Age and Population Age and Population
Government’s current stated position with respect to Part apartment in Longford is approximately €43,000
V. Further consideration is given to available social housing and a 4 bed bungalow approximately €159,500. Years Years
delivery mechanisms in Section 4. 85 & over 85 & over
80 – 84 80 – 84
75 – 79 75 – 79
70 – 74 70 – 74
2.1 65 – 69 65 – 69
60 – 64 60 – 64
Introduction
55 – 59 55 – 59
50 – 54 50 – 54
A strong understanding of recent activity in the wider housing 45 – 49 45 – 49
40 – 44 40 – 44
market as well as that in County Longford is an important
35 – 39 35 – 39
starting point in the preparation of a Housing Strategy for the 30 – 34 30 – 34
25 – 29 25 – 29
county. Population and housing are intrinsically interlinked. An
20 – 24 20 – 24
2
On 29th February 2012, the DoECLG issued a circular increase in population influences housing by creating housing 15 – 19 15 – 19
10 – 14 10 – 14
which stated that pending the outcome of the review in demand. Conversely, the availability of housing influences house
5–9 5–9
negotiating agreements under section 96, Part V obligations prices and the resulting number of people and households who 0–4 0–4
should be discharged through mechanisms that place no can potentially migrate into an area, affecting total population.
6% 4% 2% 2% 4% 6% 6% 4% 2% 2% 4% 6%
additional funding pressures on authorities.
12 Longford County Development Plan 2015 – 2021 13
The major settlements in Longford, namely those identified 2.3 3. 3.1
ANNEX
within the settlement hierarchy of the RPGs and the Longford Current and Future Outlook Introduction
County Development Plan Core Strategy, experienced varying
Housing Demand
Significant challenges remain in the national housing market. The determination of housing demand over the operational
levels of population growth between 2006-2011. These included
Latest research from Daft.ie and Myhomes.ie indicates that period of the Development Plan is a fundamental cornerstone
a 7% increase in the population of Longford Town, and a 6% SUMMARY
house prices outside of Dublin are continuing to fall, although of the overall Housing Strategy. It is essential that all relevant
increase in Granard, but more pronounced increases took place
the rate of decline is moderating. Positively, there are signs –– The population of the County is projected and available data is considered and applied where appropriate.
in Edgeworthstown and Ballymahon, which recorded growth
of a general pick-up in activity, if not prices, in the market. to increase by 5,603 persons between 2011-2022. The demand side model draws on key research information
rates of 23% and 29% respectively.
Mortgage availability remains a constraining influence. The from the Department of the Environment, Community and Local
cost of borrowing, coupled with the requirement for larger ‘up –– The number of households in County Longford Government (DoECLG), the Central Statistics Office (CSO) and the
Figure 2.3 front’ deposits, and relative job security, is inhibiting some first is expected to increase from 14,410 in 2011 to Economic and Social Research Institute (ESRI) to reflect the latest
Longford Population Change 2006-2011 time buyers, but cash sales are predominating in some areas. approximately 16,745 in 2022, an increase of 2,335 position with respect to the housing market and the documented
It is estimated that there are approximately 43,000 properties houses or the equivalent of a per annum average outputs are the product of considered scenario testing.
for sale around the country, with almost 40% of homes finding of 212 units.
a buyer within four months, up from 33% a year ago. Notably, 3.2
–– Approximately one third of the households in
the lowest average house prices in the country are found in Housing Demand Methodology
Longford have an average annual disposal income of
Longford at €132,0003, with the market in the County generally
€14,749.00 (about €283.63 per week).
comparable with that of Leitrim, Roscommon, Laois, and The following key steps have been taken to determine the
Monaghan. Year on year house prices in Longford are down –– Affordability modelling suggests that approximately housing demand for County Longford up to and including the
5.5% , but this compares favourably to more pronounced
4
293 social housing units will have to be delivered over plan period of 2015 to 2021, and beyond.
decreases in Westmeath (-9.8%), Offaly (-11%) and Laois the period to 2021.
(-20.4%) over the same period. In line with national trends, the
price of apartments has fallen considerably more than larger –– On average, there is likely to be a 13.85% shortfall in
houses in the County. The current average asking price for a 1 the delivery of social housing over the period to 2021.
bed apartment is Longford is approximately €43,000 and a 4 bed
bungalow approximately €159,500.
Local auctioneers also testify to some variations in asking prices
Housing delivery is often considered to be a more immediate across the County, with Longford Town particularly displaying
reflection of prevailing market conditions within an area – an resilience in terms of its rental and house sales market due to
indicator of how the market operates and fluctuates in ‘real demand for good quality houses and apartments. Local insight
time’, and this has been particularly evident in the peaks and also suggests that there is an emerging trend of investors Step 1 Step 2
troughs displayed by the Irish housing market over the last purchasing houses in traditionally lower value areas due to the A detailed assessment of the Longford County Calculation of average household size and additional
ten years. Overall, from the late 1990s until the economic presence of strong rental demand. There is general consensus population projections for the period 2015 to 2021 households required to cater for the projected
collapse in 2007, Ireland experienced strong housing demand that market momentum should gather pace over the next couple based on the revised Regional Planning Guidelines for additional population from 2015–2021, including
influenced by population growth, a reduction in household sizes, of years as part of the envisaged recovery scenario for the the Midland Region population forecasts. implied assumptions on average household size
increased age groups with higher household formation rates, economy. In the longer term, localised demographic factors such over that period.
together with net immigration. Additional factors also included as the rise in the cumulative birth rate5 and lower occupancy
an increase in divorce rates, higher incomes and a significant rates may require a revised approach to housing provision in the
investment in the buy-to-let property market. This is evidenced County, including a wider assessment of housing mix typologies
Step 3 Step 4
locally in Longford by the fall in average household size in the with respect to dwelling type, size and affordability levels.
Estimated distribution of household disposal Calculation of household disposable income distribution
County from 3.24 in 1996 to 2.64 in 2011. A total of 2,849 houses
incomes in the County for 2015–2021 based from 2015–2024 based on the ESRI Medium Term
were built between 2007 and 2011, with the majority of these
on the 10 decile income ranges set out in the Review 2013 – 2020 (July 2013).
units having been constructed in the period 2007-2009, fuelling
CSO Household Budget Survey (2012)
the recorded population growth in the County over this period.
Further analysis on housing supply is explored in Section 4.
Step 5: Step 6
Assessment of average house prices in the State and Calculation of projected house price bands for Longford
in Longford County and Town from 2000–2012 – based County for the years 2015– 2021 based on evidenced
on the DoECLG Database Direct for Housing Statistics assumptions relating to average house price decreases
(August 2013). and increases over the time period.
3
The Daft.ie House Price Report, April 2013
4
As at April 2013.
5
The Longford population in the 0-4 age group increased by
958 persons or 28% between 2002-2011
14 Longford County Development Plan 2015 – 2021 15
The Census 2011 results indicate that Longford has a As summarised in Table 3.2 below, the number of households in
ANNEX
Step 7 Step 8
population to household ratio of 2.71. In line with national County Longford is expected to increase from 14,410 in 2011 to
Determination of annual income distribution of total Determination of income distribution of annual
trends, household size in the County has declined in recent approximately 16,745 in 2022, an increase of 2,335 houses, or
households in County Longford from 2015 – 2021 based additional households required for Longford from
decades and it is envisaged that this trend will continue in the equivalent of a per annum average of 212 units.
on the 10 income decile ranges, with reference to source 2015–2021, based on 10 decile income ranges, County
the foreseeable future. The RPGs project an occupancy rate of
documents including the CSO’s Household Budget Longford Development Plan 2009–2015, DoECLG’s ‘A Please note:
2.4 over the period to 2022, and in compliance with this, the
Survery 2009–2010 and 2004–2005. Model Housing Strategy and Step-by-Step Guide, 2000’. The relationship between projected population and household
Housing Strategy projects this ratio forward over the intervening
growth in absolute terms over the study period may not directly
period. Through this process, the strategy is consistent with the
sum due to the uniform application of an average household
Regional Planning Guidelines.
size of 2.4 over this period, which discounts existing household
By applying the relevant household size to projected population formation rates and assumes that all households in the county
increases, it is possible to forecast required household numbers will consist of 2.4 people over this period.
Step 9 Step 10
to 2022.
Calculation of house price affordability for Longford Calculation of anticipated social and affordable housing
County from 2015–2021, based on the calculated need and associated shortfall for Longford County from
household disposable income distribution and the 2015-2021 based on the number of households required,
Table 3.2:
application of the annuity formula. housing affordability, household band position, house
Projected Additional Houses Required Per Annum from 2012-2024
price bands, number of houses required within each
band, and percentage and number of housing units
projected to be provided within each band. Year Annual Population Increase Average Household Size Additional Houses Number of Households
from 2012 to 2024 Required Per Annum
1996 3.24 - 9,320
2002 3.11 - 9,996
3.3 In accordance with the revised RPG population forecasts,
Population and Household Projections the population of the County is projected to increase by 2006 2.86 - 12,042
5,603 people between 2011-2022, which reflects a 14%
The starting point in any assessment of demand for housing 2011 2.71 - 14,410
increase over that period. The population of Longford Town
over the Development Plan period 2015- 2021 is projected
is forecast to increase from 8,002 to approximately 12,926 2012 497 2.4 207 14,617
population growth for this period.
people over the same timeframe.
2013 503 210 14,826
2014 509 212 15,039
Table 3.1:
Projected Population Growth in County Longford, 2011-2024 2015 516 215 15,254
2016 522 218 15,471
Year Longford County Annual Population Increase Longford Town Remainder of County 2017 495 206 15,678
Population from 2011 to 2024 Population
2018 501 209 15,887
2011 39,000 - 8,002 30,988
2019 507 211 16,098
2012 39,497 497 - -
2020 513 214 16,312
2013 40,000 503 - -
2021 519 216 16,528
2014 40,509 509 - -
2022 519 216 16,745
2015 41,025 516 - -
2023 532 222 16,966
2016 41,547 522 10,240 31,306
2024 535 223 17,189
2017 42,042 495 - -
2018 42,544 501 - -
2019 43,051 507 - -
2020 43,564 513 - -
2021 44,084 519 - -
2022 44,603 519 12,926 31,677
2023 45,135 532 13,080 32,055
2024 45,670 535 13,235 32,435
16 Longford County Development Plan 2015 – 2021 17
3.4 6
Section 93 of the Planning and Development Act 2000, To inform the forward projection of future affordability in 10
Published July 2013.
ANNEX
Disposable Income Projections defines ‘affordability’ as “a person who is in need of Longford, the baseline figures are then inflated annually using
11
This includes an additional 3 years to take account
accommodation and whose income would not be adequate forecasted average disposable household income growth rates
Disposable income is the amount of income, after tax is of the previously stated requirement to report to 2024.
to meet the payments of a mortgage for the purchase of a from the Economic and Social and Research Institute (ESRI). The
deducted, that is available for spending and saving. It
house to meet his or her accommodation needs because the latest projections from the Medium Term Review 2010-202010 set
functions as an important measure of housing affordability6
payments calculated over the course of a year would exceed out a scenario-based approach to future growth. Based on the
in an area i.e. the ability of a household to purchase their
35% of that person’s annual income net of income tax and current economic outlook, a recovery-based scenario average of
own home. Current estimates of household disposal income
pay related social insurance...” 3.6% per annum has been applied over the plan period, which for
are derived from the CSO Household Budget Survey (2012).
reference, compares with an average growth rate figure of 7.1%
This resource provides a snapshot of national household 7
The measure of price inflation/deflation in an area, relative contained within the previous Housing Strategy. The key outputs
budgets, which have to be adjusted for county-level to the national measure at that time. of this are shown in Table 3.4 below, which highlights a notable
analysis. A deflator7 of 0.88 has been extracted from the
difference in average disposable incomes across the County for
CSO report on County Incomes and Regional GDP 20108 and
8
Published February 2013
the 10 decile income ranges for each of the projected years11.
applied for such purposes. 9
1st, 2nd and 3rd Deciles
Table 3.3 below illustrates the outputs of this exercise, with
findings disaggregated into ten income segments or ‘deciles’
and applied to the proportion of households in Longford
within each decile. It indicates that after taxes, about one Table 3.4:
third of the households in Longford have an average annual
9 Average Annual Disposable Income for County Longford,
disposable income of €14,749, or the equivalent of €283.63 2011-2024 (D)
per week.
Year 2011 2012 2013 2014 2015 2016 2017 2018 2019 2020 2021 2022 2023 2024
Table 3.3 % - 3.6% 3.6% 3.6% 3.6% 3.6% 3.6% 3.6% 3.6% 3.6% 3.6% 3.6% 3.6% 3.6%
Growth
Estimated Distributions of Household Disposable
Incomes for County Longford, 2011 1st 9,040 9,366 9,703 10,052 10,414 10,789 11,177 11,580 11,996 12,428 12,876 13,339 13,819 14,317
Decile
2nd 14,520 15,043 15,584 16,145 16,726 17,329 17,952 18,599 19,268 19,962 20,681 21,425 22,196 22,995
Income Average Average Average Per- Assumed Adjusted Percent- Average Longford Average Num- Decile
Range Weekly Weekly Weekly centage Annual Average age of Annual County Annual ber of
Dispos- Dispos- Dispos- Change Per- Weekly House- Dispos- Deflator Dispos- House- 3rd 20,689 21,434 22,206 23,005 23,833 24,691 25,580 26,501 27,455 28,444 29,467 30,528 31,627 32,766
Decile
able able able from centage Dispos- holds able able holds in
Income Income Income 2004- Income able in Each Income Income Longford 4th 25,960 26,895 27,863 28,866 29,905 30,982 32,097 33,252 34,450 35,690 36,975 38,306 39,685 41,113
(State) (State) (State) 2005 to Increase Income Category (State) (Longford) (2011) Decile
(€) (€) (€) 2009- from (State) (State) (€) (2011) (€) (2011)
(1999- (2004- (2009- 2010 2005 to (€) (2011) 5th 31,279 32,405 33,571 34,780 36,032 37,329 38,673 40,065 41,508 43,002 44,550 46,154 47,815 49,537
2000) 2005) 2010) 2010 Decile
1st 106.23 158.99 188.91 18.8% 3.76% 196.02 11.57% 10,193.05 0.887 9,040.14 1,667 6th 37,232 38,572 39,960 41,399 42,889 44,433 46,033 47,690 49,407 51,186 53,028 54,937 56,915 58,964
Decile Decile
2nd 174.42 244.65 300.98 23.0% 4.60% 314.84 10.54% 16,371.68 0.887 14,519.93 1,519 7th 45,028 46,649 48,329 50,069 51,871 53,738 55,673 57,677 59,754 61,905 64,133 66,442 68,834 71,312
Decile
Decile
8th 54,748 56,719 58,761 60,876 63,068 65,338 67,691 70,127 72,652 75,268 77,977 80,784 83,693 86,705
3rd 249.38 359.12 431.28 20.1% 4.02% 448.61 9.48% 23,327.82 0.887 20,689.28 1,366
Decile
Decile
9th 68,413 70,876 73,427 76,071 78,809 81,646 84,586 87,631 90,786 94,054 97,440 100,948 104,582 108,347
4th 331.71 488.30 549.20 12.5% 2.49% 562.90 9.60% 29,270.75 0.887 25,960.03 1,383 Decile
Decile
10th 106,125 109,946 113,904 118,005 122,253 126,654 131,213 135,937 140,831 145,901 151,153 156,595 162,232 168,072
5th 423.00 628.31 669.46 6.5% 1.31% 678.23 9.74% 35,267.91 0.887 31,278.86 1,404 Decile
Decile
6th 515.73 779.53 802.56 3.0% 0.59% 807.30 9.56% 41,979.71 0.887 37,231.51 1,378
Decile
7th 617.61 950.84 972.03 2.2% 0.45% 976.36 9.81% 50,770.85 0.887 45,028.31 1,414
Decile
8th 743.44 1,167.54 1,183.82 1.4% 0.28% 1,187.12 9.58% 61,730.31 0.887 54,748.19 1,380
Decile
9th 925.52 1,420.76 1,472.66 3.7% 0.73% 1,483.42 9.78% 77,137.80 0.887 68,412.98 1,409
Decile
10th 1,428.71 2,232.01 2,289.38 2.6% 0.51% 2,301.15 10.34% 119,659.74 0.887 106,125.40 1,490
Decile
Total 100.00% 14,410
18 Longford County Development Plan 2015 – 2021 193.5 As part of the price assessment and projection for County The projections for household income to 2021 are applied to the Tables 3.6 and 3.7 below set out the average annual and
ANNEX
House Price Assessment Longford, it is important to determine, generally, current house DoECLG Model Housing Strategy annuity formula to determine monthly disposable incomes for Longford for the period 2012-
and Projection price sales and how they may fluctuate over the plan period. the maximum affordable house price for each of the ten 2024 and Table 3.8 summarises the outputs from the annuity
Table 3.5 below outlines the projected calculated house prices disposable income decile ranges. The key variables used in the calculation, detailing the approximate affordable house prices in
Section 2 of this strategy sets out in detail background
bands for County Longford from 2008-2024. This table has been annuity formula include an affordability threshold of a maximum County Longford to 2024.
information on house price trends in the current market.
calculated using the CSO Residential Property Price Index (July of 35% expenditure of household income on mortgage costs,
2013) and reflects a nominal 1% increase in house prices in 2015 a loan to value ratio of 0.80, an annual interest rate (APR) of
and 2016 rising to a 4% increase between 2021-2024. 3.95%, and a loan term of 25 years.
Table 3.5
Table 3.6
Affordability Analysis and Associated Affordable
Average Annual Household Disposable Income
Housing Demand 2008-2024
in County Longford, 2012-2024
Aver- 1st 2nd Band - X1-X2 3rd Band - X2-X3 4th Band - X3-X4 5th Band - X4-X5 6th Band - X5-X6 7th Band - X6-X7 8th
age Band Band - Range % of Average Annual Household Disposable Income - Longford County - 2012-2024 (€)
Price - not exceed- Households
In- exceed- ing X7 in Each
crease/ ing X1
Category
De-
(Longford)
crease
2008 - 150,000 150,001 200,000 200,001 250,000 250,001 300,000 300,001 350,000 350,001 400,000 400,001 500,000 500,000
2012 2013 2014 2015 2016 2017 2018 2019 2020 2021 2022 2023 2024
1st 11.57% 9,366 9,703 10,052 10,414 10,789 11,177 11,580 11,996 12,428 12,876 13,339 13,819 14,317
Decile
2009 -16.20% 125,700 125,701 167,600 167,601 209,500 209,501 251,400 251,401 293,300 293,301 335,200 335,201 419,000 419,000
2nd 10.54% 15,043 15,584 16,145 16,726 17,329 17,952 18,599 19,268 19,962 20,681 21,425 22,196 22,995
2010 -11.40% 111,370 111,371 148,494 148,494 185,617 185,618 222,740 222,741 259,864 259,865 296,987 296,988 371,234 371,234 Decile
3rd 9.48% 21,434 22,206 23,005 23,833 24,691 25,580 26,501 27,455 28,444 29,467 30,528 31,627 32,766
2011 -13.00% 96,892 96,893 129,189 129,190 161,487 161,487 193,784 193,785 226,082 226,082 258,379 258,380 322,974 322,974
Decile
2012 -11.40% 85,846 85,847 114,462 114,462 143,077 143,078 171,693 171,693 200,308 200,309 228,924 228,924 286,155 286,155 4th 9.60% 26,895 27,863 28,866 29,905 30,982 32,097 33,252 34,450 35,690 36,975 38,306 39,685 41,113
Decile
2013 0.00% 85,846 85,847 114,462 114,462 143,077 143,078 171,693 171,693 200,308 200,309 228,924 228,924 286,155 286,155
5th 9.74% 32,405 33,571 34,780 36,032 37,329 38,673 40,065 41,508 43,002 44,550 46,154 47,815 49,537
Decile
2014 0.00% 85,846 85,847 114,462 114,462 143,077 143,078 171,693 171,693 200,308 200,309 228,924 228,924 286,155 286,155
6th 9.56% 38,572 39,960 41,399 42,889 44,433 46,033 47,690 49,407 51,186 53,028 54,937 56,915 58,964
Decile
2015 1.00% 86,705 86,705 115,606 115,607 144,508 144,509 173,410 173,410 202,311 202,312 231,213 231,213 289,016 289,016
7th 9.81% 46,649 48,329 50,069 51,871 53,738 55,673 57,677 59,754 61,905 64,133 66,442 68,834 71,312
2016 1.00% 87,572 87,572 116,763 116,763 145,953 145,954 175,144 175,144 204,334 204,335 233,525 233,526 291,906 291,906 Decile
8th 9.58% 56,719 58,761 60,876 63,068 65,338 67,691 70,127 72,652 75,268 77,977 80,784 83,693 86,705
2017 2.00% 89,323 89,324 119,098 119,098 148,872 148,873 178,647 178,647 208,421 208,422 238,196 238,196 297,744 297,744
Decile
2018 2.50% 91,556 91,557 122,075 122,076 152,594 152,595 183,113 183,113 213,632 213,632 244,150 244,151 305,188 305,188 9th 9.78% 70,876 73,427 76,071 78,809 81,646 84,586 87,631 90,786 94,054 97,440 100,948 104,582 108,347
Decile
2019 3.00% 94,303 94,304 125,737 125,738 157,172 157,172 188,606 188,607 220,041 220,041 251,475 251,476 314,344 314,344
10th 10.34% 109,946 113,904 118,005 122,253 126,654 131,213 135,937 140,831 145,901 151,153 156,595 162,232 168,072
Decile
2020 3.50% 97,604 97,604 130,138 130,139 162,673 162,674 195,207 195,208 227,742 227,743 260,277 260,277 325,346 325,346
100%
2021 4.00% 101,508 101,509 135,344 135,344 169,180 169,180 203,016 203,016 236,852 236,852 270,688 270,688 338,360 338,360
2022 4.00% 105,568 105,569 140,758 140,758 175,947 175,948 211,136 211,137 246,326 246,326 281,515 281,516 351,894 351,894
2023 4.00% 109,791 109,792 146,388 146,389 182,985 182,986 219,582 219,583 256,179 256,180 292,776 292,776 365,970 365,970
2024 4.00% 114,183 114,183 152,243 152,244 190,304 190,305 228,365 228,366 266,426 266,427 304,487 304,488 380,608 380,608
% of Longford 2.50% 13.50% 15.50% 17.50% 14.50% 10.50% 11.50% 14.50%
Housing Units within
each Band based on
Whole Country
20 Longford County Development Plan 2015 – 2021 21Table 3.7 Table 3.9 below provides a breakdown of the total additional
ANNEX
Average Monthly Disposable Income in County Longford, 2012-2024 housing units required over the period of 2012-2024 based on
the ten decile range. This analysis is based on the revised RPG
targets for County Longford up to year 2022.
Range % of Average Monthly Disposable Income - Longford County - 2012-2024 (€)
Households
in Each
Category
(Longford)
Table 3.9
2012 2013 2014 2015 2016 2017 2018 2019 2020 2021 2022 2023 2024
Required Additional Households in County Longford, 2012-2024
1st 11.57% 780 809 838 868 899 931 965 1,000 1,036 1,073 1,112 1,152 1,193
Decile
2nd 10.54% 1,254 1,299 1,345 1,394 1,444 1,496 1,550 1,606 1,663 1,723 1,785 1,850 1,916 In- % of House- Total Additional Households - Longford County - 2012-2024 (€)
Decile come holds in Each
Range Category
3rd 9.48% 1,786 1,850 1,917 1,986 2,058 2,132 2,208 2,288 2,370 2,456 2,544 2,636 2,730 (Longford)
Decile
2012 2013 2014 2015 2016 2017 2018 2019 2020 2021 2022 2023 2024
4th 9.60% 2,241 2,322 2,405 2,492 2,582 2,675 2,771 2,871 2,974 3,081 3,192 3,307 3,426
Decile 1st 11.57% 24 24 25 25 25 24 24 24 25 25 25 26 26
Decile
5th 9.74% 2,700 2,798 2,898 3,003 3,111 3,223 3,339 3,459 3,584 3,713 3,846 3,985 4,128
Decile 2nd 10.54% 22 22 22 23 23 22 22 22 23 23 23 23 23
Decile
6th 9.56% 3,214 3,330 3,450 3,574 3,703 3,836 3,974 4,117 4,265 4,419 4,578 4,743 4,914
Decile 3rd 9.48% 20 20 20 20 21 20 20 20 20 21 21 21 21
Decile
7th 9.81% 3,887 4,027 4,172 4,323 4,478 4,639 4,806 4,979 5,159 5,344 5,537 5,736 5,943
Decile 4th 9.60% 20 20 20 21 21 20 20 20 21 21 21 21 21
Decile
8th 9.58% 4,727 4,897 5,073 5,256 5,445 5,641 5,844 6,054 6,272 6,498 6,732 6,974 7,225
Decile 5th 9.74% 20 20 21 21 21 20 20 21 21 21 21 22 22
Decile
9th 9.78% 5,906 6,119 6,339 6,567 6,804 7,049 7,303 7,565 7,838 8,120 8,412 8,715 9,029
Decile
6th 9.56% 20 20 20 21 21 20 20 20 20 21 21 21 21
Decile
10th 10.34% 9,162 9,492 9,834 10,188 10,554 10,934 11,328 11,736 12,158 12,596 13,050 13,519 14,006
Decile
7th 9.81% 20 21 21 21 21 20 20 21 21 21 21 22 22
Decile
100%
8th 9.58% 20 20 20 21 21 20 20 20 20 21 21 21 21
Decile
9th 9.78% 20 20 21 21 21 20 20 21 21 21 21 22 22
Table 3.8: Decile
Approximate Affordable Housing Prices in County Longford, 2012-2024 10th 10.34% 21 22 22 22 23 21 22 22 22 22 22 23 23
Decile
100% 207 210 212 215 218 206 209 211 214 216 216 222 223
Range % of Approximate Affordable House Price - Longford County - 2012-2024 (€)
House-
holds
in Each
Category
(Longford)
2012 2013 2014 2015 2016 2017 2018 2019 2020 2021 2022 2023 2024
1st 11.57% 65,029 67,370 69,795 72,308 74,911 77,608 80,402 83,296 86,295 89,401 92,620 95,954 99,408
Decile 3.6 Taking 2015 as an illustrative year, there are 215 households
2nd 10.54% 104,447 108,207 112,102 116,138 120,319 124,651 129,138 133,787 138,603 143,593 148,762 154,118 159,666 Household Affordability required, 25 of which are required within the 1st Band that has
Decile
an upper price value of €86,705 and based on DoECLG House
An essential requirement of this Housing Strategy is to identify
3rd 9.48% 148,825 154,183 159,733 165,484 171,441 177,613 184,007 190,632 197,494 204,604 211,970 219,601 227,506 Price Statistics System, it is expected that only 5 housing units
Decile as accurately as possible the number of households who can
will be provided within this band. Therefore, there will be a
4th 9.60% 186,740 193,462 200,427 207,642 215,117 222,861 230,884 239,196 247,807 256,728 265,971 275,546 285,465 be classified as having an affordability problem over the period
Decile housing shortage in this band of 30 units and this equates to
2015-2021, so as to adequately inform the necessary provision of
14.01% of the overall total household requirement.
5th 9.74% 225,000 233,100 241,491 250,185 259,192 268,523 278,189 288,204 298,580 309,328 320,464 332,001 343,953
Decile
these units. Table 3.10 below sets out in detail the determination
of the anticipated social housing need and associated shortfall
6th 9.56% 267,819 277,461 287,449 297,797 308,518 319,625 331,131 343,052 355,402 368,196 381,451 395,184 409,410
Decile for Longford County Council. This determination is based on
7th 9.81% 323,904 335,565 347,645 360,160 373,126 386,559 400,475 414,892 429,828 445,302 461,333 477,941 495,147 the number of households required, housing affordability by
Decile
each decile, household band position, house prices bands
8th 9.58% 393,823 408,000 422,688 437,905 453,670 470,002 486,922 504,451 522,611 541,425 560,917 581,110 602,030 (upper value), number of houses required within each band, and
Decile
the percentage and number of housing units projected to be
9th 9.78% 492,118 509,835 528,189 547,203 566,903 587,311 608,455 630,359 653,052 676,562 700,918 726,151 752,292
Decile
provided within each band.
10th 10.34% 763,397 790,879 819,351 848,848 879,406 911,065 943,863 977,842 1,013,044 1,049,514 1,087,296 1,126,439 1,166,991
Decile
100%
22 Longford County Development Plan 2015 – 2021 23Table 3.10
ANNEX
Calcualtion of Anticipated Social & Affordable Housing Need,
County Longford 2012 – 2024
Year Range No. of Running Affordabil- Household House Prices No. of Hous- % of Hous- No. Housing Housing Housing
Households Total ity by each Band Bands - Up- es Required ing Units Units Shortfall - Shortfall as
Required Decile Position per Value within each Projected to Projected to i.e. No. of a % of Total
Year Range No. of Running Affordabil- Household House Prices No. of Hous- % of Hous- No. Housing Housing Housing
Band be Provided be Provided Households Households
Households Total ity by each Band Bands - Up- es Required ing Units Units Shortfall - Shortfall as
within each within each Meeting Required
Required Decile Position per Value within each Projected to Projected to i.e. No. of a % of Total
Band Band Affordability
Band be Provided be Provided Households Households
Criteria
within each within each Meeting Required
Band Band Affordability
Criteria 2015 1st Decile 25 25 72,308 1st Band 86,705 35 2.50% 5 30 14.01%
2012 1st Decile 24 24 65,029 1st Band 85,846 38 2.50% 5 32 15.67% 2nd Decile 23 48 116,138 2nd & 3rd 144,508 24 29.00% 62 -39 -
Bands
2nd Decile 22 46 104,447 2nd Band 114,462 13 13.50% 28 -15 -
3rd Decile 20 68 165,484 4th Band 173,410 15 17.50% 38 -23 -
3rd Decile 20 65 148,825 3rd & 4th 171,693 28 33.00% 68 -40 -
Bands 4th Decile 21 89 207,642 5th & 6th 231,213 27 25.00% 54 -27 -
Bands
4th Decile 20 85 186,740 5th Band 200,308 15 14.50% 30 -15 -
5th Decile 21 109 250,185 7th Band 289,016 25 11.50% 25 0 -
5th Decile 20 105 225,000 6th Band 228,924 13 10.50% 22 -9 -
6th Decile 21 130 297,797 8th Band None - 14.50% 31 - -
6th Decile 20 125 267,819 7th Band 286,155 22 11.50% 24 -2 -
7th Decile 21 151 360,160
7th Decile 20 145 323,904 8th Band None - 14.50% 30 - -
8th Decile 21 172 437,905
8th Decile 20 165 393,823
9th Decile 21 193 547,203
9th Decile 20 186 492,118
10th Decile 22 215 848,848
10th Decile 21 207 763,397
215 100.00% 215
207 100.00% 207
2016 1st Decile 25 25 74,911 1st Band 87,572 35 2.50% 5 30 13.59%
2013 1st Decile 24 24 67,370 1st Band 85,846 37 2.50% 5 32 15.04%
2nd Decile 23 48 120,319 2nd & 3rd 145,953 24 29.00% 63 -40 -
2nd Decile 22 46 108,207 2nd Band 114,462 12 13.50% 28 -16 - Bands
3rd Decile 21 69 171,441 4th Band 175,144 14 17.50% 38 -24 -
3rd Decile 20 66 154,183 3rd & 4th 171,693 27 33.00% 69 -42 -
Bands
4th Decile 21 90 215,117 5th & 6th 233,525 27 25.00% 54 -28 -
4th Decile 20 86 193,462 5th Band 200,308 15 14.50% 30 -15 - Bands
5th Decile 21 111 259,192 7th Band 291,906 25 11.50% 25 0 -
5th Decile 20 107 233,100 6th and 7th 286,155 34 22.00% 46 -12 -
Bands
6th Decile 21 132 308,518 8th Band None - 14.50% 32 - -
6th Decile 20 127 277,461
7th Decile 21 153 373,126
7th Decile 21 147 335,565 8th Band None - 14.50% 30 - -
8th Decile 21 174 453,670
8th Decile 20 167 408,000
9th Decile 21 195 566,903
9th Decile 20 188 509,835
10th Decile 23 218 879,406
10th Decile 22 210 790,879
218 100.00% 218
210 100.00% 210
2017 1st Decile 24 24 77,608 1st Band 89,323 33 2.50% 5 28 13.34%
2014 1st Decile 25 25 69,795 1st Band 85,846 36 2.50% 5 31 14.43%
2nd Decile 22 46 124,651 2nd & 3rd 148,872 22 29.00% 60 -38 -
2nd Decile 22 47 112,102 2nd Band 114,462 12 13.50% 29 -17 - Bands
3rd Decile 20 65 177,613 4th & 5th 208,421 25 32.00% 66 -41 -
3rd Decile 20 67 159,733 3rd & 4th 171,693 27 33.00% 70 -43 - Bands
Bands
4th Decile 20 85 222,861 6th Band 238,196 14 10.50% 22 -8 -
4th Decile 20 87 200,427 5th & 6th 228,924 28 25.00% 53 -25 -
Bands
5th Decile 20 105 268,523 7th Band 297,744 23 11.50% 24 -1 -
5th Decile 21 108 241,491 7th Band 286,155 25 11.50% 24 1 -
6th Decile 20 125 319,625 8th Band None - 14.50% 30 - -
6th Decile 20 128 287,449 8th Band None - 14.50% 31 - -
7th Decile 20 145 386,559
7th Decile 21 149 347,645
8th Decile 20 165 470,002
8th Decile 20 170 422,688
9th Decile 20 185 587,311
9th Decile 21 190 528,189
10th Decile 21 206 911,065
10th Decile 22 212 819,351
206 100.00% 206
212 100.00% 212
24 Longford County Development Plan 2015 – 2021 25ANNEX
Year Range No. of Running Affordabil- Household House Prices No. of Hous- % of Hous- No. Housing Housing Housing Year Range No. of Running Affordabil- Household House Prices No. of Hous- % of Hous- No. Housing Housing Housing
Households Total ity by each Band Bands - Up- es Required ing Units Units Shortfall - Shortfall as Households Total ity by each Band Bands - Up- es Required ing Units Units Shortfall - Shortfall as
Required Decile Position per Value within each Projected to Projected to i.e. No. of a % of Total Required Decile Position per Value within each Projected to Projected to i.e. No. of a % of Total
Band be Provided be Provided Households Households Band be Provided be Provided Households Households
within each within each Meeting Required within each within each Meeting Required
Band Band Affordability Band Band Affordability
Criteria Criteria
2018 1st Decile 24 24 80,402 1st Band 91,556 33 2.50% 5 28 13.18% 2021 1st Decile 25 25 89,401 1st Band 101,508 34 2.50% 5 28 13.13%
2nd Decile 22 46 129,138 2nd & 3rd 152,594 22 29.00% 61 -39 - 2nd Decile 23 48 143,593 2nd & 3rd 169,180 23 29.00% 63 -40 -
Bands Bands
3rd Decile 20 66 184,007 4th & 5th 213,632 25 32.00% 67 -42 - 3rd Decile 21 68 204,604 4th & 5th 236,852 26 32.00% 69 -44 -
Bands Bands
4th Decile 20 86 230,884 6th Band 244,150 14 10.50% 22 -8 - 4th Decile 21 89 256,728 6th Band 270,688 14 10.50% 23 -9 -
5th Decile 20 106 278,189 7th Band 305,188 23 11.50% 24 -1 - 5th Decile 21 110 309,328 7th Band 338,360 24 11.50% 25 -1 -
6th Decile 20 126 331,131 8th Band None - 14.50% 30 - - 6th Decile 21 131 368,196 8th Band None - 14.50% 31 - -
7th Decile 20 147 400,475 7th Decile 21 152 445,302
8th Decile 20 167 486,922 8th Decile 21 173 541,425
9th Decile 20 187 608,455 9th Decile 21 194 676,562
10th Decile 22 209 943,863 10th Decile 22 216 1,049,514
209 100.00% 209 216 100.00% 216
2019 1st Decile 24 24 83,296 1st Band 94,303 33 2.50% 5 28 13.08% 2022 1st Decile 25 25 92,620 1st Band 105,568 34 2.50% 5 29 13.19%
2nd Decile 22 47 133,787 2nd & 3rd 157,172 22 29.00% 61 -39 - 2nd Decile 23 48 148,762 2nd & 3rd 175,947 23 29.00% 63 -40 -
Bands Bands
3rd Decile 20 67 190,632 4th & 5th 220,041 25 32.00% 68 -43 - 3rd Decile 21 68 211,970 4th & 5th 246,326 26 32.00% 69 -43 -
Bands Bands
4th Decile 20 87 239,196 6th Band 251,475 14 10.50% 22 -8 - 4th Decile 21 89 265,971 6th Band 281,515 14 10.50% 23 -8 -
5th Decile 21 108 288,204 7th Band 314,344 23 11.50% 24 -1 - 5th Decile 21 110 320,464 7th Band 351,894 24 11.50% 25 -1 -
6th Decile 20 128 343,052 8th Band None - 14.50% 31 - - 6th Decile 21 131 381,451 8th Band None - 14.50% 31 - -
7th Decile 21 149 414,892 7th Decile 21 152 461,333
8th Decile 20 169 504,451 8th Decile 21 173 560,917
9th Decile 21 190 630,359 9th Decile 21 194 700,918
10th Decile 22 211 977,842 10th Decile 22 216 1,087,296
211 100.00% 211 216 100.00% 216
2020 1st Decile 25 25 86,295 1st Band 97,604 33 2.50% 5 28 13.07% 2023 1st Decile 26 26 95,954 1st Band 109,791 35 2.50% 6 29 13.25%
2nd Decile 23 47 138,603 2nd & 3rd 162,673 22 29.00% 62 -40 - 2nd Decile 23 49 154,118 2nd & 3rd 182,985 23 29.00% 64 -41 -
Bands Bands
3rd Decile 20 68 197,494 4th & 5th 227,742 25 32.00% 68 -43 - 3rd Decile 21 70 219,601 4th & 5th 256,179 27 32.00% 71 -44 -
Bands Bands
4th Decile 21 88 247,807 6th Band 260,277 14 10.50% 22 -8 - 4th Decile 21 91 275,546 6th Band 292,776 15 10.50% 23 -9 -
5th Decile 21 109 298,580 7th Band 325,346 23 11.50% 25 - - 5th Decile 22 113 332,001 7th Band 365,970 25 11.50% 25 -1 -
6th Decile 20 129 355,402 8th Band None - 14.50% 31 - - 6th Decile 21 134 395,184 8th Band None - 14.50% 32 - -
7th Decile 21 150 429,828 7th Decile 22 156 477,941
8th Decile 20 171 522,611 8th Decile 21 177 581,110
9th Decile 21 192 653,052 9th Decile 22 199 726,151
10th Decile 22 214 1,013,044 10th Decile 23 222 1,126,439
214 100.00% 214 222 100.00% 222
26 Longford County Development Plan 2015 – 2021 274.
ANNEX
Year Range No. of Running Affordabil- Household House Prices No. of Hous- % of Hous- No. Housing Housing Housing
Households Total ity by each Band Bands - Up- es Required ing Units Units Shortfall - Shortfall as
Table 4.1
Required Decile Position per Value within each
Band
Projected to
be Provided
Projected to
be Provided
i.e. No. of
Households
a % of Total
Households Housing Supply
within each within each Meeting Required Forecast Housing Demand and Actual Supply, 2002-2011
Band Band Affordability
Criteria
2024 1st Decile 26 26 99,408 1st Band 114,183 35 2.50% 6 30 13.31%
SUMMARY Year Predicted Actual Units % Over/
Housing Completed Under
2nd Decile 23 49 159,666 2nd & 3rd 190,304 24 29.00% 65 -41 -
Bands –– The calculated housing target for the Longford Demand 12 Delivery
3rd Decile 21 70 227,506 4th & 5th 266,426 27 32.00% 71 -45 - County up to 2021 is 2,120 units.
Bands
4th Decile 21 92 285,465 6th Band 304,487 15 10.50% 23 -9 - –– The total housing land requirement for this period is 2002 604 735 +122%
5th Decile 22 114 343,953 7th Band 380,608 25 11.50% 26 -1 -
84 hectares. 2003 604 659 +109%
6th Decile 21 135 409,410 8th Band None - 14.50% 32 - - –– The calculated requirement for Longford Town for this 2004 604 909 +150.5%
period is 61 hectares.
7th Decile 22 157 495,147 2005 604 973 +161%
–– Based on the revised RPG total housing target of
8th Decile 21 178 602,030 2006 604 1328 +220%
2,335 units by 2022 and a calculation of existing
9th Decile 22 200 752,292 supply relative to demand, there is sufficient zoned 2007 453 1579 +349%
land in the county to address identified future 2008 453 584 +129%
10th Decile 23 223 1,166,991
requirements.
223 100.00% 223 2009 453 445 -2%
–– It is anticipated that the Longford Local Authority will
2010 453 152 -66.5%
meet their identified social housing provision over
the Development Plan period, via a combination of 2011 453 89 -80.4%
options including the Rental Accommodation Scheme
A summary of total social need for County Longford is set (RAS) and by working in partnership with Voluntary
out in Table 3.11 below, which evidences that there is an Bodies and Housing Cooperatives.
Table 4.2 provides a breakdown of completed units by type over
anticipated per annum social housing shortfall, or requirement,
the period 2005-2011. 56.5% of total completions over the 7 year
of between 13.07% and 15.67% over the period to 2024. There
period were on planned larger schemes, 34% were individual
is a requirement to deliver 293 social housing units up and
houses, while approximately 9% were apartments. The table
including the end of the plan period in 2021, which equates
This section of the strategy examines past and projected future also highlights the drop-off in apartment development relative
to an anticipated average shortfall of 13.85% up to 2021.
housing supply, providing analysis on house completions, the to total completions in recent years.
types of units developed and the amount of zoned land available
for residential development.
Table 3.11
4.1
Summary of Anticipated Social and Affordable Housing
Housing Permitted and Completed
Need in County Longford, 2012-2024
Between 2007 and 2011 a total of 2,849 units were completed
Year 2012 2013 2014 2015 2016 2017 2018 2019 2020 2021 2022 2023 2024 in County Longford. Table 4.1 compares predicted demand
arising from the county’s previous Housing Strategy with actual
New Household 207 210 212 215 218 206 209 211 214 216 216 222 223 completion figures, obtained from the DoECLG. It illustrates
Formations
a significant fall in housing completion rates in recent years,
Social and 32 32 31 30 30 28 28 28 28 28 29 29 30 which fell from a peak of 1,579 units in 2007 to 89 units in 2011.
Affordable Housing
Requirement The outstripping of predicted demand by actual supply between
Housing Shortfall 15.67% 15.04% 14.43% 14.01% 13.59% 13.34% 13.18% 13.08% 13.07% 13.13% 13.19% 13.25% 13.31%
2002 and 2008 mirrors the nationwide trend of accelerated
as a % of Total housing output during this period.
Households
Required
12
Based on previous Housing Strategies: Longford County
Development Plan 2009-2015 and Longford County
Development Plan 2003-2009
28 Longford County Development Plan 2015 – 2021 29You can also read