Making the Case for Improved Bicycling Infrastructure
←
→
Page content transcription
If your browser does not render page correctly, please read the page content below
METROPOLITAN HOUSING AND COMMUNITIES POLICY CENTER

RES EARCH RE PORT

Making the Case for Improved
Bicycling Infrastructure
An Analysis of the Final Mile Bicycle Infrastructure Program

Yonah Freemark            Yipeng Su            Wilton Oliver           Olivia Fiol
URBAN INSTITUTE           URBAN INSTITUTE      URBAN INSTITUTE         URBAN INSTITUTE

January 2022
ABO UT THE U RB AN INS TI TU TE
The nonprofit Urban Institute is a leading research organization dedicated to developing evidence-based insights
that improve people’s lives and strengthen communities. For 50 years, Urban has been the trusted source for
rigorous analysis of complex social and economic issues; strategic advice to policymakers, philanthropists, and
practitioners; and new, promising ideas that expand opportunities for all. Our work inspires effective decisions
that advance fairness and enhance the well-being of people and places.

Copyright © January 2022. Urban Institute. Permission is granted for reproduction of this file, with attribution to
the Urban Institute. Cover image by Brad Aaron/Shutterstock.
Contents
Acknowledgments                                                                                    v

Executive Summary                                                                                 vi

Making the Case for Improved Bicycling Infrastructure                                              1
     Bike Infrastructure Can Play an Important Role in Encouraging Sustainable Transportation—but
             Only if It Is Designed Appropriately                                                  5
     Improving the Transportation System Requires Political Leadership and Effective Links with
             Community Members                                                                     8
  Our Research Approach                                                                           11
     Research Questions                                                                           11
     Final Mile Program Framework                                                                 12
     Case-Study and Comparison Cities                                                             13
     Data Collection                                                                              14
     Interviews with Stakeholders                                                                 15
     Geospatial Analysis                                                                          17
  Demographics and Final Mile Commitments of Five Case-Study Cities                               17
     Austin, Texas                                                                                19
     Denver, Colorado                                                                             20
     New Orleans, Louisiana                                                                       20
     Pittsburgh, Pennsylvania                                                                     21
     Providence, Rhode Island                                                                     22
  Impact of the COVID-19 Pandemic                                                                 22

Improving Cycling Begins with Municipal Support                                                   23
  Municipal Investment in Multimodal Infrastructure                                               23
  Public Interest in Multimodal Transportation Is Broad                                           25
  The Potential for Rapid Increases in Bicycle Use                                                27

A Multipronged Political Strategy Builds Support for Infrastructure                               29
  The Promise of Funds Attracts Initial Interest and Commitment from Local Political Leaders      30
  Regular Communication and Threats Keep Leadership in Line as an Accountability Mechanism        31
  Providing Engineering Support Fills a Big Gap                                                   33
  Assembling Long-Term Links between Advocates and City Staff Is a Challenge                      34
  Political Commitment May Not Span Multiple Leaders                                              36

Communications Strategies Have Had Mixed Effectiveness                                            38
  Mass-Media Campaigns Encourage Public Knowledge                                                 39
Targeting Campaigns around Construction Schedules Is Difficult                                45
  NIMBYism Remains a Challenge to Overcome                                                      45
  Advocacy Organizations Have an Incentive to Maintain Their Own Communications Approaches 47

Targeted Infrastructure Investments Have Expanded Access                                        49
  Short-Term Program Goals Were Met, but Work Remains to Build Out Cycling Networks             50
  Local Governments Prioritize Meeting Quantitative Goals, Not Necessarily Best Practices       60
  Cities Vary in Their Commitment to Building a Network of Dedicated Cycling Infrastructure     65
  Efforts to Expand Access to a Wide Spectrum of the Population Have Partly Been Achieved       66

Conclusions                                                                                     72
  Recommendations for Policymakers and Funders                                                  74

Appendix A. Semistructured Interview Protocol                                                   76

Notes                                                                                           80

References                                                                                      83

About the Authors                                                                               85

Statement of Independence                                                                       86

    iv                                                                               CONTENTS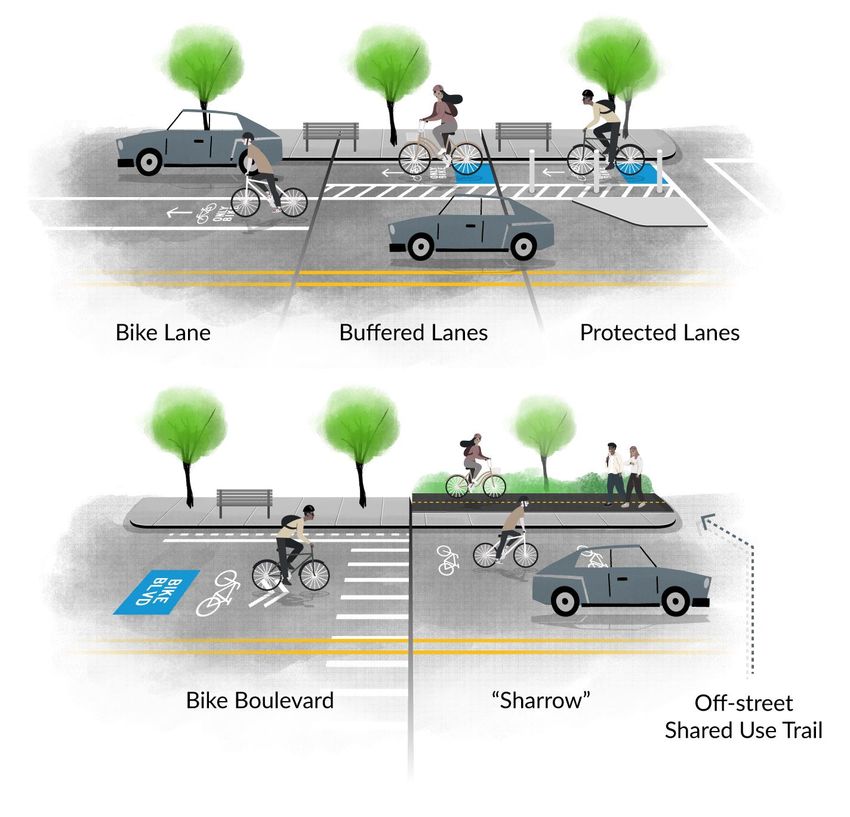
Acknowledgments
This report was funded by the Wend Collective. We are grateful to them and to all our funders, who
make it possible for Urban to advance its mission.

    The views expressed are those of the authors and should not be attributed to the Urban Institute,
its trustees, or its funders. Funders do not determine research findings or the insights and
recommendations of Urban experts. Further information on the Urban Institute’s funding principles is
available at urban.org/fundingprinciples.

    We thank Patrick Spauster for his initial assistance in the development of analytical approaches
for the report, stakeholders from each of the communities who agreed to speak with us and share
data about their investment programs, staff at PeopleForBikes for their assistance throughout the
research process, and Marcie Parkhurst and Mark Treskon for their detailed review of this report. We
thank James Fraleigh for his editing.

   ACKNOWLEDGMENTS                                                                              v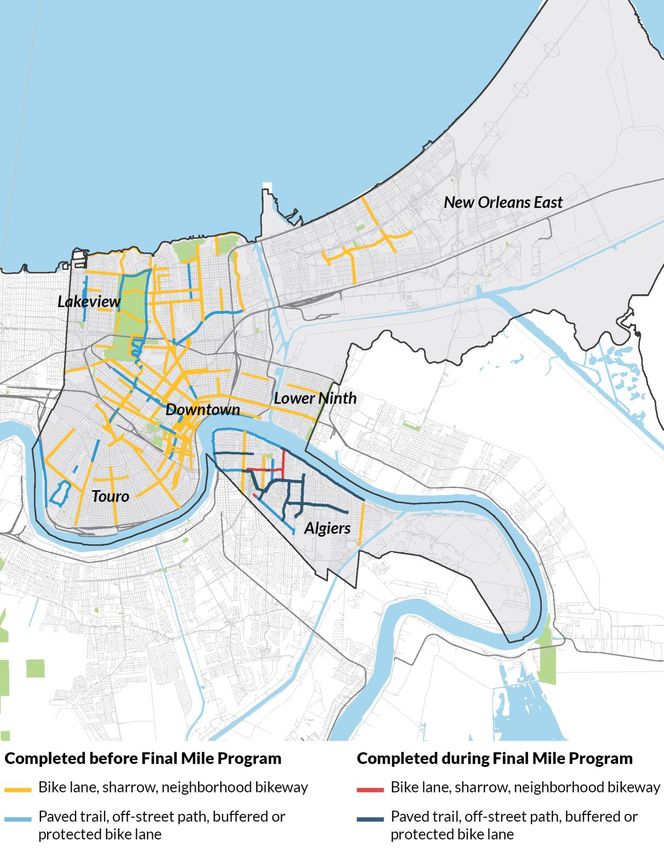
Executive Summary
Cycling infrastructure can help broaden access to mobility by offering residents a low-cost, reliable,
and sustainable means of transportation. Yet cities in the United States have thus far failed to
systematically expand their cycling networks in a fashion that is safe for users and encourages a mode
shift out of cars and into this more equitable and environmentally friendly transport mode. To help
stimulate further investment in cycling infrastructure, between 2018 and 2021 the Final Mile program
funded communications campaigns, advocacy efforts, and engineering consulting in five US cities. The
program set out to test whether philanthropic assistance for municipal biking projects could accelerate
city investments in communities where local leaders were already supportive of cycling infrastructure.

    To examine the effectiveness of the Final Mile program, we conducted interviews with community
stakeholders and collected data in each of the funded cities—Austin, Denver, New Orleans, Pittsburgh,
and Providence. We also assembled information about what similar cities elsewhere in the country
had done. We found that the program’s support for continuous pressure on local officials—including
by convening frequent meetings between city staff and cycling advocates, funding advertising, and
identifying quantified investment goals—helped encourage all the funded cities to significantly expand
their respective protected cycling infrastructure. They did so far more quickly than comparable cities
elsewhere in the United States. Though gaps remain in achieving the complete bike networks the
cities ultimately hope to build, the program could be a model for advocates looking to inspire local
governments to follow through with their policy goals. This report summarizes our conclusions,
identifying the successes and challenges faced by this program.

    The Final Mile program was premised on three assumptions necessary to support the rollout of
improved cycling infrastructure. These assumptions were reflected in program design and
implementation:

    ◼        Municipalities need to set ambitious goals for rapidly implementing improvements that
             prioritize equity. Final Mile worked to identify cities that were willing to set ambitious,
             quantified goals for cycling infrastructure rollout that would help ensure citywide access to
             safe, comfortable facilities for all.

    ◼        In the long term, those goals must be backed by continuous political commitment, supported
             by leaders in the public and nonprofit sectors. Final Mile funded a permanent setting for
             dialogue between public and nonprofit groups in each funded city, with the goals of reducing
             conflict, identifying the most equitable investments possible, and building momentum even in

        vi                                                                           EXECUTIVE SUMMARY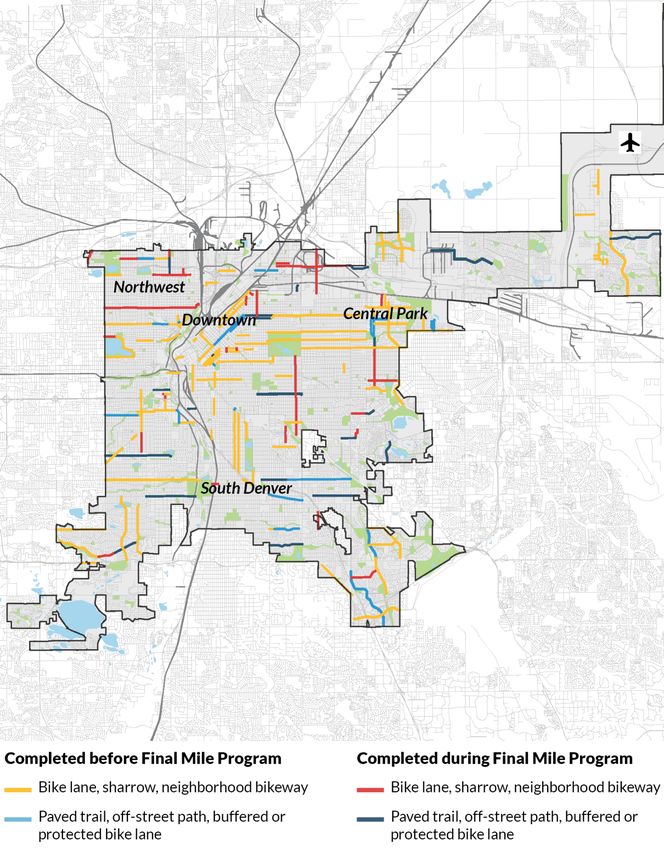
the face of project opposition. The program also supported a communications campaign
        intended to increase resident support for investment in cycling. In so doing, the program was
        designed to serve as a pressure mechanism that continuously reinforces programmatic goals.

    ◼   Municipalities must have the capacity to undertake programs. To this end, Final Mile
        provided funding for engineering technical assistance of new cycling infrastructure in several
        communities.

Our key findings are as follows:

    ◼   There is considerable interest in expanding cycling infrastructure, and municipalities are the
        right jurisdictions upon which to focus pressure for doing so. City governments control most
        streets and have the ability to reorient street space away from cars and toward bicyclists and
        pedestrians.

    ◼   Setting a long-term cycling infrastructure goal helped clarify what each city should
        accomplish. By committing to invest in a certain number of miles of cycling improvements,
        city staff felt they had a clear goal to follow. This informed how they prioritized their choices.

    ◼   Continuous pressure on city staff to accomplish goals was an effective way to encourage
        construction, but it also caused stress. The Final Mile program continuously emphasized to
        city staff the importance of achieving the agreed-upon mileage goal. This pressure helped
        move projects forward but also contributed to some cities’ staff feeling overwhelmed.

    ◼   Engineering support filled a key gap in local capacity. Cities that received technical assistance
        increased their planning, engineering, and construction work faster than would otherwise be
        possible. Many cities face chronic shortages in staffing, so this assistance was crucial.

    ◼   The effort to permanently link local nonprofits to the public sector had limitations. Final Mile
        project managers successfully organized frequent meetings between city and nonprofit staff,
        which increased information transfer between these groups. But nonprofits still often felt
        ignored in decisionmaking. In response, nonprofits conducted independent public campaigns
        in favor of cycling projects and played an “inside–outside” role, continuing to pressure city
        staff using tactics from outside the Final Mile program.

    ◼   Communications campaigns may have raised general public support for cycling investments,
        but in many cases failed to dilute neighborhood opposition to investments. Interviewees
        noted that public campaigns conducted by the Final Mile program were largely visible and
        noticed by residents and political officials. The program was not intentionally designed to

   EXECUTIVE SUMMARY                                                                                vii
reduce a “not in my backyard” (NIMBY) kind of opposition, but rather to support the creation
           of a larger group of supportive stakeholders. There is some evidence that these campaigns
           were associated with increasingly positive views about biking. But the larger group of pro-bike
           voices failed to reduce the localized neighborhood opposition to certain projects, which
           imperiled construction in places where city councilors agreed with opponents. Directly
           addressing NIMBY sentiment may remain a necessary element of such work.

    ◼      The funded cities significantly expanded cycling infrastructure, meeting their ambitious
           program goals, and did so at a significantly faster rate than comparison cities. The Final Mile
           cities considerably expanded the availability of improved cycling networks. Before the
           program, investment in secure cycling infrastructure in Final Mile cities was statistically
           indistinguishable from peer cities elsewhere. But after program commencement, the median
           Final Mile city added protected bike lanes at more than three times the per-capita rate as the
           average comparable city.

    ◼      Cities still need to complete their full investment plans—particularly in terms of meeting
           equity goals. Also, much of the new infrastructure was not built at the highest possible level
           of cycling safety. Improvements did not ultimately produce systems that ensured access to
           people of different racial and ethnic backgrounds more effectively than comparison cities.
           Considerable work also remains toward meeting their proposed citywide cycling-plan goals.

    The Final Mile program offers a unique model of philanthropic investment designed to shape
municipal policy. In the five funded cities, it helped inform growing interest and support for cycling
while aiding municipal leaders in shaping their goals. The program thus contributed to national
momentum in favor of improved cycling infrastructure.

    viii                                                                          EXECUTIVE SUMMARY
Making the Case for Improved
Bicycling Infrastructure
The transportation sector is now the single largest source of greenhouse gas emissions in the United
States. Its share is also rising, because of motor vehicle dependence and inadequate alternatives, even
as the energy sector makes more substantial progress toward lowering emissions.1 Across the United
States, the vast majority of people drive to work, usually alone in their cars or other vehicles. Few
people, even in the largest cities, use nonmotorized modes to get around.2 Overuse of cars as the
primary means of mobility also has contributed to the vast social and racial inequities at the core of
American society. These inequities in turn have deprived low-income families—particularly Black and
Hispanic families—the same opportunities afforded to households with higher incomes and that are
white (Sanchez, Stolz, and Ma 2003).

    Encouraging a transportation mode shift—getting people out of their cars and into alternatives like
biking and walking—is a key element of achieving a more sustainable and equitable society, especially
if mobilized in a way that prioritizes the needs of people of color with low household incomes (Creger,
Espino, and Sanchez 2018; Freemark and Tregoning 2022). This shift offers the potential to reduce car
use, improve air quality, increase public health, and promote a higher quality of life.3 Evidence from
cities worldwide shows that reallocating street space away from cars and toward safe, protected bike
infrastructure can encourage reduced car use. Yet such street allocations remain rare in the United
States, where cyclists in most cities are exposed to unsafe travel conditions. Advocates and
policymakers must ask themselves: How can we best encourage a shift in public investment?

    In answer, the Final Mile program, begun in 2018 and funded by the Wend Collective, offers a
promising framework for seeking out these results. The program supported PeopleForBikes (PfB), a
national organization that promotes expanded bicycling, to spur that mode shift through the
development of complete, safe bicycle networks in key cities across the United States.4 The Final Mile
program was premised on three interrelated assumptions that its creators believed core to achieving
change at the municipal level. These assumptions are relevant beyond just cycling infrastructure; they
could apply to a variety of potential actions.

    ◼   First, municipalities and their leaders need to set ambitious goals for rapid implementation of
        improvements that prioritize equity. Final Mile was intended to serve as an accelerant,
        pressuring local communities to commit to a goal and find the means to achieve it.
◼       Second, these goals must be backed by continuous political commitment, supported by
            leaders in the public and nonprofit sectors, even in the face of potentially obstinate
            opponents. Program designers believed that greater involvement by community members and
            the nonprofit sphere in planning and executing set goals would hold political leaders
            accountable to their equitable deployment. One major concern of bicycle advocates was
            that—though theoretical support for infrastructure existed—once projects hit the ground,
            residents would oppose greater investment, causing a “political valley” in support. As a result,
            PfB and Wend believed it necessary to use effective communications strategies to “weather”
            the decline in support. To do this, they worked to create a large group of residents in favor of
            investments, outnumbering the few individuals vocally opposed to these projects.

    ◼       Third, municipalities must have the capacity to execute projects. Dedicated funding and staff
            ensure not only the quality of the projects but also a robust community engaged in the
            planning process, which is often the first element of a project to be scaled down when
            resources are constrained.

    To test these assumptions, the Final Mile program funded campaigns in five communities: Austin,
Texas; Denver, Colorado; New Orleans, Louisiana; Pittsburgh, Pennsylvania; and Providence, Rhode
Island. These investments did not go directly to the municipal governments for the construction of
cycling lanes. Instead, Final Mile used philanthropic support as a mechanism to encourage local action.
Final Mile leveraged three general approaches in each municipality.

    ◼       To encourage municipal leadership, the program selected communities explicitly based on
            preexisting political entrepreneurship. PfB and Wend aided municipalities in identifying an
            actionable outcome related to bike programs. Each city set a goal for a minimum number of
            high-quality bike infrastructure miles it would build over two or three years. PfB staff working
            on the project emphasized that cities should invest in safe, secure infrastructure (meaning bike
            lanes physically separated in some way from car lanes) that formed a cohesive, citywide
            network.

    ◼       To build a long-term commitment to achieving a bike infrastructure goal, the program funded
            communications campaigns that promoted the importance of safe cycling infrastructure.
            These campaigns included both earned and paid media, such as online videos, zip code–
            targeted ads, billboards, and even branded pizza delivery boxes. PfB commissioned an
            advertising firm, GSD&M, to develop a unified branding campaign deployed in all five cities.
            The program encouraged local nonprofits to work directly with their city to build on-the-
            ground support for investments by funding a local program manager, organizing frequent

        2                                         MAKING THE CASE FOR BICYCLING INFRAS TRUCTURE
meetings, and engaging in study trips to Europe. By improving these connections, program
organizers hoped they could better dispel myths about cycling use and activate further
interest in funding bike facilities.
◼ To improve municipal capacity, the program funded technical assistance from an engineering
consultant to supplement work conducted in city halls. This engineering assistance, provided
by Toole Design Group, supported local planning and transportation departments that were
updating road designs to improve pedestrian and cycling facilities.
The Final Mile program was designed to alter the relationship between advocates and city staff.
Rather than a tense, confrontational battle between antagonists, program members intended to secure
a cooperative approach to transportation planning. They attempted to develop a more sympathetic
relationship between advocates and city staff to serve as a model for future partnerships between the
public sector and advocacy nonprofits. Figure 1 illustrates the components of the program.
Program organizers emphasized that the goal of the program was to build on preexisting local
plans by adding capacity. City staff led priority setting, not the philanthropic funders. Final Mile
funding neither directly supported infrastructure nor granted funding to cities themselves. Program
organizers intentionally designed this funding mechanism because they feared that delivering funding
directly to cities would decrease funders’ leverage to encourage better collaboration with nonprofits.
This program evaluation is intended to determine the ways—and the degree to which—the Final
Mile program encouraged the acceleration of municipal investments in local cycling infrastructure. Did
the combination of identifying a key goal, reinforcing a long-term commitment to achieving that goal,
and improving municipal capacity to accomplish that goal make better bike infrastructure possible? Did
an approach that prioritizes political action and better partnerships between public and nonprofit
sectors, backed by philanthropic support, increase equity of access to safe cycling? By studying which
elements of the program were successful, and which aspects were less viable, we highlight lessons
learned from the program that could be successfully transferred elsewhere to pave the path to more
sustainable mobility.
MAKING THE CASE FOR BICYCLING INFRASTRUCTURE 3FIGURE 1
Final Mile Program Organization Diagram
URBAN INSTITUTE
Source: Authors’ analysis of program.
4 MAKING THE CASE FOR BICYCLING INFRAS TRUCTUREBike Infrastructure Can Play an Important Role in Encouraging Sustainable
Transportation—but Only if It Is Designed Appropriately
The Final Mile program is premised on the idea that to promote a shift in transportation choices,
municipalities must invest strategically in effective, well-designed bicycle infrastructure. In this section,
we describe some of the research that supports this claim. Cities that fund effective bike lanes
historically have been able to prompt a mode shift away from car travel to sustainable modes. The
success of these lanes, however, depends on ensuring not only that the infrastructure is—and feels—
safe but also that it forms part of a network.
Cycling infrastructure can take several forms of varying quality (NACTO 2014), illustrated in figure
2. The differences between infrastructure types influence how effective an investment may be in
encouraging bicycle use. Sharrows5 are painted icons in a road lane shared with automobiles that
indicate bicycles are allowed or encouraged. Small-scale streets may be transformed into bicycle
boulevards that prioritize bicycle movement in shared lanes by minimizing car traffic and slowing
speeds. Bike lanes are painted areas on the street reserved for cyclists, typically on the right side of the
street but sometimes on the left, and occasionally operated in contraflow, meaning in the opposite
direction as car traffic. These lanes are sometimes painted entirely green or red, but more often than
not simply marked off with white borders. Buffered bike lanes include some physical separation
between bike lanes and car traffic beyond just paint. Cycle tracks and protected bike lanes are lanes
reserved for cyclists, often separated vertically from car traffic (meaning the lane is a foot or so higher
off the ground than car traffic). Last, shared-use off-street trails are lanes for cyclists and pedestrians
separated entirely from the street, and often located within green spaces. Collectively, these
investments can be combined with improvements in intersections, traffic signals, and signage to
maximize cycling access to the street. The cities we profile in this research leveraged a combination of
these infrastructure types as they rolled out their bicycle programs.
Many studies have demonstrated the effectiveness of bike infrastructure in encouraging cycling,
even as it typically has little negative impact on automobile traffic (e.g., Burbidge and Shea 2018).
Cross-sectional analyses comparing city bike infrastructure with the share of commuters commuting
by bike show that those cities in the United States with more lanes have a higher likelihood of more
riders (Dill and Carr 2003). Pucher, Dill, and Handy (2010) also show that cities worldwide that invest
in improved infrastructure are likely to benefit from more bike trips.
MAKING THE CASE FOR BICYCLING INFRASTRUCTURE 5FIGURE 2
Illustration of Various Cycling Infrastructure Types
URBAN INSTITUTE
Source: Urban Institute.
Researchers who have examined the impact of bike infrastructure show a direct relationship
between having cycling facilities on the ground and cycling. Parker et al. (2013) demonstrate that a
new bike lane in New Orleans dramatically increased biking not only on the streets impacted but also
overall in the surrounding neighborhoods, meaning that the bike lane focused cycling on the streets
where the improvements had been made and also encouraged more cycling. In this case, though men
were more likely to use lanes than women, cycling expanded among people of all genders, races, and
6 MAKING THE CASE FOR BICYCLING INFRAS TRUCTUREages. Similarly, an expanded cycling network in central Lisbon, Portugal, produced a 350 percent
increase in biking use (Rosa, Cambra, and Moura 2020). New cycling infrastructure is sometimes
popular in communities with lower incomes and a higher share of people who are ethnic minorities
(Wang and Lindsey 2019), though some residents fear that such improvements will spur gentrification
and displacement—an issue to which we return hereafter.
The attractiveness of biking infrastructure for cyclists depends on the quality of facilities. In a
comparison of the impact of investments in sharrows versus bike lanes, Ferenchak and Marshall (2016)
show that streets where bike lanes were installed had significantly larger increases in bike traffic than
those where only sharrows were implemented. Riders will respond to better infrastructure by
changing their travel patterns. Tilahun, Levinson, and Krizek (2007) show that people are willing to
travel up to 20 more minutes to switch from unmarked, on-road bike facilities to off-road bike trails
that are separated from car lanes. If cycling infrastructure is intended to promote increased levels of
physical activity—essential for public health and wellness—then design matters. Indeed, street
infrastructure improvements are likely to build bike use in all sorts of neighborhoods, regardless of
land-use characteristics or demographics (Cervero et al. 2009).
The degree to which people cycle is influenced by the quality of infrastructure in terms of how
safe people feel when they are biking (Akar and Clifton 2009). Sharrows are considerably less safe
than bike lanes, suggesting that sharrows alone may be inadequate to generate the sensation of safety
needed for people to trade cars for cycles (Ferenchak and Marshall 2016). Separated lanes are most
effective in building a sense of safety (Burbidge and Shea 2018; Habib et al. 2014).
A perception of cycling safety is also produced by the concept of safety in numbers (Osama and
Sayed 2016). People who see other cyclists around them are more likely to be willing to get on a bike,
especially in the context of streets dominated by car traffic. They are also more likely to travel by bike
if they gain access to a broader cycling-path network, ensuring their ability to travel not just between
two individual destinations but across an entire metropolitan area. Such a network strategy can be
especially effective in generating trips if cities deploy it quickly as a single investment (Xu and Chow
2020). The links between bike lanes and other amenities, like good bike parking or shower facilities,
can also influence the degree to which people choose to cycle (Cervero, Caldwell, and Cuellar 2013).
This research demonstrates that cycling infrastructure plays an essential role in encouraging
people to get out of automobiles and onto more sustainable transport modes. But the design of that
infrastructure matters: separated lanes arranged in a network are more likely to attract more riders,
largely because they give riders a greater sense of safety. This is the sort of network configuration that
MAKING THE CASE FOR BICYCLING INFRASTRUCTURE 7the Final Mile program has emphasized. But in order to build such infrastructure, political support is
needed at the municipal level. We now turn to the question of how to build such support.
Improving the Transportation System Requires Political Leadership and Effective
Links with Community Members
The Final Mile program was a political initiative largely intended to encourage local leaders to alter
their investment strategies to prioritize cyclists. This focus on political actors sets the program apart
from other initiatives, such as those promoted by professional organizations like the National
Association of City Transportation Officials and the American Planning Association, which develop
staff capacity and knowledge about best practices for bike infrastructure (though Final Mile provided
support in those realms as well). As we describe in this section, the program reflected that
transportation infrastructure is political in that it generates debate and disagreement. Final Mile’s
encouragement of productive exchanges between public sector and nonprofit groups also reflected
the fact that transportation projects need broad support from within and outside government to be
successful over the long term. This is particularly true because substantial increases in biking depend
not only on cycling infrastructure but also other local policies, such as complementary land uses that
minimize the need for car travel (Pucher, Dill, and Handy 2010).
Despite the undeniable benefits of improved cycling infrastructure from the perspective of
attracting new riders, actually investing in projects frequently solicits considerable controversy. This
conflict reflects disagreement on a number of fronts: whether responding to climate change by
altering transportation choices is an accepted strategy; whether cycling is an acceptable mode of
transportation compared to automobiles; where in a community new investments should be located;
and whether the goal of transportation should be to move people as quickly as possible, or rather to
connect people to destinations within their communities. As a result of these disagreements, political
actors, community groups, and residents interested in promoting cycling must identify mechanisms to
win support—including sometimes from one another.
Examining case studies from around the world, researchers cite several political factors key to
success in achieving increased investment in cycling infrastructure (Koglin 2015; Siemiatycki, Smith,
and Walks 2016; Wilson and Mitra 2020):
◼ identifying improvements that can “piggyback” on top of existing public works projects, to
prevent cycling projects from being perceived as separate or isolated
8 MAKING THE CASE FOR BICYCLING INFRAS TRUCTURE◼ leveraging external funding, not just public investment
◼ rerouting cycling projects preemptively to avoid public controversy
◼ building up public champions who stake their reputations on cycling projects, doing so by
seizing unique windows of opportunity
◼ supporting changing attitudes about cycling, including through an altered local planning and
engineering culture
◼ developing an aggressive public communications program
The Final Mile program focused on building several of these goals, such as adding new
philanthropic money to supplement public support, identifying political leaders willing to promote
cycling as a major goal, and supporting communications. But Final Mile was also premised on
improving links between government and nonprofit advocates. These groups are broadly perceived to
be at odds with one another in accomplishing the goal of adding cycling infrastructure.
One explanation for this perceived disagreement is the real experience of bike projects being
subject to tremendous controversy, often from residents along routes who protest the idea of allowing
street changes. There is also historical experience of public protests in favor of cycling infrastructure,
such as in the Netherlands, or at Critical Mass events in the United States (Koglin 2015; Stehlin 2014).
For or against, the ways contestation is experienced and reflected in choices on transportation
projects are not equally shared.
Black and Hispanic communities in the United States have made the compelling case that public
processes—particularly related to cycling—have been historically unjust in focusing on the desires and
needs of whiter and wealthier residents (Lubitow and Miller 2013; Stehlin 2015). Some scholars argue
that bike infrastructure is associated with gentrification, encouraging whiter and wealthier inhabitants
to move into communities that previously were largely inhabited by people of color with lower
incomes (Stein 2011). Recent research, however, indicates that bike lane projects do not appear to be
associated with significant changes in socioeconomic status or racial composition of impacted
neighborhoods (Ferenchak and Marshall 2021).
Even so, the sentiment that bike lanes are “white lanes” remains an obstacle to widespread
resident support for cycling projects (Lubitow 2016). Expanding partnerships between community
organizations and government entities undertaking infrastructure projects, which the Final Mile
program proposed, may resolve this issue somewhat. The examination of Lubitow, Zinschlag, and
Rochester (2016) of a bike program in Chicago, for example, shows how a community bike shop
MAKING THE CASE FOR BICYCLING INFRASTRUCTURE 9served an important role in expanding engagement around cycling in that city. In so doing, support for
investment expanded.
Such public–nonprofit partnerships have become more common across public service programs,
with the idea that they aid in identifying better policy options and bringing more people to the table in
the process (Hawkins and Wang 2012). Alexander and Nank (2009, 364) note such partnerships can
expand trust while “generat[ing] ideological consensus and domain consensus . . . through sharing
information, integrated responsibilities and authority, and collaborative decision making.” In a study of
municipal sustainability policies, Portney and Cuttler (2010) demonstrate that those cities with a more
vibrant nonprofit sector—especially one with which local officials engaged directly—were more likely
to achieve sustainability goals.
An important question to consider, though, is how partnerships between nonprofits and
governments are established and what roles each member of the partnership takes on, since each
member could assume a wide variety of responsibilities in cooperative work. The Final Mile program
focused on supporting nonprofit groups as what Feiock and Andrew (2006, 759) define as
“advocate/lobbyists.” This allows nonprofits to aggregate “diverse values and policy interests . . . and
represent [them] to the political system.” This moves beyond the government’s typical role, they
argue, of representing the majoritarian view.
If scholars have pointed to several examples of improved cycling infrastructure, and if it is clear
that such investments can produce the increases in biking that could benefit communities from the
perspective of increasing sustainability, most communities still provide inadequate resources for
cyclists. In most US cities, biking feels—and is—unsafe, and most people stick to driving whenever
possible. Unlocking the potential for more biking remains a crucial need.
We are thus left with several conclusions from existing research. Bike infrastructure, if well
designed in terms of safety and creating a network, can serve as an effective inducement for people to
begin cycling. Yet such infrastructure, like other forms of public services, is politically contested and
generates debate. Political officials have successfully implemented bike infrastructure improvements,
but to do so, they have had to seize unique windows of opportunity, and sometimes work with other
organizations to achieve their goals. There is no easy solution to generating better bike infrastructure
quickly. The Final Mile program was designed to test a new approach to doing just that.
10 MAKING THE CASE FOR BICYCLING INFRAS TRUCTUREOur Research Approach
To study the rollout of the Final Mile program, we conducted a mixed-methods research program. We
collected data and engaged a series of interviews with stakeholders in each case-study community.
We also used geospatial analysis to compare the rollout of improved bike infrastructure with what has
occurred in other, similar cities around the nation. Our findings should not be construed as fully causal
in nature: though we collected quantitative data, the individual nature of each community studied,
along with the short timeline elapsed since the Final Mile program began, made it possible that other
trends beyond those we describe here can explain at least some of our identified outcomes.
Research Questions
Our research examines several questions at the core of understanding Final Mile’s effectiveness in
generating local support for cycling infrastructure in cities across the United States:
1. Program mechanics. How did the Final Mile program operate in the five funded cities? Who
were the key players?
2. Infrastructure. What kinds of cycling infrastructure did the program produce, and how much
was built, compared to peer cities?
3. Communications. To what degree were the public-communications elements of the campaign
effective in building local support for infrastructure?
4. Leadership and partnerships. Did the program’s design successfully commit local leaders to
direct their cities to build more infrastructure than they would have otherwise? How did
relationships between the public sector and advocacy organizations change over time, and
how did these relationships influence outcomes?
We examine each of these research questions in this report. We hypothesize that Final Mile’s
unique combination of advertising, polling, and partnerships between government and nonprofits
successfully expanded access to cycling infrastructure in the funded cities beyond what occurred in
peer cities. Because our research evaluated program rollout in five separate cities, we were interested
in how the specific stakeholders and government policies in each location altered outcomes.
Comparisons can help elucidate what specific elements are most likely to set cities up for success.
MAKING THE CASE FOR BICYCLING INFRASTRUCTURE 11Final Mile Program Framework
The Final Mile program was designed to encourage partnerships among philanthropic, nonprofit, and
public sector groups working to improve bicycle infrastructure. In each funded city, the mayor agreed
to implement cycling improvements and set a mileage goal for the amount of new infrastructure to be
created. Though PfB and Wend encouraged cities to ensure that as much of the new cycle network
was separated and protected as possible, cities were allowed to count other types of infrastructure to
meet the program’s goals (such as bike lanes or bike boulevards). The program was funded by the
Wend Collective, a philanthropic organization (though the cycling infrastructure itself was funded by
the cities). Throughout the program’s rollout, Wend served as a major stakeholder in discussions with
staff and other interested individuals in funded communities, with Wend’s director of campaigns and
sustainability coordinating much of the organization’s work.
Wend’s funding, which was budgeted at roughly $11.3 million for the first three years of the
program, was mostly directed to PfB, a nonprofit organization that has been supporting local bike
improvement programs throughout the United States for two decades. PfB’s vice president of local
innovation and director of local innovation were the program’s primary team leaders. They worked
directly with city staff and other involved stakeholders as the program rolled out.
PfB’s approach varied depending on the city funded, but in each selected community, the
organization identified a program manager, who was funded to lead program activities, organize
frequent meetings between city staff and nonprofit groups designed to coordinate among
stakeholders, and interact with city government staff and nonprofit organizations on the ground. This
manager was either a member of a nonprofit organization (in New Orleans, Pittsburgh, and
Providence) or an independent consultant (in Austin and Denver). The manager was tasked with
holding frequent meetings and targeting local expenditures, such as on advertising campaigns. In each
city, PfB helped organize and maintain a local steering committee comprising public and nonprofit
actors.
PfB did not fund any physical infrastructure as part of the program. Final Mile, however, did
support several other major areas of activity. First, PfB funded GSD&M, a national advertising firm, to
develop communications campaigns for each of the cities to support the effort. The goal was to
develop social media distribution and print, billboard, and other messaging that would reinforce the
program and encourage local efforts. Second, PfB provided funds to Toole Design, a street design and
engineering firm, to augment city staff capacity to develop plans for bike improvements; this
assistance was particularly deep in New Orleans, Pittsburgh, and Providence. Last, PfB led several
12 MAKING THE CASE FOR BICYCLING INFRAS TRUCTUREforeign trips to cities such as Seville, Spain, to demonstrate best practices for investment in improved
cycling infrastructure.
Case-Study and Comparison Cities
The Final Mile program built off a similar but less comprehensive program called the Big Jump, also
organized by PfB. That three-year program began in 2014 and supported improved cycling in 10 cities
nationwide (Austin; Baltimore; Fort Collins, Colorado; Los Angeles; Memphis; New Orleans; New York;
Portland, Oregon; Providence; and Tucson). Wend tasked PfB in fall 2017 to identify five or six cities
that could benefit from an expanded program. As part of this work, Wend conducted an extensive
scoping program for cities across the country to identify which could be most effectively funded by
Final Mile to produce major improvements to cycling infrastructure.
At the core of this scoping work was a preliminary application sent out to US cities, counties, and
metropolitan areas. Eighty-one jurisdictions, mostly cities, responded, providing information about
current status of cycling infrastructure and staff assessments of present public support for biking.6
From these jurisdictions, PfB conducted more in-depth analyses of 22 of them: Atlanta; Austin;
Bellevue, Washington; Denver; Detroit; Fort Collins, Colorado; Fort Lauderdale; Indianapolis; Kansas
City, Missouri; Los Angeles; Louisville; Memphis; Miami; Nashville; New Orleans; Pittsburgh; Portland,
Oregon; Providence; Queens County, New York; Salt Lake City; Seattle; and Tucson. The organization
analyzed each according to an assessment of local urban mobility challenges, demonstrated political
will, political readiness, established partnerships, and potential to serve as a national model. Wend and
PfB staff met with officials in the mayor’s offices of many of these communities to gauge their interest
in the Final Mile program, with the goal of identifying those cities that were most focused on finding
the means to actually achieve beneficial infrastructure improvements.
Ultimately, PfB and Wend selected Austin, Denver, New Orleans, Pittsburgh, and Providence as
Final Mile cities (though not at the same time; Pittsburgh and Providence were selected later). These
five cities thus serve as our primary case studies in this work. The other 17 cities considered but
ultimately rejected serve as comparative studies. Note that this comparison is not entirely even. The
five Final Mile cities were specifically selected because they met certain criteria—notably, having
preexisting political leadership in favor of bike lanes and established partnerships. This may have been
less the case for the other cities. That said, staff in all cities expressed interest in joining the program,
indicating preprogram momentum for cycling in each. This comparison is therefore useful in providing
MAKING THE CASE FOR BICYCLING INFRASTRUCTURE 13a national scope for how bicycle infrastructure was undertaken in US cities during this period, and in
identifying the specific contributions of the Final Mile program.
Data Collection
We worked with PfB to assemble data relevant to the rollout of the Final Mile program. These data
included
◼ results from polls funded by Wend in each of the case-study cities over the analysis period,
focused on issues such as interest in cycling;
◼ documentation of program expenditures;
◼ documentation of communications programs, such as advertising efforts;
◼ PfB-developed information related to the investigation of potential cities for investment as
well as progress in program investments over the Final Mile completion period; and
◼ a list of people involved with the program in each of the cities where funding was allocated.
We also worked with PfB to collect a preliminary dataset on cycling infrastructure in each case-
study and comparison city. These data were derived from OpenStreetMap but assembled by PfB as
part of its Bicycle Network Analysis program. We collected information on cycling network data
annually from 2017 to 2021. To conduct our geospatial analysis (described hereafter), we also
compiled data at the block group level from the 2015–2019 American Community Survey. To
augment this analysis and fully develop the dataset, we gathered as much annual cycling investment
data from the Final Mile and comparison cities as possible, bringing together this information from
web sources and emails to city officials.
One concern about using OpenStreetMap data is that they are assembled voluntarily by
individuals working around the world. As a result, they may not accurately represent actual cycling
networks at any specific point in time, and they may be more reliable in some cities than others. It is
therefore possible that network-related information in some cities is over- or underestimating cycling
infrastructure. Even so, there is no better national source of data on cycling networks, so we chose to
rely on this dataset for parts of our analysis.
We do not analyze changes in bike use in the Final Mile cities over the study period, for two
reasons. First, because the program only began a few years ago, it may be inappropriate to expect
significant, measurable impacts on biking use over the study period. Second, as of this report’s writing,
14 MAKING THE CASE FOR BICYCLING INFRAS TRUCTUREthe best available national-level data on cycling—Census Bureau–produced information about
transportation mode share to work—were last available at the municipal level in 2019, and data for
2020 and 2021 are likely to have been significantly impacted by the COVID-19 pandemic, which may
or may not have long-term implications.
Interviews with Stakeholders
From April through September 2021, we conducted 34 interviews using teleconferencing technology.
Each interview lasted up to one hour. The semistructured interviews focused on understanding the
interviewees’ roles in Final Mile processes, specific leadership profiles of those involved, and what
made them particularly engaged in undertaking this effort. Outreach was done via an email letter
asking recipients about their interest in being interviewed and encouraging them to reach out with
questions about the interview process and research project.
To get a full scope of biking and biking infrastructure in each of the funded communities, our team
aimed to interview a diverse array of stakeholders across different sectors. Several of the interviewees
served as project managers of Final Mile program activities and had a detailed understanding of
program operations. Others had been involved in biking and bike infrastructure separate from the
program. Table 1 shows the breakdown of our interviewees by sector. Note that Austin, New Orleans,
and Providence had a relatively small number of direct interviewees. To better understand what
happened in these cities, we relied on national experts (consultants from Toole and GSD&M) and
conversations with PfB and Wend staff.
MAKING THE CASE FOR BICYCLING INFRASTRUCTURE 15TABLE 1
Overview of People Interviewed to Understand Final Mile Program Rollout
Public sector Nonprofit sector Consultants Overall
Austin 1 2 1 4
Denver 4 4 1 9
New Orleans 2 2 NA 4
Pittsburgh 3 3 1 7
Providence 1 1 1 3
Nationwide NA 2 5 7
Total 11 14 9 34
Source: Authors.
Note: NA = not applicable.
We identified interviewees through a field scan and by reviewing the list of city contacts provided
by PfB. We then used snowball sampling to identify additional interviewees who might provide
relevant details about the project. The interview protocol (appendix A) covered the following topics:
◼ Descriptively, how did the Final Mile program operate?
◼ How did the program’s elements vary?
◼ What were the key mechanisms by which Final Mile strategies were linked to specific
outcomes?
◼ Who were the key players in each of the impacted communities?
◼ How did the relationships between the public sector and advocacy organizations change over
program duration?
◼ What elements of the program did local stakeholders believe were more or less effective?
◼ To what degree did communities impacted by the Final Mile program produce results in terms
of transportation infrastructure that were different from those of other, similar communities
throughout the country?
After receiving verbal consent, our team conducted interviews while taking written notes and
recording audio to accurately capture feedback. When mentioned in the report, interviewees have
been anonymized to ensure confidentiality. Once interviews were completed, we recorded key themes
from each interview in a long-form document, which we used to code for major themes to understand
the impact of the Final Mile program on the rollout of improved cycling infrastructure.
Though interviews provide useful insight into how local stakeholders are challenging themselves
to invest in expanded cycling infrastructure, we acknowledge that we are representing the program at
16 MAKING THE CASE FOR BICYCLING INFRAS TRUCTUREa single point in time. It is possible that, had our interviews occurred at another point in the program
rollout, they would have reflected different views from affected individuals.
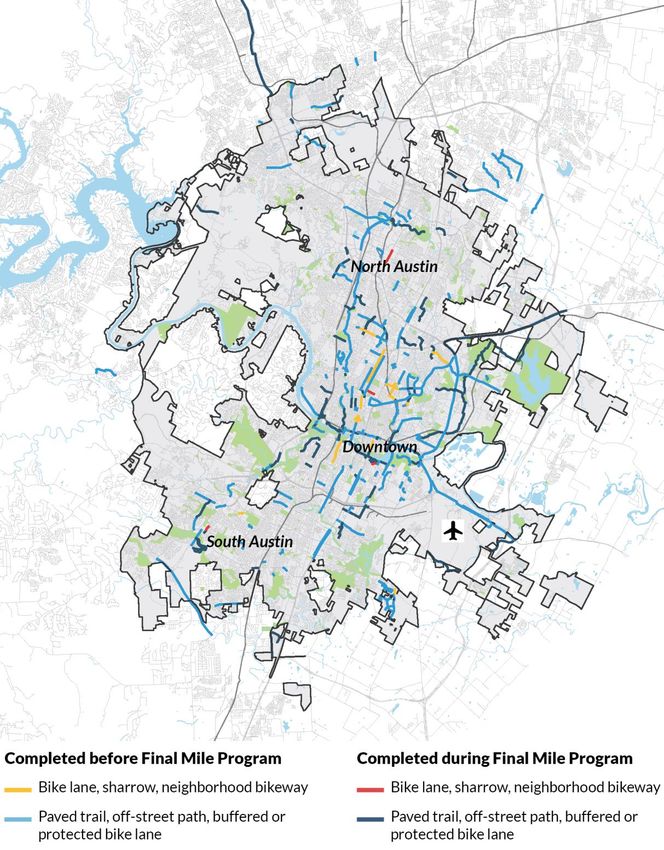
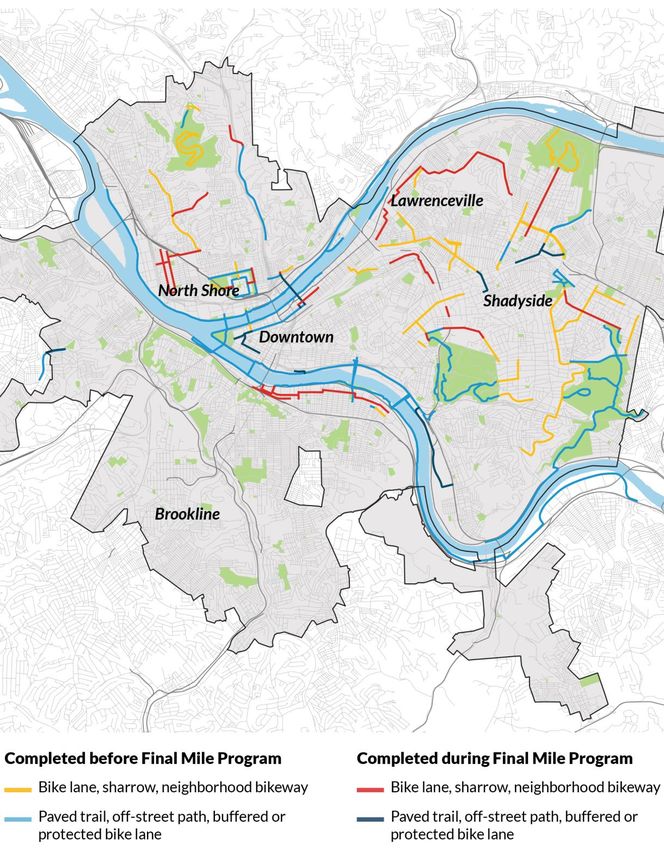
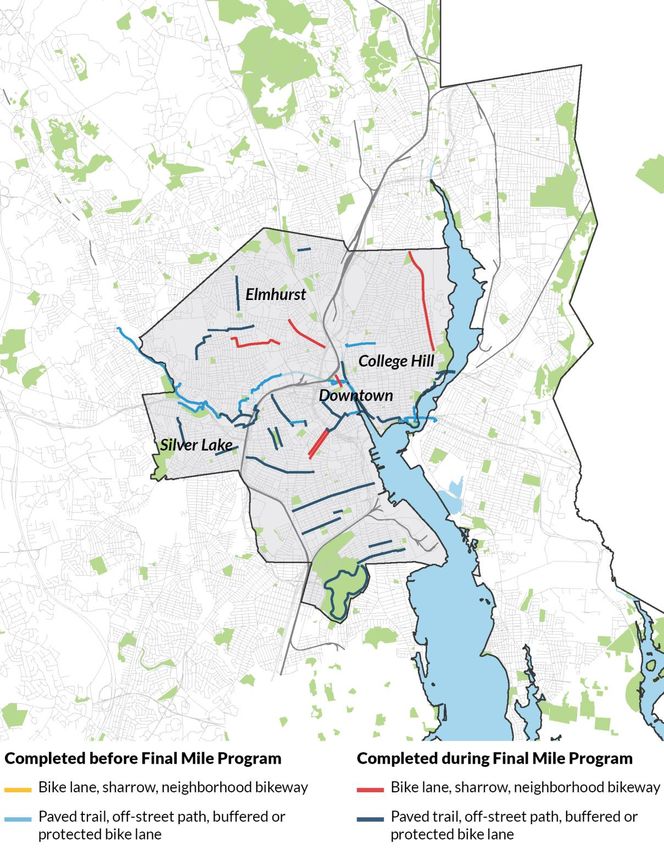
Geospatial Analysis
To understand the geographic distribution of cycling facilities throughout each of the case-study
communities, as well as the comparison cities, we conducted a series of analyses leveraging data from
OpenStreetMap, as described earlier. These analyses allowed us to compare investments in different
communities, identify changes over time, and contrast outcomes across demographic classifications.
We began by identifying cycling infrastructure. Using OpenStreetMap data, we identified streets
with bike lanes and those with more protected bike infrastructure (including buffered lanes and cycle
tracks). We did not define streets with sharrows as having cycling infrastructure, as these streets have
no space uniquely designated on them for cyclists. We also identified bike paths defined as shared-use
off-street trails. Because many of these trails do not serve as part of the citywide bike network (e.g.,
some are dead-end paths through parks), we manually reduced the qualifying off-street network just
to those paths that link between streets at both ends or line the edge of parks. For each city, we
tracked changes in the length of the available infrastructure over time.
Then, using this refined dataset, we conducted a series of geospatial analyses on all Final Mile and
comparison cities. We compared the location of the cycling infrastructure network with Census block
group data related to local racial and ethnic demographics, income, and overall population. We also
pursued a network analysis approach to understand access to key sites in each community (e.g.,
libraries). Our goal in each case was to determine whether cycling infrastructure that has been
completed has achieved the goal of creating more equitable access based on a complete network.
Each of these analysis approaches is detailed in the following sections.
Demographics and Final Mile Commitments of Five
Case-Study Cities
The five case-study cities—Austin, Denver, New Orleans, Pittsburgh, and Providence—vary across
numerous demographic measures and local characteristics (table 2). By population size and land area,
Austin ranks largest; it has more than 5 times the population of Providence and nearly 18 times the
area. Providence is the most densely populated, followed by Pittsburgh. Households in Austin and
Denver have the highest median incomes of the five cities; households in the other cities make
MAKING THE CASE FOR BICYCLING INFRASTRUCTURE 17considerably less. Walking and cycling to work are most common in Pittsburgh, where 13 percent of
commuters did so in 2019, and much less common in Austin, where only 3 percent of workers walked
or biked to work that year.
In all five cities, at least one-third of residents are Black, Hispanic, or Asian. New Orleans is home
to the largest share of Black residents (58 percent of the population). The largest share of Hispanic
residents (44 percent) lives in Providence, and the share of Asian residents is largest in Austin (8
percent). In New Orleans, people of color comprise 69 percent of the population, the highest share of
the Final Mile cities. Residents of all of the cities are liberal on the political spectrum, but Providence’s
are the most liberal of this group.
TABLE 2
Characteristics of Final Mile Cities
Austin Denver New Orleans Pittsburgh Providence
Total population 979,263 727,211 390,144 300,281 179,875
Land area (sq. mi.) 320 153 169 55 18
Final Mile mileage goal 100 mi 100 mi 75 mi 50 mi 43 mi
Bike infrastructure funding
$23 m $23 m $40 m $22 m $15 m
commitment
Total municipal expenditures
$3.85 b $3.57 b $1.56 b $850 m $990 m
(2017)
Density (people/sq. mi.) 3,061 4,744 2,303 5,423 9,773
Median household income $75,413 $75,646 $45,615 $53,799 $50,097
Resident ideology (on a –1
to +1 liberal-to-conservative –0.53 –0.48 –0.51 –0.49 –0.79
scale)
Racial/ethnic demographics
White (non-Hispanic) 48% 55% 31% 64% 32%
Black (non-Hispanic) 7% 8% 58% 23% 15%
Hispanic/Latino 34% 29% 6% 4% 44%
Asian 8% 4% 3% 6% 5%
Commuters traveling to
3% 8% 9% 13% 10%
work by walking or biking
Source: 2019 American Community Survey 1-year estimates; PeopleForBikes 2021 Quarter 3 Update; Chris Tausanovitch and
Christopher Warshaw (2014), City-Level Public Preference Estimates, https://americanideologyproject.com/; Lincoln Institute of
Land Policy, “Fiscally Standardized Cities,” 2017, https://lincolninst.edu/research-data/data-toolkits/fiscally-standardized-
cities/search-database.
In table 2, we also document the Final Mile mileage goal and funding commitment for each of the
program communities. The population of each city is roughly associated with its municipal spending,
its Final Mile mileage goal, and its Final Mile funding commitment. That said, Providence’s mileage goal
was the highest per capita (24 miles per 100,000 residents), versus 19 for New Orleans, 16 for
Pittsburgh, 14 for Denver, and 10 for Austin. Compared to total municipal expenditures, New Orleans
and Pittsburgh devoted greater resources to completing the program (equivalent to about 2.5% of the
18 MAKING THE CASE FOR BICYCLING INFRAS TRUCTUREannual city budget) versus the other cities (1.5% and below). Still, Austin and Denver had much larger
sources of funding for cycling on hand, outside of that specifically dedicated to Final Mile.
Next, we provide brief overviews of each Final Mile city, along with their history as part of the
program. All cities that joined the Final Mile program agreed in advance to direct funds to
implementing dedicated, safe cycling infrastructure. Before announcing their proposed goal for
improved cycling infrastructure, they held conversations with Wend and PfB staff to encourage an
increase in the goal, to which all ultimately agreed. All also agreed that their priority was to at least
double cycling trips taken in the city over the long term, specifically with the goal of encouraging
equitable outcomes, and to do so in a way that committed to the goal of a cycling network (rather than
a series of disconnected lanes) with as much protected infrastructure as possible. PfB and Wend
operated on the general concept that “for just a little piece of the road, we can all have peace on the
road,” the idea being that protected bike lanes would appeal to both cyclists and drivers. The history
we document here is based on interviews conducted with stakeholders as part of this project and data
compiled from PfB.
Austin, Texas
Austin finalized its biking master plan in 2014, with the goal of developing an “All Ages and Abilities”
bicycle network.7 The city further supported this plan in 2019 with the Austin Strategic Mobility Plan,
which identified a Bicycle Priority Network for near-term improvements.8 The city’s goal is to increase
the share of people walking, biking, or taking transit to work to 50 percent in 2039, up from 6 percent
today. Austin, previously a member of the Big Jump cycling advancement program developed by PfB,
became a member of the Final Mile program in early 2019. Austin’s proposal was to partner with PfB
to increase network buildout from 50 to 100 miles by the end of 2020 (later extended to 2021), under
the local name MoveATX. PfB contracted to a local political consultant to serve as project manager.
Political leaders began working to develop public support for implementing the plan. In 2016, the
city council put Proposition 1 on the ballot. This $720 million bond, supported by 60 percent of voters
that November, included funds for corridors throughout the city, much of it improved pedestrian and
cyclist infrastructure.9 In 2020, the city council, seeking to build on this investment, placed the $460
million Proposition B on the ballot. Supported by two-thirds of the city’s voters, Proposition B
provided $80 million for sidewalks and $120 million for bikeways and urban trails, plus more for other
pedestrian and cycling improvements.10 This effort was largely spearheaded by the Final Mile project
manager. On the same day, Austin voters also approved Proposition A, which funded the creation of a
MAKING THE CASE FOR BICYCLING INFRASTRUCTURE 19You can also read