Manage System Health - Cisco
←
→
Page content transcription
If your browser does not render page correctly, please read the page content below
Manage System Health
             This section contains the following topics:
                • Monitor System and Application Health, on page 1
                • Configure a Syslog Server, on page 17
                • Collect Audit Information, on page 18

Monitor System and Application Health
             The Crosswork Platform is built on an architecture consisting of microservices. Due to the nature of these
             microservices, there are dependencies across various services within the Crosswork system. The system and
             applications are considered Healthy if all services are up and running. If one or more services are down, then
             the health is considered Degraded. If all services are down, then the health status is Down.
             From the main menu, choose Crosswork Manager to access the Crosswork Summary and Crosswork
             Health windows. Each window provides various views to monitor system and application health. It also
             supplies tools and information that, with support and guidance from your Cisco Customer Experience account
             team, you can use to identify, diagnose, and fix issues with the Cisco Crosswork cluster, Platform Infrastructure,
             and installed applications.
             While both windows can give you access to the same type of information, the purpose of each summary and
             view is different.

Monitor Cluster Health
             At a glance, the Crosswork Summary window (Crosswork Manager > Crosswork Summary) shows a
             summary of the overall system health. The main purpose of the Crosswork Summary window is to view
             Crosswork Cluster health in terms of hardware resources and VMs. For example, prior to installing or upgrading
             applications, you may want to check if the hardware resources are healthy and the VMs are running well.
             After clicking the Crosswork Cluster tile, you can visually see resource utilization and drill down on VMs
             to perform some VM or cluster-related activities. In another case, you may see degrading services or over
             utilization of hardware resources. At this point, from a hardware point of view, you might find that the number
             of VMs in the system is insufficient prompting you to add more VMs to scale the system further out. For more
             information, see Check Cluster Health.
             In addition to accessing Crosswork Cluster health, you can click on the Cisco Crosswork Platform
             Infrastructure and application tiles to view more details such as microservices and alarms.

                                                                                         Manage System Health
                                                                                                                        1
Manage System Health
  Monitor Platform Infrastructure and Application Health

Monitor Platform Infrastructure and Application Health
                        The Crosswork Health window (Crosswork Manager > Crosswork Health tab) provides health summaries
                        for the Cisco Crosswork Platform Infrastructure and installed applications with the addition of microservice
                        status details.

                        Within this window, expand an application row to view Microservice and Alarm information.

                        From the Microservices tab:
                             • View the list of microservices and, if applicable, associated microservices by clicking on the microservice
                               name.

                             • Click      to restart or obtain Showtech data and logs per microservice.

                        From the Alarms tab:

                    Manage System Health
       2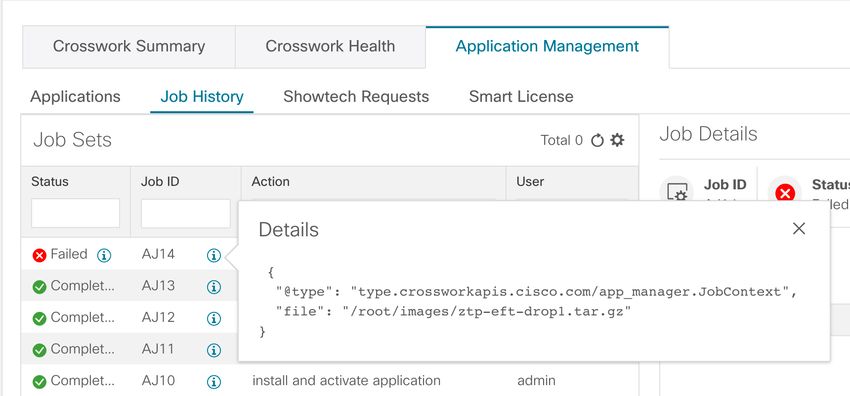
Manage System Health
                                                                                               Visually Monitor System Functions in Real Time

                           • Click the alarm description to drill down on alarm details.
                           • Acknowledge, change status, and add notes to alarms.

                        You can also download all of a Cisco Crosswork application or Cisco Crosswork Platform Showtech service
                        logs and perform installation-related operations from the Application Details window. Click                  to open the
                        Application Details window.

Visually Monitor System Functions in Real Time
                        You can monitor the health of Cisco Crosswork and any of its functions in real time, using a set of monitoring
                        dashboards you can access from the Crosswork Manager window.
                        Cisco Crosswork uses Grafana to create these dashboards. They give you a graphical view of the product's
                        infrastructure, using metrics collected in its database. You can use these dashboards to diagnose problems
                        you may encounter with individual Cisco Crosswork applications or their underlying services.
                        There are multiple monitor dashboards, categorized by the type of functionality they monitor and the metrics
                        they provide. The following table lists some categories that may be available depending on whichCisco
                        Crosswork applications are installed.

                        Table 1: Monitoring Dashboard Categories

                        This dashboard category...                 Monitors...

                        Change Automation                          Playbook functions. Metrics include the number of MOP jobs executed,
                                                                   response latency, API calls, database activity, and so on.

                        Optima                                     Feature pack, traffic, and SR-PCE dispatcher functions.

                        Collection - Manager                       Device-data collection functions. Metrics include telemetry collection
                                                                   latencies, total collection operations, memory and database activity
                                                                   related to telemetry, delayed collections, and so on.

                        Health Insights                            Key Performance Indicator functions. Metrics include the number of
                                                                   KPI alerts, API calls, and so on.

                        Infra                                      System infrastructure messaging and database activity.

                        Inventory                                  Inventory manager functions. These metrics include total numbers of
                                                                   inventory change activities.

                        Platform                                   System hardware and communications usage and performance. Metrics
                                                                   include disk and CPU usage, database size, network and disk operations,
                                                                   and client/server communications.

                        ZTP                                        Zero Touch Provisioning functions.

                        To conserve disk space, Cisco Crosswork maintains a maximum of 24 hours of collected metric data.
                        Grafana is an open-source visualization tool. The following provides general information about how to use
                        the Cisco Crosswork implementation of Grafana. For more information about Grafana itself, see
                        https://grafana.com and http://docs.grafana.org

                                                                                                        Manage System Health
                                                                                                                                          3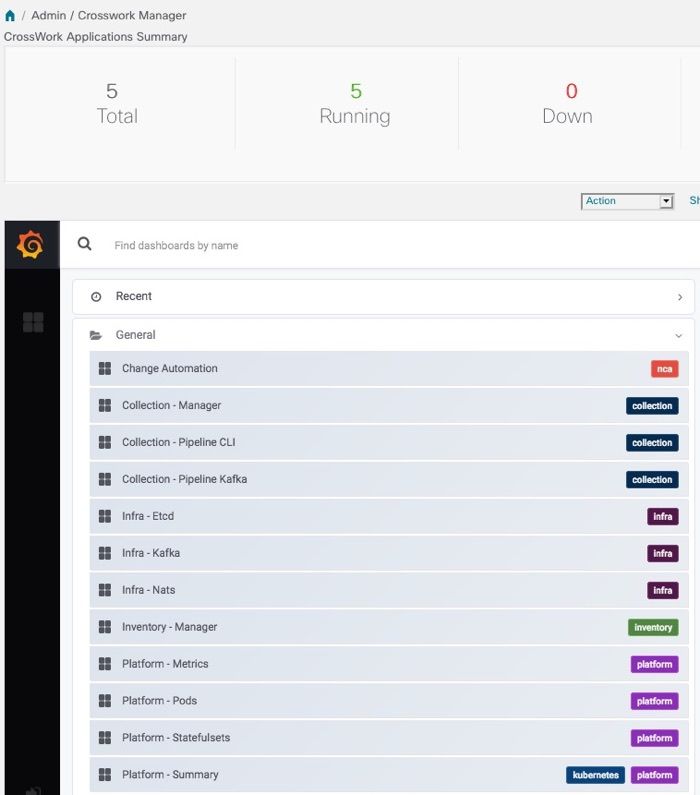
Manage System Health
    Visually Monitor System Functions in Real Time

Step 1       From the main menu, choose Administration > Crosswork Manager > Crosswork Cluster.
Step 2       At the top right, click View more visualizations.
             The Grafana user interface appears.

Step 3       In the Grafana user interface, click Home. Grafana displays the list of monitoring dashboards and their categories, as
             shown in the following example.

Step 4       Click the the dashboard you want to view. For example: Clicking on Platform - Summary dashboard displays a view
             like the one shown in the following figure.

                      Manage System Health
         4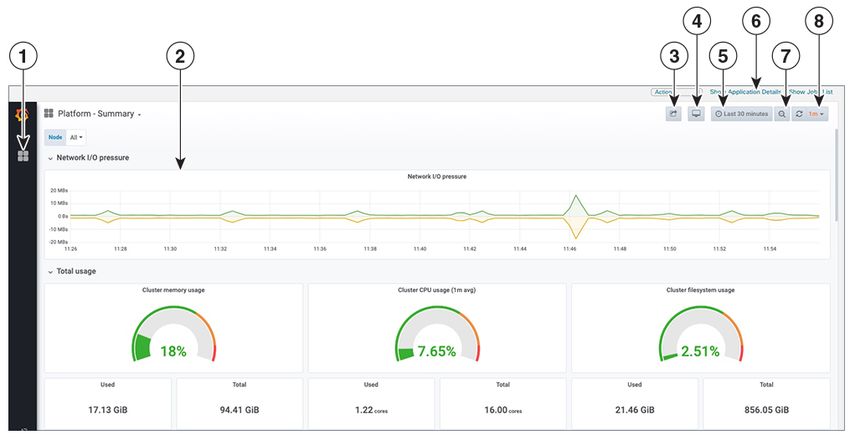
Manage System Health
                                                                                           Visually Monitor System Functions in Real Time

Step 5      Scroll the dashboard as needed to display all of the metrics it provides, or select any of the functions described in the
            following table.

            Item          Description

            1             Dashboard Icon: Click the icon to re-display the dashboard list and select a different dashboard.

            2             Time Series Graph Zoom: You can zoom in on a specific time period within the graph of any time series
                          data, as follows:
                          a. Click a time-period starting point in the graph line and hold down the mouse.
                          b. Drag the cursor to the endpoint. Light gray shading will appear in the block you are selecting. When
                             you reach the endpoint, release the mouse.

                          To reset a zoomed time series graph to the default, click the Zoom Out icon.

            3             Share Dashboard icon: Click the icon to make the dashboard you are viewing shareable with other users.
                          Clicking this icon displays a popup window with tabs and options to share the dashboard in your choice
                          of these forms:
                              • URL Link: Click the Link tab and then click Copy to copy the dashboard's URL to your clipboard.
                                You can also choose whether to retain the current time and template settings with the URL.
                              • Local Snapshot File: Click the Snapshot tab and then click Local Snapshot. Grafana creates a local
                                snapshot of the dashboard on the server. When the snapshot is ready, click Copy Link to copy the
                                URL of the snapshot to your clipboard.
                              • Export to JSON File: Click the Export tab and then click Save to file. You will be prompted to save
                                or open the exported JSON file. You can also choose to turn data source names in the file into templates
                                by selecting the Export for sharing externally checkbox before clicking Save to file.
                              • View JSON File and Copy to Clipboard: Click the Export tab and then click View JSON (you
                                can choose to templatize data source names by selecting the Export for sharing externally checkbox
                                before clicking View JSON). Grafana displays the exported JSON code in a popup window. Click
                                Copy to Clipboard to copy the file to your clipboard.

                                                                                                    Manage System Health
                                                                                                                                      5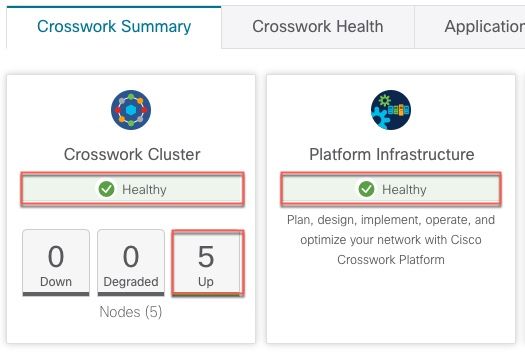
Manage System Health
  View System and Network Alarms

          Item           Description

          4              Cycle View Mode icon: Click this icon to toggle between the default Grafana TV view mode and the
                         Kiosk mode. The Kiosk view hides most of the Grafana menu. Press Esc to exit the Kiosk view.

          5              Time/Refresh Selector: Indicates the time period for the metrics displayed in the dashboard and how
                         often the metrics are refreshed. Click the selector to choose a different time range and refresh rate.
                         You can specify a custom pair of time-range start and end points, or choose from one of several predefined
                         ranges, such as Today so far or Last three hours.
                         You can choose predefined refresh rates from Off to 2 Days.
                         When you have finished making changes, click Apply.
                         When making selections, remember only 24 hours of data is stored. If you select time ranges or refresh
                         rates beyond that limit, the dashboard may be blank.

          6              Zoom Out icon: Click this icon to reset a zoomed time series graph back to the unzoomed state.

          7              Refresh icon: Immediately or choose time interval to refresh the data shown.

View System and Network Alarms
                      You can view alarms by navigating to one of the following:

                          • From the main Crosswork window, click        .
                          • From the main menu, choose Administration > Alarms.
                          • For application specific alarms, choose Administration > Crosswork Manager > Crosswork Health
                            tab. Expand one of the applications and select the Alarms tab.

                      From the Alarms window:
                          • Click the alarm description to drill down on alarm details.
                          • Acknowledge, change status, and add notes to alarms.

System Events
                      To help an operator troubleshoot issues, Crosswork Infrastructure has a Syslog feature which forwards system
                      related events to an external server (see Configure a Syslog Server, on page 17). All the events related to the
                      Crosswork platform are classified broadly into three categories: Day 0, Day 1, and Day 2. The following table
                      lists the event categories and sample events or actions within that category.

                  Manage System Health
      6
Manage System Health
Sample Day 0, Day 1, and Day 2 Events
Table 2: Event Classification
Event Classification Sample Events and Actions
Day 0 – Events related only to Crosswork • Checking the status of the cluster
Infrastructure installation.
• Adding a worker node
• Slow disk or latency issues
Day 1 – Events related to Crosswork application • Restarting a microservice
installation.
• Restarting a microservice fails
• Installing an application successfully
• Activating an application successfully
• Application is still not healthy within 3 minutes
of activation
• Node drain fails
• Activating an application fails
• Removing a worker node
Day 2 – Events related to system operations and • Node eviction
maintenance.
• Node eviction clean up fails
• Deactivating an application fails
• Uninstallation of an application fails
• Slow disk or network
• Node removal
• Node insertion
• Node drain fails
• K8S ETCD clean up
• Node removal fails
• Node deletion fails
• Deactivating an application successfully
• Uninstalling an application successfully
Sample Day 0, Day 1, and Day 2 Events
The following tables list related information to various Day 0, Day 1, and Day 2 events in a functional system.
Manage System Health
7Manage System Health
Sample Day 0, Day 1, and Day 2 Events
Day 0 Events
These checks can help determine whether the system is healthy.
Table 3: Adding a Worker Node
Severity Major
Description A VM node has been added. This event occurs when
the K8 cluster detects a node.
Sample Alarm None
Sample Syslog Message
orchestrator-capp-infra -
b54ec903-9e0f-49b8-aaf3-1d72cf644c28
vm4wkr-0 'Successfully added new VM into
Inventory: vm4wkr'
Recommendation Monitor and confirm that the VM node appears in the
UI with a healthy status.
Table 4: Slow Disk or Latency in Network Issues
Severity Critical
Description This event occurs when the Infrastructure Capp untar
takes more than 1.5 minutes or if the Docker push
takes more than 2 minutes to complete.
This message can be found in the firstboot.log file.
Sample Alarm Not applicable
Sample Syslog Message Not applicable
Recommendation This issue must be addressed before further operations
can be made on the system. Do the following:
• Check that disk storage and network SLA
requirements are met.
• Confirm that the observed bandwidth is the same
as what is provisioned between the nodes.
• If using RAID, confirm it is RAID 0.
Day 1 Events
Table 5: Removing a Worker Node
Severity Major
Description This event occurs when a VM node is erased.
Manage System Health
8Manage System Health
Sample Day 0, Day 1, and Day 2 Events
Sample Alarm None
Sample Syslog Message
CLUSTER-CLUSTER -
33a5ce0d-6cd0-4e4d-8438-85cfa8fb4ae9
CLUSTER-99
'user=admin,policyId=admin,backend=local,loginTime=2021-02-
28T01:38:48Z,Category=VM
Manager,RequestId=vm4wkr [Erase VM []]'
Recommendation Monitor and confirm that the VM node is no longer
seen in the UI. If the erase operation fails, attempt to
erase the node again.
Table 6: Adding an Application—Success
Severity Information
Description This event occurs when an application is added
successfully.
Alarm
Syslog Message
CLUSTER-CLUSTER -
627b2140-a906-4a96-b59b-1af22f2af9f6
CLUSTER-99
'job_type=INSTALL_AND_ACTIVATE_APPLICATION,manager=app_manager:
,user=admin,policyId=admin,backend=local,loginTime=2021-02-
28T09:34:54Z,payload={"package_identifier":{"id":"cappztp","
version":"1.1.0-prerelease.259+build.260"}}
[accepted]'
Recommendation None
Table 7: Adding an Application—Failure
Severity Information
Manage System Health
9Manage System Health
Sample Day 0, Day 1, and Day 2 Events
Description This event occurs when an application cannot be
added.
Sample Alarm
Sample Syslog Message None
Recommendation After fixing the error, try adding the application again.
Table 8: Activating an Application—Success
Severity Information
Description This event occurs after an application is activated
successfully.
Sample Alarm None
Syslog Message
orchestrator-Crosswork Health Manager -
010689d1-8842-43c2-8ebd-
5d91ded9d2d7 cw-ztp-service-0-0 '
cw-ztp-service-0 is healthy.'
Recommendation Activate the application and license.
Table 9: Activating an Application—Failure
Severity Critical
Description This event occurs if an application cannot be activated.
The activation may fail because microservices or pods
do not come up in time.
Sample Alarm None
Syslog Message None
Manage System Health
10Manage System Health
Sample Day 0, Day 1, and Day 2 Events
Recommendation Do the following:
• Look at the job history and identify where in the
activation process it failed. If it fails at the start
of one of the pods coming up, restart the pods.
• Uninstall the application and then try installing
the application again.
Table 10: Application Remains Unhealthy after 3 Minutes
Severity Major
Description This event occurs if the application was activated
successfully but the components remain unhealthy
after 3 minutes after application activation.
Sample Alarm None
Sample Syslog Message None
Recommendation You can wait longer and if it becomes healthy, clear
the alarm. Contact Cisco TAC if it still appears
unhealthy after some time.
Day 2 Events
Table 11: Node Drain—Cleanup
Severity Information
Description A node drain occurs if you erase a VM node or if the
node has been unresponsive for more than 5 minutes.
During the drain operation, pods running on the node
are moved (clustered pods may move or go pending,
single instance pods will move to another node).
Sample Alarms • Node Drain Failed
• K8s ETCD Cleanup Failed on Node Removal
• Node Delete
Syslog Message
orchestrator-Crosswork Health Manager -
b062232f-54dc-49b2-8283-
506b7bf672a6 astackserver-0-0 ' astackserver-0
health is degraded.'
Recommendation Monitor the operation. If the drain is a result of
eviction, erase the respective node and insert a new
one.
Manage System Health
11Manage System Health
Sample Day 0, Day 1, and Day 2 Events
Table 12: Node Drain—Failure
Severity Major
Description A node drain occurs if you erase a VM node or if the
node has been unresponsive for more than 5 minutes.
This event occurs if the node drain operation fails.
Sample Alarm None
Sample Syslog Message
orchestrator-Crosswork Health Manager -
b062232f-54dc-49b2-8283-
506b7bf672a6 astackserver-0-0 ' astackserver-0
health is degraded.'
Recommendation Try erasing the node again.
Table 13: Node Eviction—Failure
Severity Critical
Description In this scenario we assume that one of the hybrid
nodes fails.
This event occurs if the node has been down for more
than 5 minutes and it is automatically taken out of
service.
This event can be triggered if someone stopped or
deleted a VM without using Cisco Crosswork or if
there is a network outage to that node. K8s
automatically start evicting pods on that node (drain
eviction operation). The VM node will be marked
down during a successful cleanup.
Sample Alarm • Node Eviction Cleanup Failure
• K8S ETCD Cleanup Failed on Node Removal
Syslog Message None
Recommendation Erase the faulty node and insert a new VM.
Table 14: Node Eviction—Cleanup Failure
Severity Critical
Description This event occurs when the drain eviction fails. The
node has been down for more than 5 minutes and K8s
automatically start evicting pods on that node.
Sample Alarm None
Manage System Health
12Manage System Health
Sample Day 0, Day 1, and Day 2 Events
Sample Syslog Message None
Recommendation Erase the node and attempt another cleanup operation.
Table 15: Resource Footprint Shortage
Severity Critical
Description This event occurs when cluster node resources are
being highly utilized and there is a lack of a resource
footprint.
Sample Alarm None
Sample Syslog Message None
Recommendation Add a new worker node.
Table 16: Deactivating an Application—Success
Severity Minor
Description This event occurs when an application is deactivated.
Sample Alarm None
Sample Syslog Message
CLUSTER-CLUSTER -
ade982ea-7f60-4d6b-b7e0-ebafc789edee
CLUSTER-99
© 2021 Cisco and/or its affiliates. All rights
reserved. Cisco Confidential – DRAFT version
1
'user=admin,policyId=admin,backend=local,loginTime=2021-02-
28T09:34:54Z,job_type=UNINSTALL_APPLICATION,manager=app_manager:
,payload={"application_id":"capp-ztp"}
[accepted]'
Recommendation None
Table 17: Deactivating an Application—Failure
Severity Critical
Description This event occurs when an application cannot be
deactivated. This can occu if microservices or pods
are still running.
Sample Alarm None
Syslog Message None
Manage System Health
13Manage System Health
Sample Day 0, Day 1, and Day 2 Events
Recommendation Do the following:
• Look at the job history and identify where in the
activation process it failed. If it fails at the start
of one of the pods coming up, restart the pods.
• Uninstall the application and then try installing
the application again.
Table 18: Slow Disk or Latency in Network Issues
Severity Critical
Description This event occurs when the Infrastructure Capp untar
takes more than 1.5 minutes or if the Docker push
takes more than 2 minutes to complete.
This message can be found in the firstboot.log file.
Sample Alarm Not applicable
Sample Syslog Message Not applicable
Recommendation This issue must be addressed before further operations
can be made on the system. Do the following:
• Check that disk storage and network SLA
requirements are met.
• Confirm that the observed bandwidth is the same
as what is provisioned between the nodes.
• If using RAID, confirm it is RAID 0.
Table 19: ETCD Cleanup
Severity Information
Description This event occurs if someone erases a VM node and
the ETCD clean membership cleanup operation
begins.
Sample Alarms If ETCD cleanup fails:
• K8S ETCD Cleanup Failed on Node Removal
• Alarm Node Delete
Syslog Message None
Recommendation Monitor operation.
Manage System Health
14Manage System Health
Check System Health Example
Table 20: K8S ETCD Cleanup Failed on Node Removal
Severity Major
Description This event occurs if the ETCD cleanup operation fails.
Sample Alarm None
Sample Syslog Message None
Recommendation Try erasing the node again.
Table 21: Restart Microservices—Failure
Severity Warning
Description This event occurs when someone restarts a
microservice or pod and the operation fails.
Sample Alarm None
Sample Syslog Message None
Recommendation Restart the microservices or pods. You may have to
do this a few times to see if it recovers.
Check System Health Example
In this example, we navigate through the various windows and what areas should be checked for a healthy
Crosswork system.
Step 1 Check overall system health.
a) From the main menu, choose Administration > Crosswork Manager > Crosswork Summary tab.
b) Check that all the nodes are in Operational state (Up) and that the Crosswork Cluster and Platform Infrastructure is
Healthy.
Manage System Health
15Manage System Health
Check System Health Example
Figure 1: Crosswork Summary
Step 2 Check and view detailed information about the microservices that are running as part of the Crosswork Platform
Infrastructure.
a) Click the Crosswork Health tab.
b) Expand the Crosswork Platform Infrastructure row, click , and select Application Details.
Figure 2: Crosswork Health
c) From the Application Details window, you can check and review microservice details, restart microservices, and
collect showtech information. You can also perform installation-related tasks from this window.
Manage System Health
16Manage System Health
Configure a Syslog Server
Figure 3: Application Details
Step 3 Check and view alarms related to the microservices.
a) Click the Alarms tab. The list only displays Crosswork Platform Infrastructure alarms. You can further filter the list
by viewing only active alarms.
Figure 4: Alarms
Step 4 View which Crosswork applications are installed.
a) From the main menu, choose Administration > Crosswork Manager > Application Management tab and click
Applications. This window displays all applications that have been installed. You can also click Add File (.tar.gz)
to install more applications.
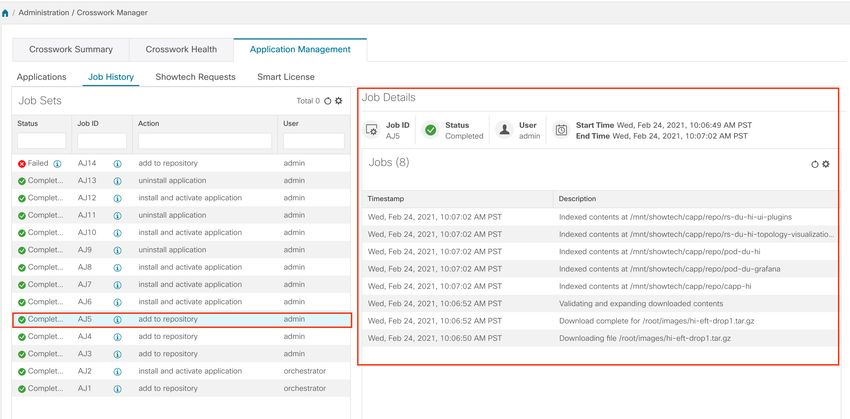
Step 5 View the status of jobs.
a) Click the Job History tab. This window provides the information regarding the status of jobs and the sequence of
events that have been executed as part of the job process.
Configure a Syslog Server
Crosswork allows external syslog consumers to:
Manage System Health
17Manage System Health
Collect Audit Information
• Register on Crosswork and receive system events as syslogs.
• Define and filter which kind of events should be forwarded as a syslog, per consumer.
• Define the rate of which syslogs are forwarded to the consumer.
Step 1 From the main menu, choose Administration > Settings > System Settings tab.
Step 2 Click .
Step 3 Enter Syslog configuration details. For more information, click next to each option.
Use the Criteria option to define scope and range of which kind of events should be forwarded as a syslog. For example:
(EventSeverity=5) and OriginAppId=capp-infra and EventCategory=1
The expression will send events as a syslog only if the event originates from the Infrastructure Platform, the category is
the system, and the severity is either less than 2 or is equal or above 5.
Caution Expressions are freeform and not validated.
Collect Audit Information
Audit logs map user information with all the critical user actions performed in the system. To view application
Showtech logs, see Monitor Platform Infrastructure and Application Health, on page 2.
The audit log includes user actions related to the following operations:
• Device onboarding
• User creation, deletion, and configuration updates
• Crosswork Data Gateway management operations
• Collection job creation
• Administrative tasks (show-tech execution, topology updates, NSO-related actions)
• Cisco Crosswork Change Automation and Health Insights:
• Manage playbooks (import, export, or delete) and playbook execution.
Manage System Health
18Manage System Health
Collect Audit Information
Note When a playbook execution request is sent, Change Automation prints an audit
log. The audit log includes details like the playbook name, user information,
session details, and the execution ID of the job. When Change Automation
executes a playbook maintenance task, it also prints an audit log. The maintenance
audit log contains details such as the execution ID. If it performs the commit on
NSO, the maintenance audit log details also include the commit label. You can
use the audit log to identify all the commit labels associated with an execution
ID. Use the commit labels to perform a lookup on the NCS CLI. The lookup
shows the exact configuration changes that Change Automation pushed to the
device.
• KPIs, KPI Profiles, and Alert group creation, deletion, and configuration updates
• Enabling and disabling of KPI Profiles
• Cisco Crosswork Optimization Engine:
• SR-TE policy and RSVP TE tunnel creation, deletion, and configuration updates
• Affinity mapping configuration
• Bandwidth on Demand and Bandwidth Optimization function and configuration updates
• RESTCONF API creation, deletion, and configuration updates
Sample Cisco Crosswork Change Automation and Health Insights Audit Log Entry
The following is a sample audit log entry created when a local admin user runs a playbook.
time="2020-06-09 21:24:31.103312" level=info msg="playbook scheduled for execution"
backend=local execution_id=1591737871096-a6699d03-8264-4ea8-8f6f-03e8a58f32a3
latency=11.330355ms loginTime="2020-06-09T20:27:11Z" method=POST
playbook="router_config_traffic_steering" policyId=admin
set_id=5405fdb1-6b37-41cb-94a3-32b180d3b773 set_name=static-acl-b180d3b773
tag="ROBOT_manager-nca-7689b-fdn8g" user=admin
Sample Cisco Crosswork Optimization Engine Audit Log Entries
Crosswork Optimization Engine UI Audit Log Entry Example
2020-06-12 02:48:07,990 INFO c.c.s.o.e.AuditLogger [http-nio-8080-exec-3] time=2020-06-12
02:48:07.000990 message=SR Policy created successfully. user=admin policyId=admin
backend=local loginTime=1591929794
{data={"headEnd":"192.168.0.2","endPoint":"192.168.0.6","color":"999","description":"","profileId":"","bindingSid":"333",
"path":{"type":"dynamic","pathName":"Automation_validating_sr","metric":"IGP",
"affinity":[{"constraintType":"EXCLUDE_ANY","affinity":[31]}],"disjointness":{"disjointType":"",
"associationGroup":"","subId":""}, "protectedSegment":"SEG_PROTECTED"}}}
Crosswork Optimization Engine RESTCONF API Audit Log Entry Example
time="2020-06-06 13:49:06,308"
message="action=/operations/cisco-crosswork-optimization-engine-sr-policy-operations:sr-policy-delete,
input={\"input\": {\"sr-policies\": [{\"head-end\": \"192.168.0.2\", \"end-point\":
\"192.168.0.3\", \"color\": 301}]}},
output={\"cisco-crosswork-optimization-engine-sr-policy-operations:output\":{\"results\":
[{\"head-end\":\"192.168.0.2\",\"end-point\":\"192.168.0.3\",\"color\":301, \"message\":\"SR
Manage System Health
19Manage System Health
Collect Audit Information
policy not found in Config DB\",\"state\":\"failure\"}]}}" user=admin policyId=admin
backend=local loginTime=1591451346 method=POST
url=/operations/cisco-crosswork-optimization-engine-sr-policy-operations:sr-policy-delete
Table 22: Common Audit Log Entry Fields
Field Description
time The time that Crosswork created this audit log.
message Message sent between applications.
msg Message sent between applications.
user Name of the user.
policyId Role or permission of user (taken from local database, TACACS, or LDAP server).
backend The server (local database, TACACS, or LDAP) authenticating users.
loginTime The epoch time when the user has logged in. Epoch time is intentionally selected, as it shorter
and independent of time zones.
Other fields Individual applications use more fields specific to that application. For example:
• In the sample audit log entry for Cisco Crosswork Change Automation and Health Insights,
the playbook field refers to the playbook that Change Automation executed.
• In the UI audit log entry for Crosswork Optimization Engine, data is a field that refers
to the creation details of an SR-TE policy and its attributes.
Audit Log Location
Crosswork stores audit logs in /var/log/audit/audit.log, under the respective application pods.
For example:
• The sample Change Automation audit log is in the data directory under the pod.
• The sample Crosswork Optimization Engine UI audit log is in the optima-uiservice pod; the
RESTCONF API audit log is under the optima-restconf pod.
In addition to the individual application audit logs, Cisco Crosswork collects all audit log files are once each
hour. Crosswork stores them as separate gzipped tar files in the following data directory:
/mnt/robot_datafs///auditlogs/auditlogs.tar.gz
Crosswork collects audit log files based on the specified maximum size and number of backups for each
application. For example: MaxSize:20 megabytes and MaxBackups: 5.
Manage System Health
20You can also read