Management's Discussion and Analysis - TSX: CIA - ASX: CIA As at May 27, 2021 - For the Year Ended March 31, 2021 - Champion Iron
←
→
Page content transcription
If your browser does not render page correctly, please read the page content below
Management’s Discussion and Analysis
        For the Year Ended March 31, 2021

             TSX: CIA - ASX: CIA

             As at May 27, 2021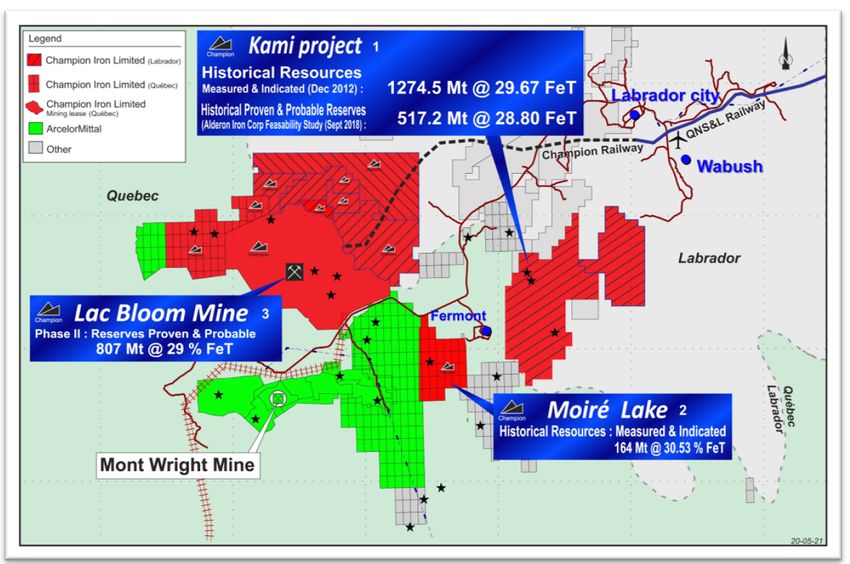
Champion Iron Limited
Management's Discussion and Analysis
(Expressed in Canadian dollars, except where otherwise indicated)

The following Champion Iron Limited (“Champion” or the “Company”) Management Discussion and Analysis (“MD&A”) has been prepared as of
May 27, 2021. This MD&A is intended to supplement the audited consolidated financial statements for the year ended March 31, 2021 and
related notes thereto (“Financial Statements”), which have been prepared in accordance with the requirements of the Corporations Act 2001,
Australian Accounting Standards, other authoritative pronouncements of the Australian Accounting Standards Board (AASB), including
Australian Interpretations and the International Financial Reporting Standards ("IFRS") as issued by the International Accounting Standards
Board ("IASB"). The Financial Statements and other information pertaining to the Company are available on SEDAR at www.sedar.com, the ASX
at www.asx.com.au and the Company's website at www.championiron.com.

Champion's management team (“Management”) is responsible for the preparation and integrity of the Financial Statements, including the
maintenance of appropriate information systems, procedures and internal controls. Management is also responsible for ensuring that
information disclosed externally, including the Financial Statements and MD&A, is complete and reliable.

Unless otherwise specified, all dollar figures stated herein are expressed in Canadian dollars, except for: (i) tabular amounts which are in
thousands of Canadian dollars; and (ii) per share or per tonne amounts. The following abbreviations are used throughout this MD&A: US$
(United States dollar), CA$ (Canadian dollar), t (tonnes), wmt (wet metric tonnes), dmt (dry metric tonnes), Mtpa (million tonnes per annum), M
(million), km (kilometers), m (meters) and EPS (earnings per share). The utilization of “Champion" or the “Company” refers to Champion Iron
Limited and/or one, or more, or all of its subsidiaries, as applicable.

This MD&A contains forward-looking statements. Particular attention should be given to the risk factors described in the “Risk Factors” section
of this MD&A and to the “Cautionary Note Regarding Forward-Looking Statements” section of this MD&A.

Non-IFRS Financial Performance Measures
Certain financial performance measures with no standard meaning under IFRS are included in this MD&A. Champion believes that these
measures, in addition to conventional measures prepared in accordance with IFRS, provide investors with an improved ability to evaluate the
underlying performance of the Company. These measures are intended to provide additional information and should not be considered in
isolation, or as a substitute for, measures of performance prepared in accordance with IFRS. These measures do not have any standardized
meaning prescribed under IFRS and therefore may not be comparable to other issuers. The non-IFRS financial performance measures included
in this MD&A are: total cash cost or C1 cash cost, incremental costs related to COVID-19 per dmt sold, all-in sustaining costs (“AISC”), net
average realized selling price, cash operating margin and cash profit margin, earnings before interest, tax, depreciation and amortization
(“EBITDA”), EBITDA margin, adjusted net income, adjusted net income attributable to Champion shareholders, adjusted EPS, operating cash
flow per share and cash on hand. For a detailed description of each of the non-IFRS measures used in this MD&A and a detailed reconciliation
to the most directly comparable measure under IFRS, please refer to the “Non-IFRS Financial Performance Measures” section of this MD&A.

1. Description of Business
Champion was incorporated under the laws of Australia in 2006 and is listed on the Toronto Stock Exchange (TSX: CIA), the Australian
Securities Exchange (ASX: CIA) and the OTCQX Best Market (OTCQX: CIAFF).

Champion Iron Limited, through its subsidiary Quebec Iron Ore Inc. (“QIO”), owns and operates the Bloom Lake Mining Complex (“Bloom Lake” or
“Bloom Lake Mine”), located on the south end of the Labrador Trough, approximately 13 km north of Fermont, Québec, adjacent to established
iron ore producers. Bloom Lake is an open-pit truck and shovel operation with a concentrator, and it ships iron ore concentrate from the site by
rail, initially on the Bloom Lake Railway, to a ship loading port in Sept-Îles, Québec. The Bloom Lake Phase I plant has a nameplate capacity of
7.4 Mtpa and produces a high-grade 66.2% Fe iron ore concentrate with low contaminant levels, which has proven to attract a premium to the
Platts IODEX 62% Fe iron ore benchmark. In addition to the partially completed Bloom Lake Phase II expansion project (“Phase II”), Champion
owns a portfolio of exploration and development projects in the Labrador Trough, including the Kamistiatusset iron ore project (the “Kami
Project”) located a few kilometres south east of Bloom Lake, and the Fire Lake North iron ore project, located approximately 40 km south of
Bloom Lake. The Company sells its iron ore concentrate globally, including customers in China, Japan, the Middle East, Europe, South Korea,
India and Canada.

                                                                                                                                     2 Page
Champion Iron Limited
Management's Discussion and Analysis
(Expressed in Canadian dollars, except where otherwise indicated)
2. Financial and Operating Highlights
Three Months Ended Year Ended
March 31, March 31,
2021 2020 2021 2020 2019
Iron ore concentrate produced (wmt) 2,011,400 1,891,800 8,001,200 7,903,700 6,994,500
Iron ore concentrate sold (dmt) 1,971,100 1,888,200 7,684,500 7,577,400 7,127,600
Financial Data (in thousands of dollars, except per share amounts)
Revenues 396,702 175,702 1,281,815 785,086 655,129
Gross profit 277,116 64,918 817,756 363,717 288,632
EBITDA1 275,764 60,655 819,477 347,433 276,575
EBITDA margin1 70 % 35 % 64 % 44 % 42 %
Net income 155,934 18,351 464,425 121,050 147,599
Adjusted net income1 155,499 18,351 470,681 172,691 147,599
Net income attributable to Champion shareholders 155,934 18,351 464,425 89,426 83,046
Adjusted net income attributable to Champion shareholders1 155,499 18,351 470,681 141,067 83,046
Basic earnings per share 0.32 0.04 0.97 0.20 0.20
Adjusted earnings per share1 0.31 0.04 0.98 0.32 0.20
Net cash flow from operations 228,566 84,614 623,476 309,567 176,698
Cash and cash equivalents 609,316 281,363 609,316 281,363 135,424
Short-term investments 27,200 17,291 27,200 17,291 17,907
Total assets 1,496,906 882,598 1,496,906 882,598 672,017
Total non-current financial liabilities 214,951 275,968 214,951 275,968 262,864
Statistics (in dollars per dmt sold)
Gross average realized selling price 220.0 130.5 182.3 142.5 120.6
Net average realized selling price1 201.3 93.1 166.8 103.6 91.9
Total cash cost1 (C1 cash cost) 54.4 53.9 54.2 52.7 49.4
All-in sustaining cost1 65.1 59.8 62.8 62.7 55.8
Cash operating margin1 136.2 33.3 104.0 40.9 36.1
Statistics (in US dollars per dmt sold)
Gross average realized selling price 173.9 96.9 139.1 107.2 91.9
Net average realized selling price1 159.3 69.7 127.3 78.0 70.0
Total cash cost1 (C1 cash cost) 43.0 40.1 41.0 39.6 37.7
All-in sustaining cost1 51.4 44.5 47.5 47.1 42.5
Cash operating margin1 107.9 25.2 79.8 30.9 27.5
1
This is a non-IFRS financial performance measure with no standard definition under IFRS. See the “Non-IFRS Financial Performance Measures” section of this MD&A included in
note 22.
3 PageChampion Iron Limited
Management's Discussion and Analysis
(Expressed in Canadian dollars, except where otherwise indicated)
3. Quarterly and Year-to-Date Highlights
Health & Safety
• Expansion of Bloom Lake’s COVID-19 laboratory testing capacity, allowing ongoing and uninterrupted operational activities; and
• An employee recordable injury frequency rate of 2.45, which is in line with Québec's open pit industry standards.
Financial
• Revenues of $396.7M and $1,281.8M for the three-month period and year ended March 31, 2021, respectively, compared to $175.7M
and $785.1M, respectively, for the same periods in 2020;
• Record EBITDA1 of $275.8M for the three-month period ended March 31, 2021, compared to $60.7M for the same period in 2020.
Record EBITDA1 of $819.5M for the year ended March 31, 2021, compared to $347.4M for the same period in 2020;
• Record net income of $155.9M for the three-month period ended March 31, 2021 (EPS of $0.32), compared to $18.4M for the same
period in 2020 (EPS of $0.04). Record net income of $464.4M for the year ended March 31, 2021 (EPS of $0.97), compared to $121.1M
for the same period in 2020 (EPS of $0.20);
• Net cash flow from operations of $228.6M for the three-month period ended March 31, 2021, representing operating cash flow per
share1 of $0.46, compared to $84.6M or $0.18 per share1 for the same period in 2020. Net cash flow from operations of $623.5M for
the year ended March 31, 2021, representing operating cash flow per share1 of $1.30, compared to $309.6M or $0.70 per share1 for the
same period in 2020;
• Cash on hand1 and restricted cash totaled $680.5M as at March 31, 2021, compared to $551.8M as at December 31, 2020 and $298.7M
as at March 31, 2020; and
• Full repayment of the US$20.0M revolving credit facility (the “Revolving Facility”) on March 30, 2021, bringing the total undrawn and
available credit facilities (“Credit Facility”) to US$220.0M as at March 31, 2021.
1
This is a non-IFRS financial performance measure with no standard definition under IFRS. See the “Non-IFRS Financial Performance Measures” section of this MD&A included in
note 22.
4 PageChampion Iron Limited
Management's Discussion and Analysis
(Expressed in Canadian dollars, except where otherwise indicated)
3. Quarterly and Year-to-Date Highlights (continued)
Operations
• Production of 2,011,400 wmt of high-grade 66.5% iron ore (“Fe”) concentrate for the three-month period ended March 31, 2021,
compared to 1,891,800 wmt for the same period in 2020, contributing to a record annual production of 8,001,200 wmt of high-grade
66.4% Fe concentrate for the year ended March 31, 2021, compared to 7,903,700 wmt for the same period in 2020;
• Recovery rate of 82.6% and 83.5% for the three-month period and year ended March 31, 2021, respectively, compared to a recovery
rate of 82.3% and 82.6%, respectively, for the same periods in 2020; and
• Total cash cost1 of $54.4/dmt (US$43.0/dmt) (C1) and $54.2/dmt (US$41.0/dmt) for the three-month period and year ended
March 31, 2021, respectively, compared to $53.9/dmt (US$40.1/dmt) and $52.7/dmt (US$39.6/dmt), respectively, for the same
periods in 2020.
Growth and Development
• Progression of laboratory testing for the production of iron ore concentrate, grading more than 69% Fe, enabling the Company to
engage with Direct Reduction (“DR”) iron and steel producers, and help support decarbonization initiatives;
• Ongoing laboratory testing and development of cold pelletizing technologies;
• Quarterly and annual production of 374,400 wmt and 575,700 wmt, respectively, of DR quality iron ore concentrate, grading 67.7% Fe
with a combined silica and alumina content of 2.8%;
• Inclusion in the S&P/ASX 200 Index, Australia's preeminent benchmark index, which measures the performance of the 200 largest
index-eligible stocks listed on the ASX; and
• Acquisition of the Kami Project and its related mining properties on April 1, 2021, and initiation of work related to revising the Kami
Project’s feasibility study, as the Company evaluates its growth alternatives within its portfolio.
Phase II Milestones
• Construction work is progressing as planned with more than 200 individuals actively working on the Phase II project, which is
expected to be completed by mid-2022;
• Agreement to expand the existing long-term rail contract with Quebec North Shore and Labrador Railway (“QNS&L”) to accommodate
the anticipated increased Phase II production volumes;
• Receipt and installation of most of the spirals required for the Phase II plant; and
• Ordering of long lead time items, including the stacker reclaimer by Société Ferroviaire et Portuaire de Pointe-Noire (“SFPPN”).
1
This is a non-IFRS financial performance measure with no standard definition under IFRS. See the “Non-IFRS Financial Performance Measures” section of this MD&A included in
note 22.
5 PageChampion Iron Limited
Management's Discussion and Analysis
(Expressed in Canadian dollars, except where otherwise indicated)
4. Response to the COVID-19 Pandemic
The COVID-19 pandemic continues to impact the global economy, creating significant economic uncertainty.
Health and Safety of the Company’s Employees, Partners and Local Communities
Since the beginning of the pandemic, the Company has consistently and proactively deployed several measures in its efforts to mitigate risks
related to COVID-19, in line with or exceeding the Government of Québec's (the “Government”) guidelines. Despite the acceleration of COVID-19
vaccination efforts in the Province of Québec, the Company continues to enforce all of its measures, including the following:
• Established an executive committee to monitor and adapt to the ongoing challenges created by COVID-19;
• Adapted work environments and implementation of safety rules and protocols;
◦ Establishment and expansion of a rapid-testing COVID-19 laboratory using technology approved and certified by Health Canada
at the mine site, allowing the Company to screen all employees and contractors in order to prevent outbreaks;
◦ Establishment of a contingency plan for each sector of activity in the event of multiple COVID-19 detections;
◦ Temperature monitoring and control prior to traveling and entering the Bloom Lake Mine site;
◦ Disinfection stations across the mine site and adoption of social distancing protocols;
◦ Adoption of isolation measures from the nearby communities and self-isolation for workforce who exhibit symptoms;
◦ Additional transportation capacity to allow for adequate social distancing; and
◦ Employees' contact register to trace potential infections and to launch disease protocol for suspected cases.
• Mandatory information session for new contractors and employees and communication of updated measures;
• Monitoring of COVID-19 related measures adopted by contractors; and
• Monthly and daily audit to review the effectiveness of the Company's adopted measures.
In addition, the Company is participating to the establishment of the Côte-Nord Industry Vaccination Center (the “Vaccination Center”), in
collaboration with Rio Tinto IOC, ArcelorMittal Mines and Infrastructure Canada and Aluminerie Alouette. Located in Sept-Îles, the Vaccination
Center’s operations began on May 13, 2021 when vaccination was available to the adult population. The collective effort to establish the
Vaccination Center supports the Government’s initiative to increase immunization capacity in the region by providing greater vaccination
access for local communities.
The Company's full COVID-19 plan is available on its website at www.championiron.com.
Financial and Operational Impacts
To date, the Company's risk-mitigating actions have proven successful in minimizing the pandemic's impact, with Bloom Lake operating at full
capacity. During the three-month period ended March 31, 2021, there were no significant operational disruptions caused by COVID-19.
The Company implemented best practices in managing its response to the COVID-19 pandemic resulting in direct and incremental operating
costs during the three-month period and year ended March 31, 2021, which totaled $3.2 million or $1.6/dmt1 and $12.6 million or $1.6/dmt1,
respectively. Additional indirect operational costs were incurred since the beginning of the pandemic, including inefficiency-related costs
across several areas of the Company's operations.
Uncertainties due to COVID-19
Although the Company is managing its operations and liquidity to mitigate risks related to COVID-19, given the significant uncertainty
regarding the ultimate impact that the COVID-19 pandemic will have on the overall economy and the demand for iron ore concentrate, the
extent to which the pandemic could impact operations and cash flows in the future remains uncertain and will depend on future developments,
such as the duration of the pandemic, the emergence of virus variants, the efficacy and availability of vaccines and regulatory actions to
contain the virus.
1
This is a non-IFRS financial performance measure with no standard definition under IFRS. See the “Non-IFRS Financial Performance Measures” section of this MD&A included in
note 22.
6 PageChampion Iron Limited
Management's Discussion and Analysis
(Expressed in Canadian dollars, except where otherwise indicated)
5. Bloom Lake Phase II Update
Bloom Lake Feasibility Study (the "Feasibility Study")
On June 20, 2019, the Company announced the findings of the Feasibility Study, prepared pursuant to National Instrument 43-101 – Standards
of Disclosure for Mineral Projects (“NI 43-101”) and the Joint Ore Reserves Committee (“JORC”) Code (2012 edition) (see press release dated
June 20, 2019 available under the Company’s filings on SEDAR at www.sedar.com, the ASX at www.asx.com.au and the Company's website at
www.championiron.com), including proven and probable mineral reserve estimates of 807.0 Mt (346.0 Mt proven reserves and 461.0 Mt
probable reserves) at an average grade of 29.0% Fe. The Phase II project, as detailed in the Feasibility Study, aims to double Bloom Lake's
nameplate capacity to 15 Mtpa of 66.2% Fe iron ore concentrate by completing the construction of the second plant which was partially
completed by the mine's former owner. Based on the new optimized mine plan, the Bloom Lake mining rate would also be increased to
accelerate the supply of ore to the expanded facilities, while maintaining a life of mine (“LoM”) of 20 years.
Financing
Subsequent to the Board of Directors' (the “Board”) final approval (on November 12, 2020) to complete the Phase II project, the Company
increased its Credit Facility on December 23, 2020 by US$200.0 million (to US$400.0 million). Given the Company's robust financial position,
including its reported total cash on hand1 and restricted cash of $680.5M as at March 31, 2021, it did not draw on its available US$200.0M
Credit Facility and was able to repay the US$20.0M Revolving Facility. As at March 31, 2021, the Company had a total undrawn Credit Facility of
US$220.0M, which together with available liquidity and ongoing cash flows from operations, are expected to fully fund the project, scheduled
for completion by mid-2022.
Milestones
During the three-month period ended March 31, 2021, $45,971,000 in capital expenditures and $9,200,000 in advance payments were incurred
for the project, for a total of $170,317,000 invested to date, which included $15,211,000 in advance payments to SFPPN. There are currently
more than 200 employees, consultants and subcontractors actively working on-site to meet the Bloom Lake Phase II completion objectives
and consequently, construction work is progressing as planned. The following work was undertaken and the following milestones were
achieved during the three-month period ended March 31, 2021:
• Agreement to expand the existing long-term rail contract with QNS&L to support the expected Phase II production volumes;
• Stacker reclaimer ordered by SFPPN;
• Receipt and installation of most of the Phase II plant spirals;
• Purchase of major mining equipment;
• Modifications made to the loading tower to accommodate Phase II operations; and
• Award of contracts for summer works in the tailings facility.
The Company intends to deliver the project by mid-2022 with the construction work to reach its peak between May and October 2021.
Bloom Lake Phase II reserves are based on the technical report entitled “Bloom Lake Mine – Feasibility Study Phase II”, prepared pursuant to
NI 43-101 and JORC Code (2012 edition) by BBA Inc., Soutex and WSP Canada Inc., having an effective date of June 20, 2019 and filed on
August 2, 2019 (the “Feasibility Study”). Bloom Lake Phase II mineral reserves include Bloom Lake Phase I mineral reserves as of the effective
date of the mineral reserve estimate reported in the Feasibility Study. The Company is not aware of any new information or data that materially
affects the information included in the Feasibility Study and confirms that all material assumptions and technical parameters underpinning
the estimates in the Feasibility Study continue to apply and have not materially changed. The Feasibility Study is available under the
Company's filings at www.sedar.com, on the ASX at www.asx.com.au or the Company's website at www.championiron.com.
1
This is a non-IFRS financial performance measure with no standard definition under IFRS. See the “Non-IFRS Financial Performance Measures” section of this MD&A included in
note 22.
7 PageChampion Iron Limited
Management's Discussion and Analysis
(Expressed in Canadian dollars, except where otherwise indicated)
6. Acquisition of the Kami Project
On April 1, 2021, the Company completed the acquisition of the Kami Project and certain related contracts (the “Acquisition”) pursuant to an
asset purchase agreement among certain affiliates of the Company and Deloitte Restructuring Inc. (the “Receiver”), as receiver for Alderon Iron
Ore Corp. and certain of its affiliates (collectively, “Alderon”). The Kami Project and the related mining properties are located in the Labrador
Trough geological belt in southwestern Newfoundland, near the Québec border.
The consideration for the Acquisition consisted of $15.0M in cash, the extinguishment of approximately $19.4M of Alderon’s secured debt (the
“Secured Debt”) and an undertaking in favour of the Receiver to make a finite production payment on a fixed amount of future iron ore
concentrate production from the Kami Project. In connection with the Acquisition, Champion purchased the Secured Debt from Sprott Private
Resource Lending (Collector), LP (“Sprott”). The Secured Debt was purchased for an aggregate consideration of 4,200,000 Champion's ordinary
shares issued to Sprott and Altius Resources Inc., who held a participation in the Secured Debt.
The Kami Project is a high-grade iron ore project near available infrastructure, situated only a few kilometers south-east of the Company's
operating Bloom Lake Mine. Alderon previously disclosed historical resources estimated at 1,274.5 Mt of measured and indicated resources
(536.9 Mt measured and 737.6 Mt indicated) and proven and probable reserves of 517.2 Mt (392.7 Mt proven and 124.5 Mt probable). The
historical mineral resources and reserves mentioned are strictly historical in nature, are non-compliant with NI 43-101 and the JORC Code
(2012 edition) and should therefore not be relied upon. A qualified person or competent person has not done sufficient work to upgrade or
classify the historical estimates as current "mineral resources" or "mineral reserves" or "ore reserves", as such terms are defined in NI 43-101
and the JORC Code (2012 edition), and it is uncertain whether, following evaluation and/or further exploration work, the historical estimates will
be able to be reported as mineral resources, mineral reserves or ore reserves in accordance with NI 43-101 or the JORC Code (2012 edition).
Champion is not treating the historical estimates as current mineral resources, mineral reserves or ore reserves. Refer to the notes
accompanying the figure below.
Alderon completed an updated feasibility study on the Kami Project in September 2018. The Company has initiated work to revise the Kami
Project's scope and update the feasibility study, as it evaluates its growth alternatives within its property portfolio. As part of the Acquisition,
Champion secured an additional 8 Mtpa of port capacity, including a pre-payment of port-related fees, at the multi-user berth at the port of
Sept-Îles, currently being used by the Company to export Bloom Lake's iron ore concentrate.
8 PageChampion Iron Limited
Management's Discussion and Analysis
(Expressed in Canadian dollars, except where otherwise indicated)
6. Acquisition of the Kami Project (continued)
Notes
1. The historical Kami Project resource estimates are based on the NI 43-101 technical report entitled “Feasibility Study of the Rose Deposit and
Resource Estimate for the Mills Lake Deposit of the Kamistiatusset (Kami) Iron Ore Property, Labrador” prepared for Alderon Iron Ore Corp. by BBA
Inc., Stantec and Watts, Griffis and McOuat Ltd. dated January 9, 2013 and having an effective date of December 17, 2012. The historical Kami
Project reserve estimates are based on the NI 43-101 technical report entitled “Updated Feasibility Study of the Kamistiatusset (Kami) Iron Ore
Property, Labrador” prepared for Alderon Iron Ore Corp. by BBA Inc., Gemtec Ltd., Watts, Griffis and McOuat Ltd. and Golder Associates Ltd. dated
October 31, 2018 and having an effective date of September 26, 2018. Kami Project mineral resources include Kami Project mineral reserves. The
historical mineral resources and reserves mentioned are strictly historical in nature, are non-compliant with NI 43-101 and the JORC Code (2012
edition) and should therefore not be relied upon. A qualified person or competent person has not done sufficient work to upgrade or classify the
historical estimates as current "mineral resources", "mineral reserves" or "ore reserves", as such terms are defined in NI 43-101 and the JORC
Code (2012 edition), and it is uncertain whether, following evaluation and/or further exploration work, the historical estimates will be able to be
reported as mineral resources, mineral reserves or ore reserves in accordance with NI 43-101 or the JORC Code (2012 edition). Champion is not
treating the historical estimates as current mineral resources, mineral reserves or ore reserves. These reserves and resources are not material
mining projects and are for properties adjacent to or near the Company's existing mining tenements and therefore the reports on these
mineralisations have not been prepared in accordance with the JORC Code (2012 edition) and the ASX Listing Rules. As stated above, the
Company has initiated work to revise the Kami Project's scope and update the feasibility study.
2. The historical Moiré Lake resource estimates are based on the NI 43-101 technical report entitled “Technical Report and Mineral Resource
Estimate on the Moire Lake Property” by P&E Mining Consultants Inc. dated May 11, 2012 and having an effective date of March 28, 2012. The
historical mineral resources mentioned are strictly historical in nature, are non-compliant with NI 43-101 and the JORC Code (2012 edition) and
should therefore not be relied upon. A qualified person or competent person has not done sufficient work to upgrade or classify the historical
estimates as current "mineral resources", "mineral reserves" or "ore reserves", as such terms are defined in NI 43-101 and the JORC Code (2012
edition), and it is uncertain whether, following evaluation and/or further exploration work, the historical estimates will be able to be reported as
mineral resources, mineral reserves or ore reserves in accordance with NI 43-101 or the JORC Code (2012 edition). Champion is not treating the
historical estimates as current mineral resources, mineral reserves or ore reserves. These reserves and resources are not material mining projects
and are for properties adjacent to or near the Company's existing mining tenements and therefore the reports on these mineralisations have not
been prepared in accordance with the JORC Code (2012 edition) and the ASX Listing Rules.
3. Bloom Lake Phase II reserves are based on the technical report entitled “Bloom Lake Mine – Feasibility Study Phase II”, prepared pursuant to
NI 43-101 and JORC Code (2012 edition) by BBA Inc., Soutex and WSP Canada Inc., having an effective date of June 20, 2019 and filed on
August 2, 2019 (the “Feasibility Study”). Bloom Lake Phase II mineral reserves include Bloom Lake Phase I mineral reserves as of the effective
date of the mineral reserve estimate reported in the Feasibility Study. The Company is not aware of any new information or data that materially
affects the information included in the Feasibility Study and confirms that all material assumptions and technical parameters underpinning the
estimates in the Feasibility Study continue to apply and have not materially changed. The Feasibility Study is available under the Company's
filings at www.sedar.com, on the ASX at www.asx.com.au or the Company's website at www.championiron.com.
4. Certain resources mentioned are foreign estimates from an Australian perspective.
9 PageChampion Iron Limited
Management's Discussion and Analysis
(Expressed in Canadian dollars, except where otherwise indicated)
7. Product Research and Development
The Company believes that the steel industry is undergoing a structural shift in its steelmaking methods, including an increased focus on
reducing greenhouse gas emissions from the iron and steelmaking processes. This dynamic could create rising demand for higher grade raw
materials and a shift towards reduction technologies used to produce liquid iron, such as the use of DR in EAF instead of the BF for liquid iron
production.
Accordingly, the Company has decided to deploy a Research and Development ("R&D") program which aims to develop technologies and
products to support the steelmaking transition from the BF method to the DR-EAF method, while supporting emissions reduction in the BF
process.
During the three-month period and year ended March 31, 2021, the Company incurred product "R&D" expenses of $336,000 and $1,258,000,
respectively. During the 2021 fiscal year, the program focused on three main areas:
1. Development of an iron ore pellet feed of more than 69% Fe;
2. Optimization of DR quality iron ore concentrate production of an average of 67.7% Fe; and
3. Development of a cold pelletizing technology.
Utilization of the DR process requires higher quality raw materials. Given the high-quality nature of the iron ore concentrate produced at the
Bloom Lake Mining Complex, the Company believes it can become a key player in reducing greenhouse gas emissions in the steelmaking
process. During the year, the Company has demonstrated, at laboratory scale, its ability to upgrade its current iron ore concentrate product to
more than 69% Fe using a flotation process.
During the first half of the year ended March 31, 2021, the Company also received confirmation from DR pellet producers and DR plant
operators that its initial commercial production test, completed during the fourth quarter of the 2020 fiscal year, qualified as DR iron ore
concentrate. With this confirmed product specification, in the three-month period and year ended March 31, 2021, the Company produced
respectively 374,400 wmt and 575,700 wmt of DR quality iron ore concentrate, at an average of 67.7% Fe, with an average combined silica and
alumina content of 2.8%. This demonstrates the ability of the Company to produce and sell higher quality iron ore products. DR quality iron ore
production strategically positions the Company to potentially increase its customer base and confirms that Bloom Lake is one of the few
producing deposits globally that can transition its product offering in response to a potential shift in the steelmaking methods in the coming
years.
Additionally, as part of its commitment to participate in the iron and steel industry decarbonization, the Company has financed and
collaborated with a European-based company which holds a proprietary cold agglomeration technology. The objective of the cold pelletizing
technology is to substantially reduce the emissions linked to the agglomeration of its material. Promising laboratory results demonstrated that
carbon emissions related to agglomeration could be reduced by more than 95% with this technology. The Company intends to further explore
the potential of cold pelletizing technologies towards industrial trials, with this European-based company.
10 PageChampion Iron Limited
Management's Discussion and Analysis
(Expressed in Canadian dollars, except where otherwise indicated)
8. Key Drivers
A. Iron Ore Concentrate Price
The price of iron ore concentrate is the most significant factor affecting the Company’s financial results. As such, net cash flow from
operations and the Company’s development may, in the future, be significantly and adversely affected by a decline in the price of iron ore. The
iron ore concentrate price fluctuates daily and is affected by several industry and macroeconomic factors beyond the Company's control.
Due to the high-quality properties of its 66.2% iron ore concentrate, the Company’s iron ore sales attract a premium over the IODEX 62% Fe CFR
China Index (“P62”), widely used as the reference price in the industry. As such, the Company quotes its products on the high-grade CFR China
Index (“P65” or “Platts 65”). The premium captured by the P65 index is attributable to two main factors: steel mills recognizing that higher iron
ore grades offer the benefit of optimizing output while also significantly decreasing CO2 emissions in the steelmaking process.
During the three-month period ended March 31, 2021, many factors contributed to elevate the iron price as well as the higher premium for
high-grade material. China's industrial activities, which usually come to a near stop during the Lunar New Year holiday, proved to be shorter
than usual as most workers were restricted from traveling to their hometowns due to COVID-19 governmental restrictions. As such, China’s
economic recovery continued in the period. This dynamic contributed to steel profit margins rising steadily until the end of the period which,
combined with high coking coal prices, supported the demand for high-grade iron ore in order to reduce dependence on coking coal in the
steelmaking process. The strong economic recovery in the world ex-China, namely in India, Europe and the USA, also had direct repercussions
on the global steel demand. The iron ore imports from these regions continued to rise throughout the period, leaving the global supply and
demand fundamentals in deficit, contributing to the rising iron ore price.
During the three-month period ended March 31, 2021, the premium captured by the P65 index relative to the P62 index was influenced by three
main factors: (i) a significant resurgence in Japanese steel production, which increased iron ore demand, (ii) a decrease in supply from lower
Brazilian exports as a consequence of the rainfall season, and (iii) a shift in the product demand mix in China, composed of higher quality iron
ore to reduce emissions, further to China's restrictions on its steel mills. The global economic recovery and its impact on steel demand,
combined with the consequences of higher prices for coking coal used in the steelmaking process, contributed to a steel capacity deficit in
several regions, which supported rising iron ore prices. Given this context, the Company has significantly reduced or cancelled discounted
pricing on its sales to the P65 index, previously required to compete with the pricing of pellets at multi-year lows in previous periods.
During the three-month period ended March 31, 2021, the P65 price for high-grade iron ore fluctuated from a low of US$174.1/dmt to a high of
US$203.0/dmt. The P65 index average price for the period was US$191.2/dmt, an increase of 31% from the previous quarter, resulting in a
premium of 14.6% over the P62 reference price of US$166.9/dmt. The Company’s gross average realized selling price for the quarter was
US$173.9/dmt, before adjustments related to provisional sales and ocean freight, resulting in a realized selling price representing a premium of
4.2% over the P62 index. Approximately 75% of Champion’s iron ore sales contracts are structured on a provisional pricing basis, where the
final sales price is determined using the iron ore price indices on or after the vessel’s arrival to the port at discharge. Accordingly, the gross
realized price upon shipment is estimated using the forward iron prices. As the timing of a majority of shipments were made at the end of the
quarter ended March 31, 2021, a large portion of the sales are based on the forward iron price, which was at a significant discount to the
average market prices prevailing during the quarter, as the average P62 for the period was US$166.9/dmt while the forward P62 iron price for
the second quarter of calendar 2021 was US$156.0/dmt. In addition, the lower realized price recognized compared to the P65 Index for the
three-month period ended March 31, 2021, was attributable to some of the Company's contracted volumes that are sold based on previous
months' prices, when the P65 prices were significantly lower. The Company should benefit from the current period prices for its contracted
volumes based on previous months' P65 prices in the upcoming fiscal period ending June 30, 2021. Taking into account sales adjustments and
sea freight costs, the Company's net realized FOB price was US$159.3/dmt (CA$201.3/dmt). The Company remains well positioned to benefit
from higher iron ore prices as it has no fixed price contracts in place, and the Bloom Lake Mine is not subject to royalties.
11 PageChampion Iron Limited
Management's Discussion and Analysis
(Expressed in Canadian dollars, except where otherwise indicated)
8. Key Drivers (continued)
A. Iron Ore Concentrate Price (continued)
During the year ended March 31, 2021, the P65 index price of high-grade iron ore fluctuated from a low of US$96.5/dmt to a high of US$203.0/
dmt. The P65 index average price for the period was US$143.7/dmt, an increase of 35% from the same period in 2020, resulting in a premium
of 12.1% over the P62 index reference price of US$128.2/dmt. The gross average realized selling price for the year was US$139.1/dmt, before
adjustments related to provisional sales and ocean freight, resulting in a premium of 8.5%. The lower premium realized is attributable to the
timing of the Company's contracted volumes, as 25% of Champion sales are determined using the iron price indices approximately three-
months prior to shipment, while 75% of the sales are based on the iron ore price indices on or after the vessel’s arrival to the port at discharge.
The significant discount that existed as of March 31, 2021 between the forward iron price and the average iron price during the last quarter of
the Company's fiscal year end contributed to a reduced premium between the P62 and the P65. The gross realized selling price was also
influenced by the fact that, in the second quarter of the 2021 fiscal year, some products were sold at a discounted selling price in order to
compete with the pricing of pellets, which were priced at multi-year lows. Given that current spot price of high-grade iron ore is significantly
higher than the forward price utilized to estimate the sales at year end, the Company should benefit from the current period prices for its
contracted volumes, based on previous months' P65 prices in the upcoming fiscal period ending June 30, 2021. Taking into account the latter,
and sea freight costs, the net realized FOB price was US$127.3/dmt (CA$166.8/dmt), compared to US$78.0/dmt (CA$103.6/dmt) for the same
period in 2020.
US$ Spot Price of Iron Ore Fines per dmt (As per Platts IODEX Index)
$200.00
$180.00
$160.00
$140.00
$120.00
$100.00
$80.00
Jun Sep Dec Mar Jun Sep Dec Mar
'19 '19 '19 '20 '20 '20 '20 '21
Average Monthly Iron Ore Price IODEX 65% Fe CFR China
Average Monthly Iron Ore Price IODEX 62% Fe CFR China
As previously mentioned, approximately 75% of Champion’s iron ore sales contracts are structured on a provisional pricing basis, where the
final sales price is determined using the iron ore price indices on or after the vessel’s arrival to the port at discharge. The Company recognizes
revenues from iron ore sales contracts upon vessel departure. In order to estimate the final sales price as assigned by sales contracts, the
Company assigns a provisional price upon vessel departure. The estimated gross consideration in relation to the provisionally priced contracts
is accounted for using the average between the P65 forward iron ore price at the expected settlement date and the P62 forward iron ore price,
subject to the historical P65 premium over the P62 price at the expected settlement date. Once the vessel arrives at its destination, the impact
of the iron ore price fluctuations, compared to the estimated price at the time of departure, is accounted for as a provisional pricing adjustment
to revenue.
As the Company's sales are subject to freight routes that take up to 55 days before reaching its customers, and since vessels subject to
provisional price adjustments are already in transit at quarter end, the final price adjustments to the provisional price are structurally more
exposed in the earlier months of each quarter. During the three-month period ended March 31, 2021, a final price was established for the
601,000 tonnes of iron ore that were in transit as at December 31, 2020. Accordingly, during the three-month period ended March 31, 2021,
provisional pricing adjustments of $20,449,000 were recorded as additional revenues for the 601,000 tonnes, representing a positive impact
of US$8.4/dmt (CA$$10.37/dmt). As at March 31, 2021, 1,007,000 tonnes of iron ore sales remained subject to provisional pricing adjustments,
with the final price to be determined in the subsequent reporting periods (March 31, 2020: 931,000 tonnes). A provisional price of US$182.7/
dmt has been used as at March 31, 2021, to estimate the sales of the Company's iron ore that remain subject to setting a final price.
12 PageChampion Iron Limited
Management's Discussion and Analysis
(Expressed in Canadian dollars, except where otherwise indicated)
8. Key Drivers (continued)
A. Iron Ore Concentrate Price (continued)
The following table sets out the Company’s exposure, as at March 31, 2021, in relation to the impact of movements in the iron ore price for the
provisionally invoiced sales volumes:
(in U.S. dollars) As at March 31,
2021
Tonnes (dmt) subject to provisional pricing adjustments 1,007,000
10% increase in iron ore prices 18,393
10% decrease in iron ore prices (18,393)
The sensitivities demonstrate the monetary impact on ore sales revenues resulting from a 10% increase and a 10% decrease in the realized
selling prices at each reporting date, while holding constant all other variables, including foreign exchange rates. The relationship between iron
ore prices and exchange rates is complex, and movements in exchange rates can impact commodity prices. The above sensitivities should
therefore be used with caution.
B. Sea Freight
Sea freight is an important component of the Company’s cost structure as it ships most of its iron ore concentrate to China, Japan, Europe and
the Middle East via sea routes. The common reference route for dry bulk material from the Americas to Asia is the Tubarao (Brazil) to Qingdao
(China) route which encompasses 11,000 nautical miles. The freight cost per tonne associated with this route is captured in the C3 Baltic
Capesize Index (“C3”) which is considered the reference ocean freight cost for iron ore shipped from Brazil to the Far East. There is no index for
the route between the port of Sept-Îles, Canada and China. The route from Sept-Îles to the Far East totals approximately 14,000 nautical miles
and is subject to different weather conditions during the winter season. Therefore, the freight cost per tonne associated with this voyage is
generally higher than the C3 index price.
US$ Sea Freight Cost per wmt – C3 Baltic Capesize Index (Brazil to China)
$30.00
$25.00
$20.00
$15.00
$10.00
$5.00
Jun Sep Dec Mar Jun Sep Dec Mar
'19 '19 '19 '20 '20 '20 '20 '21
In the past decade, the industry has identified a relationship between the iron ore price and the freight cost for the Tubarao to Qingdao route
captured in the C3 freight rate. Based on this observed correlation, when the price of iron ore fluctuates, the ocean freight rate usually
fluctuates in tandem. As the freight cost for the ocean transport between Sept-Îles and China is largely influenced by the C3 cost, a decrease in
iron ore prices should result in a lower ocean freight cost for the Company, resulting in a natural hedge for one of the Company's largest
operating costs.
13 PageChampion Iron Limited
Management's Discussion and Analysis
(Expressed in Canadian dollars, except where otherwise indicated)
8. Key Drivers (continued)
B. Sea Freight (continued)
The tragic event of the Brumadinho dam rupture in Brazil in January 2019 altered the connection between iron ore prices and the C3 freight
rate, as one of the largest producers of iron ore globally experienced a significant production curtailment, impacting export volumes from
Brazil since the first half of 2019. In the second half of 2019, some operations affected by these events resumed production, which contributed
to an increase in exports and thus contributed to the increase in the C3 route index. By the start of January 2020, world freight had stabilized
until the COVID-19 pandemic negatively impacted shipments.
In early 2020, the C3 index fell and tested historically low levels due to several factors, including: the Chinese New Year holidays, which
reduced demand for iron ore imports; heavy rains in Brazil, which negatively impacted exports of iron ore; ongoing supply issues related to the
2019 Brumadinho dam rupture; the temporary reduction of activities at several mining operations worldwide due to the COVID-19 pandemic;
and a significant drop in bunker fuel prices, which is a main component of the operating cost for dry bulk vessel operators. The slow ramp-up
of operations in 2020 contributed to maintaining lower sea freight prices, until the start of the three-month period ended March 31, 2021. A
lighter than usual rainy season combined with improved shipments from Brazil likely influenced the rising prices of the C3 index, which
experienced the largest price increase for the period since 2014. In addition to the above, the capesize market experienced the ripple effect
from rising demand for small ship freight where the container rates reached historical highs during the period. Several shippers were said to
combine parcels to ship in larger size vessels in an attempt to avoid the rising freight costs. This surge in smaller parcel freight cost was likely
impacted by rising fuel prices throughout the period, as well as the global economic recovery.
Due to its distance from main shipping hubs, Champion typically books vessels and their prices prior to the desired laycan period. This creates
a natural delay between the freight paid and the C3 route index price. The effects of these delays are eventually reconciled since Champion
ships its high-grade iron ore concentrate evenly throughout the year. In the previous quarter, the Company entered into a freight contract for a
portion of its expected volumes. This contract allowed for the shipment of one vessel per month from January 2021 to March 2021 at a fixed
price of US$17.50 per tonne plus freight commissions, resulting in important savings for the Company for the three-month period ended
March 31, 2021.
C. Currency
The Canadian dollar is the Company’s functional and reporting currency. Consequently, the Company’s operating results and cash flows are
influenced by changes in the exchange rate for the Canadian dollar against the U.S. dollar. The Company's sales, sea freight costs and long-
term debt are denominated in U.S. dollars. As such, the Company benefits from a natural hedge from its revenues with its sea freight costs and
long-term debt. Despite this natural hedge, the Company is exposed to foreign currency fluctuations as its mining operating expenses are
mainly incurred in Canadian dollars. Subsequent to March 31, 2021, the Company entered into forward foreign exchange contracts to reduce
the risk of variability of future cash flows resulting from forecasted sales. These contracts were approved by the Board to minimize its
exposure to foreign exchange rate fluctuations. The Company is continuously evaluating its currency exposure and opportunities to reduce its
impacts on the Company's results.
The strengthening of the U.S. dollar would positively impact the Company’s net income and cash flows while the strengthening of the Canadian
dollar would reduce its net income and cash flows. As the Company's long-term debt is denominated in U.S. dollars, the Company is subject to
ongoing non-cash foreign exchange adjustments, which may impact its financial results. Assuming a stable selling price, a variation of
CA$0.01 against the U.S. dollar will impact gross revenues by approximately 1%. Assuming a stable long-term debt balance, a variation of
CA$0.01 against the U.S. dollar will impact the debt revaluation by approximately 1%.
14 PageChampion Iron Limited
Management's Discussion and Analysis
(Expressed in Canadian dollars, except where otherwise indicated)
8. Key Drivers (continued)
C. Currency (continued)
Monthly Closing Exchange Rate – CA$/US$
$1.41
$1.38
$1.35
$1.32
$1.29
$1.26
Jun Sep Dec Mar Jun Sep Dec Mar
'19 '19 '19 '20 '20 '20 '20 '21
Exchange rates are as follows:
CA$ / US$
Average Closing
FY2021 FY2020 Variance FY2021 FY2020 Variance
Q1 1.3853 1.3377 4% 1.3628 1.3087 4%
Q2 1.3321 1.3204 1% 1.3339 1.3243 1%
Q3 1.3030 1.3200 (1)% 1.2732 1.2988 (2)%
Q4 1.2660 1.3449 (6)% 1.2575 1.4187 (11)%
Year-end as at March 31 1.3219 1.3308 (1)% 1.2575 1.4187 (11)%
Apart from these key drivers, the potential impact of the COVID-19 pandemic and the risk factors described in the “Risk Factors” section of this
MD&A, Management is not aware of any other trends, commitments, events or uncertainties that would have a material effect on the
Company’s business, financial condition or results of operations.
15 PageChampion Iron Limited
Management's Discussion and Analysis
(Expressed in Canadian dollars, except where otherwise indicated)
9. Bloom Lake Mine Operating Activities
Three Months Ended Year Ended
March 31, March 31,
2021 2020 Variance 2021 2020 Variance
Operating Data
Waste mined and hauled (wmt) 3,796,300 3,180,100 19% 15,481,100 13,742,400 13%
Ore mined and hauled (wmt) 5,636,100 5,413,100 4% 21,571,700 20,817,400 4%
Material mined and hauled (wmt) 9,432,400 8,593,200 10% 37,052,800 34,559,800 7%
Strip ratio 0.67 0.59 14% 0.72 0.66 9%
Ore milled (wmt) 5,237,800 4,880,000 7% 20,598,700 19,749,800 4%
Head grade Fe (%) 30.7 31.7 (3%) 30.7 32.1 (4%)
Recovery (%) 82.6 82.3 —% 83.5 82.6 1%
Product Fe (%) 66.5 66.5 —% 66.4 66.4 —%
Iron ore concentrate produced (wmt) 2,011,400 1,891,800 6% 8,001,200 7,903,700 1%
Iron ore concentrate sold (dmt) 1,971,100 1,888,200 4% 7,684,500 7,577,400 1%
Financial Data (in thousands of dollars)
Revenues 396,702 175,702 126% 1,281,815 785,086 63%
Cost of sales 107,137 101,721 5% 416,272 399,368 4%
Cost of sales - incremental costs related to COVID-19 3,162 — —% 12,610 — —%
Other expenses 14,591 12,862 13% 43,693 37,178 18%
Net finance costs 5,430 4,684 16% 22,428 84,244 (73%)
Net income 155,934 18,351 750% 464,425 121,050 284%
EBITDA1 275,764 60,655 355% 819,477 347,433 136%
Statistics (in dollars per dmt sold)
Gross average realized selling price 220.0 130.5 69% 182.3 142.5 28%
Net average realized selling price1 201.3 93.1 116% 166.8 103.6 61%
Total cash cost (C1 cash cost)1 54.4 53.9 1% 54.2 52.7 3%
All-in sustaining cost1 65.1 59.8 9% 62.8 62.7 —%
Cash operating margin1 136.2 33.3 309% 104.0 40.9 154%
Operational Performance
On March 24, 2020, the Company announced the ramp down of its operations following directives from the Government in response to the
COVID-19 pandemic, which required mining activities to be reduced to a minimum within the province of Québec. As announced by the
Company on April 23, 2020, operations gradually ramped up following the Government's announcement that mining activities were to be
considered a "priority service" in Québec. Early actions implemented by the Company in response to the COVID-19 pandemic minimized
impacts on the Company and its operations. Despite disruptions to operations in the first quarter of the fiscal year ended March 31, 2021, the
Company was able to set a new annual record production of 8,001,200 wmt of high-grade iron ore concentrate during the fiscal year ended
March 31, 2021.
i. Fourth Quarter of the 2021 Fiscal Year vs Fourth Quarter of the 2020 Fiscal Year
During the three-month period ended March 31, 2021, 9,432,400 tonnes of material was mined and hauled, compared to 8,593,200 tonnes for
the same period in 2020, an increase of 10%. This increase in material mined and hauled is attributable to the Company's ongoing mining
equipment rebuild program, which provided a higher equipment utilization rate and additional equipment availability. The higher volume mined
is also attributable to the commissioning of an additional haul truck during the year ended March 31, 2021.
The strip ratio increased to 0.67 for the three-month period ended March 31, 2021, compared to 0.59 for the same period in 2020. Although the
strip ratio is in line with the annual mine plan, it was negatively impacted by the Company's efforts to recover the waste backlog accumulated
during the first quarter of the 2021 fiscal year, when Champion's operations were disrupted by the Government's imposed COVID-19 directives.
1
This is a non-IFRS financial performance measure with no standard definition under IFRS. See the “Non-IFRS Financial Performance Measures” section of this MD&A included in
note 22.
16 PageChampion Iron Limited
Management's Discussion and Analysis
(Expressed in Canadian dollars, except where otherwise indicated)
9. Bloom Lake Mine Operating Activities (continued)
i. Fourth Quarter of the 2021 Fiscal Year vs Fourth Quarter of the 2020 Fiscal Year (continued)
The Bloom Lake plant processed 5,237,800 tonnes of ore during the three-month period ended March 31, 2021, compared to 4,880,000 tonnes
for the same period in 2020, representing an increase of 7%. The higher throughput resulted from higher mined ore availability and a higher mill
utilization rate. The continuous improvements and operational innovations allowed the Company to increase throughput stability and reach a
higher level of mill productivity, despite the inefficiencies created by COVID-19, enabling the Company to capitalize on elevated iron ore prices.
The iron ore head grade for the three-month period ended March 31, 2021 was 30.7%, compared to 31.7% for the same period in 2020. The
decrease in head grade is attributable to the presence of some lower grade ore being sourced and blended from different pits when compared
to the prior year, which is in line with the mining plan and the LoM head grade average.
During the three-month period ended March 31, 2021, the Company produced 374,400 wmt of DR quality iron ore concentrate at 67.7% Fe, with
a combined silica and alumina content of 2.8%. This production has been sold during the three-month period ended March 31, 2021,
demonstrating the Company’s ability to adapt to meet demand for higher quality iron ore products. The Company’s average recovery rate of
82.6% remained stable during the three-month period ended March 31, 2021 despite being adversely impacted by the production of low-silica
concentrate, compared to a recovery rate of 82.3% for the same period in 2020.
Bloom Lake produced 2,011,400 wmt of 66.5% Fe high-grade iron ore concentrate during the three-month period ended March 31, 2021, an
increase of 6%, compared to 1,891,800 wmt for the same period in 2020. The higher production is mainly a result of higher throughput, despite
being partially offset by a lower head grade.
ii. 2021 Fiscal Year vs 2020 Fiscal Year
During the first quarter of the 2021 fiscal year, the COVID-19 pandemic had a negative impact on several of the Company's activities, including:
reduced mining activities due to the compliance with public health directives issued by the Government; reduced equipment maintenance due
to COVID-19-related resource limitations which had adverse repercussions on equipment availability; the arrival of the seasonal workforce and
the operation of only one of the Company's two production lines for a period of time stemming from the Government's COVID-19-related
directives. Once the Government's restrictions were lifted, the Company accelerated its mining activities and fully resumed its production
capacity without subsequent interruption, demonstrating the Company’s agility to maximize its operations while minimizing the overall impact
of the pandemic.
The Company mined and hauled 37,052,800 tonnes of material during the year ended March 31, 2021, compared to 34,559,800 tonnes for the
same period in 2020, while the plant processed 20,598,700 tonnes of ore during the year ended March 31, 2021, an increase of 4% over the
same period in 2020. These increases are attributable to investments made in the mining equipment rebuild program, along with the
improvements and operational innovations accomplished at the plant in the past, which enabled the Company to maximize current
productivity, partially offset by the slowdown resulting from the COVID-19 pandemic during the first quarter of the 2021 fiscal year. In addition,
the recovery rate improved to 83.5%, compared to 82.6% for the same period in 2020, which is in line with the Company’s target.
The iron ore head grade for the year ended March 31, 2021 was 30.7%, compared to 32.1% for the same period in 2020, attributable to different
sourcing pits.
During the year ended March 31, 2021, the Company produced 575,700 wmt of DR quality iron ore concentrate at an average of 67.7% Fe, with
an average combined silica and alumina content of 2.8%.
Bloom Lake achieved a record production with 8,001,200 wmt of Fe 66.4% high-grade iron ore concentrate produced during the year ended
March 31, 2021, compared to 7,903,700 wmt for the same period in 2020.
17 PageYou can also read