January & 2019 Outlook - EDWARD MEIR - ANDREW LEBOW - JIM COLBURN - The Opportunistic Traders
←
→
Page content transcription
If your browser does not render page correctly, please read the page content below
January & 2019 Outlook
    EDWARD MEIR - ANDREW LEBOW - JIM COLBURN
    Tel: • 1-203-656-1143 • Email: commresgroup@gmail.com •Web Site: COMMODITYRESEARCHGROUP.COM

Highlights for December/January: Commodities held out much promise at the beginning of 2018, as major economies
were all growing in a synchronized fashion. Encouraged by this state of affairs (this was before the tariff wars) analysts figured
that the Reuters-Jefferies commodities index would have a solid showing in 2018, building
on the strong rally that set in during the second half of 2017. For a while, commodities did
respond, pushing higher through May, but by the second half of the year – as we see in our                TABLE OF CONTENTS
chart below – the asset class fell apart to end the year sharply lower.
                                                                                                                                                                 Market Highlights / Outlook............. 1-6
The selloff in the index during December was particularly brutal (see the boxed-in area in                                                                       Energy ............................................... 7
red) and although we have recovered some ground in January, the index has yet to make                                                                            Energy, Coal, Ethanol ......... ............. ..8
up all the ground it lost. Much of the move in the index during the past six weeks was attrib-                                                                   Energy Prices vs. CFTC positions ...... .9
                                                                                                                                                                 LME Metals........................................ 10
utable to the incredible swings in oil and oil products. Early in 2018, oil was tipped by many
                                                                                                                                                                 LME Metals, Steel, Iron Ore .............. 11
analysts (although not by us) to top $100 a barrel, but instead it plunged by almost 40%                                                                         Precious Metals................................. 12
from its 2018 peak of $86.74 to end the year at just under $54/barrel. In December alone,                                                                        Currencies........................................... 13
crude prices sank by some 30% -- its worst monthly decline since the financial crisis. It then                                                                   Currencies, S&P-500, 10-Year Note....14
stitched together a series of gains towards the end of December and at one point traded up
10 days in a row, almost recovering what it had lost previously.
Within the commodity space -- and as we can see in our rankings chart on the next page -- cocoa ended 2018 with the stron-
gest gain, climbing almost 30%. However, its advance was partly attributable to an abysmal showing in 2017 where values
plunged to a six-year low and so a rebound of sorts was inevitable. Moreover, London cocoa benefited from a dramatic decline
in sterling. Elsewhere in the tropical group, sugar and coffee had diametrically opposite performances to cocoa, finishing down
roughly 19% on the year. In the grains space, wheat ended the year with an impressive 18% advance on strong demand for
US cargoes after suppliers in the Black Sea ran out of wheat, while Australia suffered from its second year of drought. Corn
had a good showing as well (up 7% on the year), but soybeans (-8%) was hit by the worsening U.S.-China trade war, which
fully blossomed in May/June, coinciding with the peak in that particular market (along with many others).

In the base metals space, zinc suffered the biggest decline within the LME group, off some 26%. Aluminum, lead and copper
all finished roughly 18%–19% lower, while nickel was off by 16%. Tin was the best performer in the group, down by only 2.7%
and is off to a roaring start so far this year. Despite recent weakness, Chinese steel prices had a positive finish in 2018, but
iron ore prices ended lower.

         Reuters-Jefferies CRB Index

         Source for Chart: Thomson-Reuters

Trading ranges mentioned in the above commentary are not an indicator of whether to buy, sell, or hold. CRG does not have a futures trading account. This material should be construed as market commentary,
merely observing economic, political and/or market conditions, and not intended to refer to any particular trading strategy, promotional element or quality of service provided by CRG. CRG is not responsible for any
redistribution of this material by third parties, or any trading decisions taken by persons not intended to view this material. Information contained herein was obtained from sources believed to be reliable, but is not
guaranteed as to its accuracy. These materials represent the opinions and viewpoints of the company and are not an offer to buy or sell any derivative. The information and data provided is not tradable and is for
indication-only purposes. Derivatives trading involves substantial risk of loss, and you should fully understand those risks prior to trading.
Market Overview – January and 2019 Outlook - page 2
In precious metals, gold silver and platinum all finished
lower on the year, but palladium bucked the trend with a
13% advance. The whole group had a far better showing
over the second half of the year, with gold now up some
11% since putting in an $1160 low back in August.
In the currency markets, the general dollar index fin-
ished higher over the course of 2018 -- not much of a sur- As we see in our rankings
prise here given that the Federal Reserve hiked rates four chart, there was very little
times in fairly rapid fashion just as most other central banks that was up (in blue) on
stayed dovish. the year as most markets
were in the red instead. In
fact, the number one in-
Finally, although it has been a stellar decade for US equity vestment last year across
markets, 2018 was the worst yearly showing for stocks various asset classes
since the financial crisis. The S&P 500 and Dow Jones was cash!
each ended down 6.2% and 5.6% respectively for the year,
while December itself was the worst monthly showing since
1931. Hedge funds did not fare any better; only 16 were
able to deliver positive returns (before fees) in 2018 from
a universe of 450 monitored by HSBC. Long/short funds
delivered an average loss of 6.8%, while activist funds lost
13.3%. Even trend-following commodity-trading advisors
were hurt, registering their worst performance in 16 years.
Incredibly, the best performing investment in 2018 was
cash.
So far this year, the US stock market has gotten off to an
impressive start, which brings us to our outlook for 2019
and a discussion of where various markets are headed Source for Data: Bloomberg
going into in the New Year: A few themes stand out:
Trade will remain a key sticking point: The US/Chinese trade relationship was arguably the most important theme for the mar-
kets this past year and we suspect this will remain the case going into 2019 as well. Right now, the two sides are at least talking,
having just completed three days of relatively low-level negotiations in Beijing. At that meeting, there were some modest conces-
sions Beijing threw Washington’s way, namely, allowing imports of genetically modified crops into China, green-lighting additional
imports of soybeans and lowering car tariffs, but these (with the exception of GM’s) were already in place previously and so were
not much of a concession. Another round of talks is proposed for later this month in Washington and this time, more senior offi-
cials, potentially including US trade Representative Bob Lighthizer and Chinese Vice Premier Liu He, will be involved. However,
we have serious reservations that a major breakthrough will be achieved, especially on some of the “structural” issues that the
US has concerns about, namely Chinese subsidies to favored industries, intellectual property protection, joint venture regulations
and ongoing manipulation of the Chinese currency, not to mention a host of other non-economic grievances. Even if progress is
made, monitoring and enforcing compliance will be a difficult proposition.
In the meantime, US pressure that has been brought to bear thus far on the Chinese is not generating the desired results; there
has practically been no “re-shoring” of manufacturing back to the US and if anything, US and non-US operations in China are
moving (or planning to move) to other Asian Rim countries. In addition, the Chinese trade surplus with the US continues to grow
on account of front-loading exports, coupled with the fact that the 10% levy on Chinese imports has been pretty much offset by a
roughly 7% depreciation in the yuan. We think the Chinese game plan will be to offer Washington more items the country is pre-
pared to buy (giving President Trump a “win” in a narrow sense) while on other issues, Beijing will offer grudging concessions and
string Washington along. At the end of the day, Beijing will simply wait President Trump out, knowing that he has two or four more
years at most (or possibly less). For its part, China is a controlled economy where its leader will be at the helm for life and where
economic plans are laid out decades ahead. (As an aside, we came across a very interesting article in the FT which we think out-
lines very well what the Chinese will and will not agree to; we publish it in its entirety on the next page).
As far as the upcoming talks in Washington are concerned, we think there will be enough progress to justify the postponement
of an additional round of 25% of US tariffs threatened on $267 billion of Chinese goods. Markets will undoubtedly greet this news
positively and we could see rather sharp moves higher in both global equities and base metals. However, we think the advances
will likely fade once it becomes apparent that there is still much more work to be done and that the ongoing damage to the world
economy in terms of reduced trade and investment, along with higher supply-side costs and inefficiencies, will persist for much
longer.
Trading ranges mentioned in the above commentary are not an indicator of whether to buy, sell, or hold. CRG does not have a futures trading account. This material should be construed as market commentary,
merely observing economic, political and/or market conditions, and not intended to refer to any particular trading strategy, promotional element or quality of service provided by CRG. CRG is not responsible for any
redistribution of this material by third parties, or any trading decisions taken by persons not intended to view this material. Information contained herein was obtained from sources believed to be reliable, but is not
guaranteed as to its accuracy. These materials represent the opinions and viewpoints of the company and are not an offer to buy or sell any derivative. The information and data provided is not tradable and is for
indication-only purposes. Derivatives trading involves substantial risk of loss, and you should fully understand those risks prior to trading.Market Overview – January and 2019 Outlook - page 3
Trade will cast a long shadow on global growth The Rhetoric is Changing but Xi Jinping is Staying the Course.
prospects. The logjam in the US-Chinese trade rela- (Written for the FT on 1/6/2019 by George Magnus, author of ‘Red Flags: Why Xi’s
tionship is showing up more forcefully in the latest Chi- China is in Jeopardy’).
nese trade numbers. Data out this past week showed
The year just ended was a hard one for Chinese president Xi Jinping, and 2019
a sharp drop in December exports, down some 4.4% looks no easier. He has had to acknowledge sudden and unusual domestic criti-
m-o-m (vs estimates of +3%). Imports slumped by cism of his two signature policies, the Belt and Road Initiative and Made in China
7.6% in December (consensus +5%) vs. the month 2025, and, seemingly, pulled back from both. The air is rich with speculation about
prior. Imports from the US fell by a whopping 36%, change. Whether this is about optics or substance, it will determine the outcome of
as China took in very little soybeans and other com- the trade war truce with the US and shape China’s economic prospects. Stung by
some bad publicity about Belt and Road financing, cancelled projects, and a new
modities. Chinese exports to other markets, includ- awareness of debt sustainability problems in a rising number of countries, China
ing Japan and the EU, also shrank, telling us that the has started thinking about alternative features. These include foreign direct invest-
US/China trade dispute is not impacting just these two ment, equity partnerships and co-financing with western official institutions.
countries, but is spreading. The trade tiff is hurting
A major flaw in Belt and Road as an alternative development strategy is its reliance
cross-border investment as well; foreign direct invest- on US dollar financing at a time when China’s financing capacity is being impaired
ment into China rose just .9% last year, down from by the emergence of a balance of payments deficit and external US dollar liabilities
7.9% in the previous year. Chinese investment into the that are not far short of two-thirds of China’s foreign currency reserves. Renminbi
US in 2018 has downright collapsed, off some 84% financing might be an option, but the currency is facing structural depreciation
y-o-y. If all this is somehow good for the long-term pressure, and its international role is strictly limited by capital controls.
China and US growth stories, we don’t see it. While a broad-based economic downturn is unfolding at home, Mr Xi’s bigger and
more immediate challenge is to try to stabilise trade and commercial relations with
This past month, we learned that Chinese private and the US. These issues have generated disquiet among some in the Communist
official PMI numbers contracted for the first time in party elite and intellectual critics. Some have warned that China’s approach to the
US, and industrial policy at home, is not compatible with fair trade and world peace,
two years in December. In addition, profits at indus- and is leading the country along a path towards confrontation.
trial firms fell sharply from a year earlier, while retail
sales increased at their weakest pace since 2003. Car China has already stepped up purchases of US agricultural and energy products,
sales are included in the retail numbers and these cut tariffs on 700 items, offered to shelve the punitive 25% tariff rate on US auto
were down sharply in both November and December, imports, proposed to scrap foreign ownership caps in some sectors and fast track
a new foreign investment law and begun a campaign to crack down on the infringe-
dragging 2018 car sales into an annual decline for the ment of intellectual property rights.
first time since 1990. Other retail indicators are also
off; Hong Kong jewelry sales are down, while furni- The main bone of contention, though, is the Made in China 2025 strategy. This
ture sales grew by 6% through November 2018, half seeks to upgrade 10 key high tech manufacturing sectors in which state-owned
enterprises and leading “private” companies have been urged to become more
the rate of the previous year. Growth in cosmetic sales self-reliant and set minimum market share targets of between 60%-90%. Western
are off by a third, while the number of overseas trips businesses and politicians have long argued that the strategy promotes unfair com-
by Chinese tourists stagnated in the 2nd half of 2018, petition, and financing, funding and regulations that discriminate in favour of state
down from the 15% growth seen in the first half. and state-linked companies, in which the party now has an increased operational
management role.
Beijing has announced steps to rev up the econ- For now, Made in China rhetoric has been dialled down, and was not even men-
omy and as we went out with this note indicated that tioned in recent policy instructions to local governments for 2019. Some senior
it will roll out yet another round of spending. It will policymakers acknowledge the strategy encourages waste and over-capacity, as
also put through two reserve requirement cuts this evidenced in electric vehicle batteries. There are suggestions of changes to pre-
vious policy targets and dates, and to rules governing opening up and technology
month. Previous initiatives have been similar, involving transfer in designated sectors. Foreign companies have heard these things before
ramped-up spending on infrastructure and decreases and will look for stronger assurances than they have had in the past.
in taxes, but all these programs fall well short of the
more aggressive stimulus we saw in 2015/16 and in The 40th anniversary of Deng Xiaoping’s opening up of the Chinese economy, and
2008/2009. We think the government is wary about the end-of-year Central Economic Work Conference last month, suggest that Mr
Xi is prepared to accede to change but not to anything that threatens China’s core
stimulating too much, since this will simply add more interests. He cannot risk caving in to US pressure. Foreign companies and SOEs
debt to an already highly leveraged economy. In fact, will still be required to buy and prioritise locally. Local governments and tech com-
Premier Li Keqiang said as much today, acknowl- panies are bound to support the security, innovation, and industrial transformation
edging that the government will not resort to flood- of the state. Industrial policy designed to boost China’s technological and mili-
tary capacity is not up for negotiation. Changes to intellectual property laws are
like stimulus despite the downward pressure the aimed more at small businesses rather than SOEs and big technology companies.
economy is facing. Chinese GDP estimates going Changes in foreign ownership caps and technology transfer will have to go some
into 2019 currently lie between 6.2%–6.5%, but pri- way for foreign companies to back away from reconsidering supply chain strate-
vate forecasts are significantly lower than that. In gies.
fact, the FT reported last month that a Chinese eco-
So, while we can anticipate some flexibility in the optics of Mr Xi’s negotiating
nomics professor sparked a minor uproar when he stance, no one really doubts that he is firmly in control, and remains committed to
claimed the government secretly estimated 2018 GDP both the Made in China and Belt and Road strategies, which are enshrined in the
to be only at 1.67%. Although his stunning claim was party’s constitution. The US and the West are going to have deal with the conse-
quickly removed from the internet, the presentation quences, whatever the trade talks yield. Far more substantive issues are likely to
remain unresolved, keeping tariff tensions high.
was viewed more than 1.2 mln times before it was
scrubbed.
Trading ranges mentioned in the above commentary are not an indicator of whether to buy, sell, or hold. CRG does not have a futures trading account. This material should be construed as market commentary,
merely observing economic, political and/or market conditions, and not intended to refer to any particular trading strategy, promotional element or quality of service provided by CRG. CRG is not responsible for any
redistribution of this material by third parties, or any trading decisions taken by persons not intended to view this material. Information contained herein was obtained from sources believed to be reliable, but is not
guaranteed as to its accuracy. These materials represent the opinions and viewpoints of the company and are not an offer to buy or sell any derivative. The information and data provided is not tradable and is for
indication-only purposes. Derivatives trading involves substantial risk of loss, and you should fully understand those risks prior to trading.Market Overview – January and 2019 Outlook - page 4
Outside of China, the numbers do not look that Global manufacturing PMIs
inspiring either. Japanese industrial output con- Index
63
tracted in November, while retail sales slowed World
sharply as well. Eurozone manufacturing activ- 61 US (Markit)
ity barely expanded last month, with final man- China (NBS)
Eurozone
ufacturing PMI falling for a fifth straight month 59
Japan
and at it’s lowest level since February 2016. 57 South Korea
Growth in Germany’s manufacturing sector
slowed noticeably, with new orders falling at 55
their fastest rate in four years. Manufacturing
53
growth in Spain neared a two-and-a-half year
low, while Italian and French PMI’s are both in 51
contraction territory.
49
Here in the US, ISM factory activity plunged 47
by a whopping 5.2 points to 54.1 last month,
hitting a two-year low amid a plunge in new 45
Source: Bloomberg
Jan-16 Jun-16 Nov-16 Apr-17 Sep-17 Feb-18 Jul-18 Dec-18
orders (down 11 points) and hiring (down 2.2
points). Housing sales remain slow and auto
sales seem to be flat-lining around the 17 mln Manufacturing PMIs (12-month change)
mark, with this year likely being down versus
last year. Capital spending by businesses has World -3
also declined sharply going into the New Year EM -0.5
versus the very strong pace set during the ASEAN -0.1
first half of 2018. One bright spot is the US US (Markit) -1.5
labor market, as surging job growth ensures China (NBS) 0.2
that consumer spending remains strong, China (Caixin) -1.8
although we are starting to see more lay- Eurozone -2.5
off announcements of late. Shorter term, the Japan 1.1
government shut-down is undoubtedly a big South Korea 0.8
negative and we are hearing Q1 GDP esti- India -1.5
mates being lowered by anywhere between Brazil 0.2
.5% –.7%.
-3.5 -3 -2.5 -2 -1.5 -1 -0.5 0 0.5 1 1.5
Our charts above and on top depicts the
two-year trend of PMI numbers and the one below that shows the year-over-year change. Both charts highlight the dete-
rioration in PMI manufacturing that have intensified over the past 12 months, especially in three of the largest global econ-
omies (the US, China and the Eurozone).
Interest rates; don’t look for a repeat of 2018 -- The Fed came out with a rather hawkish December policy statement
after it raised rates by another 25 basis points, alluding to “some further gradual” rate hikes. Moreover, it did not signal
any change in selling $50 billion clips of its massive bond portfolio. Equity investors headed for the exits in the wake of
the Fed’s statement and the resulting carnage was enough to prompt the central bank to stage a careful about-face in the
days ahead. In this regard, Fed Chair’s Jerome Powell remarked that the Fed would now be “patient” going forward and
that it will be “listening carefully” to the message from the markets. Crucially, Mr. Powell also backtracked on the Fed’s
balance sheet reductions and said that the central bank “wouldn’t hesitate” to change policy if needed. The speech fol-
lowed the release of the Fed minutes days later; these seemed to reassure the markets in that they did not come across
as hawkish as Powell’s December news conference. All this tea-leaf reading leaves us to conclude that the Fed will likely
raise rates at most one more time in 2019 (if that) and then enter into a prolonged pause so that it could evaluate the
impact. Readers should keep in mind that the four rate hikes put through in 2018 (and the five before that in prior years)
will take some time to work through the economy and so for the time being, the central bank has likely done enough.
“Known unknowns and unknown unknowns”. We have to suspect that one of the “known unknowns” this year (to
quote Defense Secretary Don Rumsfeld) will be how Britain exits out of EU. As we went out with this note, Prime Minister
May ssuffered an overwhelming defeat as Parliament voted against her deal with a 200+ vote majority. The government
will now have three weeks to set out a “plan of action”, including submitting a revised deal for yet another vote, moving
ahead with no deal, holding a second referendum, pushing for an extension of the March 29 deadline (all 28 countries
have to agree here), or hold a vote of no confidence, which should it pass, will lead to a general election. None of these
options hold much appeal. For now, we suspect that the March 29 deadline will likely be postponed to give both sides
more time to negotiate, while simultaneously allowing Britain to make additional preparations in case it has to exit without
a deal on its hands. We don’t see a second referendum taking place.
Trading ranges mentioned in the above commentary are not an indicator of whether to buy, sell, or hold. CRG does not have a futures trading account. This material should be construed as market commentary,
merely observing economic, political and/or market conditions, and not intended to refer to any particular trading strategy, promotional element or quality of service provided by CRG. CRG is not responsible for any
redistribution of this material by third parties, or any trading decisions taken by persons not intended to view this material. Information contained herein was obtained from sources believed to be reliable, but is not
guaranteed as to its accuracy. These materials represent the opinions and viewpoints of the company and are not an offer to buy or sell any derivative. The information and data provided is not tradable and is for
indication-only purposes. Derivatives trading involves substantial risk of loss, and you should fully understand those risks prior to trading.Market Overview – January and 2019 Outlook - page 5 We suspect that 2019 will also be the year when Robert Mueller’s report finally comes out, presumably sooner rather than later in the year. It is hard to say what it will say, but our view is that there likely will not be enough for formal impeachment charges to be levied against Mr. Trump and that even if there is, the President will likely survive a vote to remove him from office. Still, the drama will likely generate sharp market swings depending on how serious the charges turn out to be. Individual Market Outlooks For 2019: If our thesis of a gradually spreading global slowdown is correct, commodity ral- lies will likely be vulnerable in 2019. However, one variable to consider is that most markets have put in rather exagger- ated lows over the past month in anticipation of recession and so if these fears come close to being realized, these lows could be retested, but perhaps not broken. We are thinking of crude in particular where prices sank to a low of $50/barrel basis Brent only to snap back sharply over the past several days. We believe that Brent will stabilize going into 2019 and likely move higher in light of the OPEC cuts that take effect this quarter. We see total OPEC and non-OPEC production cuts during the 1H19 to be around 1.8 mbd, meaning that the market could be either balanced or in a slight deficit going into the first half of 2019, even accounting for lower demand growth. We expect to see Brent exceed $68 on the upside, while $50 should hold as a low. One wild card is the uncertainty around the Iranian sanction waivers program that cur- rently allows the country to export about 1.1 mbd of crude. These will expire in May and we will have to see how the mar- ket deals with that scenario. We should note though that the history of sanctions has not been a particularly auspicious one, as countries inevitably find ways around them. We are also positive on WTI for wholly different reasons. For one, a number of producers will (or already have) reduced capital budgets and there is also talk of reductions in unit well efficiencies in the Permian and Eagle Ford fields as well. But more importantly, it will become much easier to get the incremental US barrels to the export market in 2019. Last year, a dearth of pipeline space from West Texas to Cushing or Houston caused Permian crudes to trade at discounts as much as $20 below Houston, but as much as 2.3 mbd of pipeline capacity will be added on this year, theoretically reliev- ing stock build-ups that traditionally depress WTI valuations. We believe that the lows “are in” for WTI and believe that during the 1st half of the year, prices could get to a high of $60-$62/barrel. On diesel, we write in our summary that “there are many cross currents surrounding the diesel market this year, from uncertainties regarding demand growth to the International Maritome Organization (IMO) 2020 implementation standards” where refiners and shippers will spend much of 2019 preparing for a switch that could potentially add 1 million bpd to die- sel demand. On the whole, we are generally upbeat on diesel relative to both crude and gasoline. On gasoline, we are forecasting lower demand readings than the EIA and see refiners still producing too much of the product. Strong distillate demand has encouraged refiners to keep runs relatively high, adding to excessive supply. Gasoline will rally periodically this year in line with crude and will exhibit its usual seasonal strength, but expect it to be a weak sister in the petroleum complex and a continuing source of angst for refiners. Although natural gas lost substantial ground last month and came off from its November $5 highs, it still has the poten- tial of staging one more spike before the US winter is over, as we saw this past week. However, once we get to March and April, the combination of rising production, a replenishment of inventories and slowing industrial demand should keep prices within a relatively tame trading range going into the balance of the year. Moving on to base metals, we have updated developments in the complex since our extensive December 2019 out- look report and have made minor price adjustments to our 2019 forecasts. We continue to see low inventories, smelting bottlenecks, modest supply/demand deficits and relatively decent demand offering metals a measure of short-term sup- port, but it is the demand component that is most troubling. Given that the bulk of global nonferrous demand (50%-60%) comes from China, prices are singularly dependent on what goes on with that country’s economy. As China slows and as its export markets come under additional strain, we have to suspect that this will adversely impact metals offtake and tip many of the projected deficits we are expecting towards surplus, while replenishing depleted inventories. (The 300,000 ton build we have seen in LME aluminum stocks in December alone are an example of just how quickly stocks can build). We also think that base metals will be a growing casualty of the US-China trade war --- one that will remain messy, pro- tracted and an overall negative for metals demand. However, any downward price swing will not approach the 2015/2016 lows, as back then as we were swimming in stocks and the selling of excess inventories only exaggerated the price declines. As an aside, we have charted all the base metals physical premiums on page 13. We see gold doing better this year than it did in 2018; the precious metal should benefit from an environment of plateau- ing US interest rates, a leveling off in the dollar, wobbly US equity markets and renewed fund interest, especially if prices manage to bust through psychologically important $1300 resistance and makes a stab at testing the 2018 highs. Although silver should move higher with gold, it will be a relative laggard, as it will tend to shadow the more depressed base met- als group. We are somewhat positive on platinum as mine supply should turn lower after prolonged period of low prices. We frankly do not have a clear read on palladium; the complex continues to baffle us, making record highs and seem- ingly oblivious to a slowing global car market. For now, the complex is gripped by a serious supply shortage and so until that lifts, we may very well see even higher prices from here. Trading ranges mentioned in the above commentary are not an indicator of whether to buy, sell, or hold. CRG does not have a futures trading account. This material should be construed as market commentary, merely observing economic, political and/or market conditions, and not intended to refer to any particular trading strategy, promotional element or quality of service provided by CRG. CRG is not responsible for any redistribution of this material by third parties, or any trading decisions taken by persons not intended to view this material. Information contained herein was obtained from sources believed to be reliable, but is not guaranteed as to its accuracy. These materials represent the opinions and viewpoints of the company and are not an offer to buy or sell any derivative. The information and data provided is not tradable and is for indication-only purposes. Derivatives trading involves substantial risk of loss, and you should fully understand those risks prior to trading.
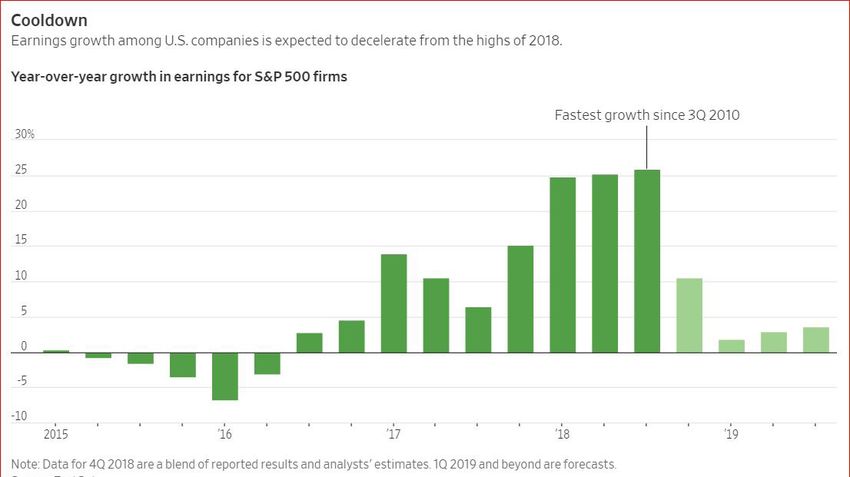
Market Overview – January and 2019 Outlook - page 6

  In the currency markets, we are slightly bearish on the dollar going into 2019 and see it being vulnerable to a Fed policy
  “rethink”. However, the likelihood of persisting trade tensions should prevent a significant drop in both the dollar and the
  yen, another trade safe-haven currency.

  We see US equity markets remaining very choppy in 2019 as we agreed that visibility with regard to corporate earn-
  ings remains quite poor amid the current environment. Right now, FactSet sees profits for the S&P 500 to be up by more
  than 11% in Q4, with numbers as high as 15% also being possible. But for the year as a whole, S&P 500 earnings are
  expected to be in the low single-digit range during the first three quarters of 2019 before climbing to 12% in Q4. (See our
  chart below) This should value the market at a forward PE of just under 15, below the five-year average of 16.4, but above
  the 10-year average of 14.6. With that being said that, at least one negative seems to have receded somewhat for equi-
  ties, namely that the Fed is not as ominous a presence as it was for much of 2018, which is why we are also looking for
  the ten-year yield to trade in rather restrained fashion, confined to a 2.2%-3.2% range.

  We present our individual summaries on the various markets in the pages that follow and welcome reader comments or
  questions.

Trading ranges mentioned in the above commentary are not an indicator of whether to buy, sell, or hold. CRG does not have a futures trading account. This material should be construed as market commentary,
merely observing economic, political and/or market conditions, and not intended to refer to any particular trading strategy, promotional element or quality of service provided by CRG. CRG is not responsible for any
redistribution of this material by third parties, or any trading decisions taken by persons not intended to view this material. Information contained herein was obtained from sources believed to be reliable, but is not
guaranteed as to its accuracy. These materials represent the opinions and viewpoints of the company and are not an offer to buy or sell any derivative. The information and data provided is not tradable and is for
indication-only purposes. Derivatives trading involves substantial risk of loss, and you should fully understand those risks prior to trading.
Tel: +1-203-656-1143 / web site: www.commodityresearchgroup.com
CRG MONTHLY COMMODITY ROUNDUP -JANUARY/2019 OUTLOOK
ENERGY - Page 7

BRENT NEARBY CONTINUATION                                                                                                                     BRENT CRUDE OIL        Last: 61.54                    01/11/19
Last year was yet another interesting year in the oil markets, as geopolitics, supply surges and concerns about global demand were
major factors influencing trade. For the year, Brent peaked at a four-year high of $86.74 in October before declining for the entire 4Q       90
to a low of $49.93 on December 26th. The average in 2018 was $70.98, up $16.86 on the year. This year is already shaping up to
be a fairly challenging one, with much of the year’s uncertainty again centered around the Iranian sanction waivers granted to eight
buyers of Iranian crude in November. We estimate that the waivers will allow Iran to export about 1.1 mbd of crude and expire in              80
early May. It is unclear whether the waivers will be extended, but it is clear that the market will be focusing on them in March and
April. So will OPEC, which scheduled its next meeting for April rather than its usual June date believing it may (or may not) have
more information on the waivers. In anticipation of the sanctions, OPEC increased production by as much as 0.8 mbd from May to
November of 2018. Non-OPEC producers increased output by 1.2 mbd in the same time frame. The production surge proved too                      70
much for the markets to bear and so OPEC plus Russia and other non-OPEC producers agreed to cut output by 1.2 mbd beginning
in January 2019, with OPEC shouldering 0.8 mbd of the cuts. We believe that owing to Saudi Arabia’s planned cuts of 1.0 mbd that
total OPEC production in 1H19 will be around 1.1 mbd lower than last quarter, or more than promised. Non-OPEC mandated cuts                   60
should average 0.7 mbd in 1Q19 (0.4 from OPEC+ as well as a 0.3 mbd curtailment from Canada) which translates into a 1.8 mbd
production cut. Even accounting for somewhat softer demand in 1H19 and growing US output (SEE WTI) we think the market will be
balanced to actually in deficit by 0.1 to 0.3 mbd for 1H19. This follows a 2H18 inventory growth of 0.3 to 0.4 mbd. Whether the
production cuts will be extended into 2H19 may depend on the waivers as well as of course, price. It is unlikely however, that the            50
Saudis will increase production again at the behest of the Trump administration. In fact, they have floated the idea in the press of
$80-$85 Brent as a near term price goal. Global demand growth for next year is projected at 1.4 mbd by the IEA,OPEC and the EIA.
We think that is probably too high, with 1.1 to 1.2 mbd growth more than likely owing to a potential slowdown in global economies.
Nevertheless, the 1.2 mbd number should still be enough to balance and perhaps draw down stocks. We think that the first half of
                                                                                                                                              40
the year will see the Brent market exceed $68 on the upside, while $50 should hold as a low*.                                                  Jan-17           Jul-17            Jan-18   Jul-18     Jan-19

WTI NEARBY CONTINUATION                                                                                                                       LIGHT CRUDE OIL        Last: 52.5                     01/11/19
WTI nearby futures traded in a wide range in 2018 with most of the volatility occurring in Q418. Prices peaked in October at $76.29 and       80
bottomed out in late December at $42.67. For the year, we averaged $64.75 or $14 above 2017. We expect the range in 2019 will be
narrower than 2018 while prices will average a few dollars below last year’s levels. The market spent a lot of time in 4Q18 worrying
about demand, when in fact, US demand was fairly robust last year and should still be solid in 2019. For the entire year, using revised
monthly data and raw weekly data, US demand grew by 0.6 mbd or 3% over year-ago levels. Petrochemical demand (mainly ethane)
as well as distillate demand were chiefly responsible for the growth. Owing to the commissioning of new ethylene crackers in late 2018        70
and into 2019, ethane demand should remain strong. Distillate demand will not be quite as robust as in 2018, but we still see 0.4 mbd
in total US demand growth for next year. This is far from what the markets were discounting while trading in the low $40 price range in
December. The market did fail to anticipate, however, the dynamic growth of US production in 2018. In its December 2017 issue of the
STEO, the EIA forecast that 2018 US production would average 10.0 mbd. One year later, the actual number was 10.9 mbd, meaning                60
the EIA missed it by almost 1.0 mbd. The EIA is currently forecasting 2019 US output at 12.1 mbd, or a 1.2 mbd increase following this
year’s 1.5 mbd growth. We think the EIA probably has it right this year as a number of producers will reduce or already have reduced
their capital budgets owing to lower prices. Furthermore, there has been talk of reductions in unit well efficiencies in the Permian and
Eagle Ford fields. As growing US production will have to offset the global output cuts (SEE BRENT) any shortfall in US production will
have very bullish implications. It will also become much easier though to get the incremental barrel to market in 2019. Last year the         50
dearth of pipeline space from West Texas to Cushing or Houston caused Permian crudes to trade at discounts as much as $20 below
Houston values. The IEA reports that in 2019 as much as 2.3 mbd of pipeline takeaway capacity will be added from West Texas. This
should theoretically allow for US crudes to be more easily available for export. Unfortunately, it is not clear whether build outs at Texas
and Louisiana ports will be ready to handle all the incremental export demand. Again, it will be vital to move US production to the
international market to prevent an unwanted domestic inventory build. Thus infrastructure will be a key theme for 2019 as was the case        40
last year. We think the lows are in for WTI and believe that the 1H could see a high around $60-$62*.                                          Jan-17           Jul-17            Jan-18   Jul-18     Jan-19

RBOB NEARBY CONTINUATION                                                                                                                      RBOB GASOLINE          Last: 142.57                   01/11/19
Gasoline traded in a wide range in 2018, peaking at 228.55 in May and making the low for the year in December at 124.50.
The average nearby price for gasoline was 191.30 vs last year’s 162.50. It appears that for the second year in a row, US                      250
gasoline demand declined on a y/y basis. Higher pump prices, better fleet efficiencies as older cars continue to be retired,
and a plateau in vehicle miles travelled, all contributed to slack demand for gasoline. There was also some demand dis-
placement by electric vehicles, but this was probably minimal. EV sales in US for 2018 were 240,000 vehicles vs 17.1
million internal combustion vehicles or 1.4% penetration. Globally there are well over 3 million EVs on the road but that                     210
compares to the 1.4 billion internal combustion vehicles. While EVs continue to make inroads, it won’t be into the 2020’s
where they will really start having a significant effect on gasoline demand. The EIA predicts that 2019 demand will be right
around unchanged from this years’ 9.31 mbd figure. We think, if anything, that may be too optimistic as other than a poten-
tial for lower pump prices, it does not appear as the major trends toward flattening to declining gasoline demand in the US                   170
will change much in 2019. This is problematic as refiners globally are producing too much gasoline. Strong distillate de-
mand (SEE DIESEL) has encouraged refiners to keep runs relatively high resulting in surplus gasoline. Furthermore, the
marginal global barrel is now US light sweet crude, which also tends to yield more gasoline than a sour crude barrel. The
gasoline surplus is becoming more apparent in US inventory data as supplies to begin the year were 248 mb barrels or 11                       130
mb above average and almost 2 days supply above normal. This is much too high and sets the stage for gasoline stocks to
perhaps challenge the recent inventory highs of 259 mb. One bright spot for US refiners has been exports. Chronic refinery
issues in Latin America led to record gasoline exports in 2018 of around 870,000 b/d vs 749,000 in 2017. US refiners will
need this rate of export growth to continue in 2019 to prevent an all out gasoline glut as US runs will remain high in 2019                    90
due to distillates. Gasoline will rally periodically this year in line with crude and will exhibit its usual seasonal strength, but
expect it to be a weak sister in the petroleum complex and a continuing source of angst for refiners.                                           Jan-17          Jul-17            Jan-18   Jul-18     Jan-19

HEATING OIL NEARBY CONTINUATION                                                                                                               HEATING OIL            Last: 190                      01/11/19
Diesel traded in quite a wide range in 2018, making its high at 245.00 in October before marking a low of 164.84 in December.
For the year, diesel prices averaged 209.23 vs 165.70 last year. US diesel demand in 2018 was robust, averaging 4.13 mbd vs                   250
3.93 mbd last year. A strong economy boosted consumption, particularly in the manufacturing and mining sector. Surging fossil
fuel production was a major contributor towards increased demand for trucking and of course, the fuel that powers them. A
slowdown for the global economy will undoubtedly affect diesel demand. The EIA is predicting that 2019 diesel demand will only                225
grow 50,000 b/d vs 2018’s number. We think this may be too low and would expect closer to 75,000 to 100,000 b/d growth
assuming normal winter weather in 1Q19. A key factor for diesel this year and next will be the implementation of new shipping                 200
fuel specifications as mandated by the International Maritime Organization (IMO). In 2020, shipping fleets must be powered by
lower sulfur marine gasoil (a middle distillate) as opposed to the high sulfur bunker fuel that had powered their fleets prior to
2020. Refiners and shippers will probably spend much of 2019 preparing for the switch. The impact of IMO 2020 cannot be                       175
underestimated as diesel demand could potentially increase by well over 1.0 mbd in order to meet the new requirements. It is
far from clear how readily refiners will be able to produce these added barrels and theoretically at least, distillates should com-
mand higher premiums to compensate refiners for producing it at the expense of bunker fuel. This should at once support                       150
overall refiner margins and be problematic for gasoline supplies (SEE GASOLINE). As far as US inventories are concerned, a
20 mb year-end distillate build dramatically softened the hard edges of a tightly supplied market. Stocks at the beginning of the             125
year totaled 140 mb, or 3.1 below last year and 12.4 below the four-year average. Days supply at 36.6 are now only 4 below
normal as opposed to as much 10 to 12 days supply below normal earlier in the year. Significantly though, Pad 1 stocks (US
Northeast) are probably still too low to support a weather-related demand surge. There are many cross currents surrounding the                100
diesel market this year, from uncertainties regarding demand growth to the IMO 2020 implementation. Ultimately of course,
diesel will trade in line with crude and at this point we expect that on balance in 2019 diesel will probably be stronger than crude            Jan-17          Jul-17            Jan-18   Jul-18     Jan-19
with the impending IMO 2020 a key factor..

* Trading ranges mentioned in the above commentary are not an indicator of whether to buy, sell or hold any of the contracts described therein. Commodity Research Group (CRG) does not have
a futures trading account. This material should be construed as market commentary, merely observing economic, political and/or market conditions and is not intended to refer or recommend any
particular trading strategy, promotional point of view or quality of service provided by CRG. CRG is not responsible for any redistribution of this material by unauthorized third parties or any trading
decisions taken by persons either intentionally or unintentionally viewing this material. Information contained herein was obtained from sources believed to be reliable, but is not guaranteed as to
its accuracy. Write-ups represent the opinions and viewpoints of the company and are not an offer to buy or sell any futures contract or derivative. Information and data provided should not be
used for trading purposes and is for indication purposes only. Derivatives trading involves substantial and/or total risk of loss and you should fully understand these risks prior to trading.
Tel: +1-203-656-1143 / web site: www.commodityresearchgroup.com
CRG MONTHLY COMMODITY ROUNDUP - JANUARY/2019 OUTLOOK
ENERGY, COAL ÐANOL - Page 8
NATURAL GAS NEARBY CONTINUATION NATURAL GAS Last: 3.016 01/11/19
Its been generally one-way for natural gas (basically south) ever since early December, as prices have rolled back all
their recent gains. The complex did stage a bit of a bounce this past week to the $3.50 level, but values are still well
below nearly $5 mark set back in mid-November. We were relatively upbeat on nat gas heading into December consider- 4.9
ing how depleted inventories were and so the complex’s subsequent price collapse was surprising. However, the warmer
-than-expected temperatures that blanketed much of the Northeast in December and January no doubt deflated the
bullish build-up. In this respect, Reuters reports that cumulative heating demand for the 2018/19 heating season was 6% 4.4
higher than the long-run average through December 12th, but that unusually warm weather triggered a sharp demand
decline — sending usage to about 4% below normal. The fall in gas prices was also due to wild swings in fund positions.
Reuters reports that funds were net buyers of futures and options equivalent to 2.229 bcf of gas between late July and 3.9
mid-November, the biggest bullish imbalance since at least 2010. But going into December, as temperatures became
milder, funds turned net sellers and although we don’t have the more recent numbers yet on account of the government
shut-down, we suspect that this is indeed the case. Meanwhile, the latest EIA numbers show that working gas stocks are 3.4
at 2.614 bcf, about 8% less than last year and 18% below the five-year average. While these figures could still trigger a
late-winter rally in upcoming weeks if the weather turns colder (as we have just seen), the upside could be limited given
that stocks have built somewhat since November. Moreover, government forecasts now show average or above-average 2.9
temperatures expected across the US over the next three months, unlike the colder temps we were seeing in November.
Looking towards the rest of 2019, we cannot get too excited about gas prospects given our call for a slowing US econo-
my. In addition, the EIA sees continued strong growth in gas production in 2019, a trend that should replenish depleted
inventories. The EIA is forecasting a spot price of $3.11/MMBtu for the year, 6 cents below 2018 levels, as it sees pro-
2.4
duction soaring to an average of 90.0 Bcf/d next year, well above this year’s level of 83.3 bcf/d. Jan-17 Jul-17 Jan-18 Jul-18 Jan-19
CRACK SPREADS CRACK SPREADS 01/11/19
March diesel cracks have rallied over $3 from their year-end lows to trade over $27 at press time. Tight inventories Gasoline Heating oil
in Pad 1 as well in Northwest Europe have contributed to the recent rally in this spread. Rising inventories at 32
Cushing as well as forecasts for colder weather across the Northern Hemisphere were also factors in the move
higher. We would expect that diesel cracks should maintain their upward momentum over the next few weeks and
that owing to IMO 2020 (SEE DIESEL) cracks should be well supported this year. Pad 1 diesel stocks remain too 27
low at 43.1 mb on Jan 4 relative to average levels of 55 mb for that date. In Europe, ARA gasoil stocks are low as
well, at 2.1 million tons vs average levels of 2.95 million tons. While the price arbitrage between NY and Europe
has widened enough to attract additional cargoes its unlikely to be enough to meet any demand surge for heating 22
fuel in light of expected colder weather throughout January. We would not be surprised to see the March USLD
crack approach $30 before its expiry later in February. March gasoline cracks really are the polar opposite to
diesel cracks as they been under significant pressure owing to a growing global surplus of gasoline supply (SEE 17
GASOLINE). At press time, this winter grade gasoline crack is trading around 7.50; gasoline against Brent futures
is trading at negative 75 cents. Europe is particularly burdened as ARA gasoline supply is 1.37 million tons vs. a
normal early January level of 1.05 million tons. In the US Pad 1 stocks are actually just about average at 63.5 12
million barrels vs the 4-year average of 62.7. Surely any rally in NYH gasoline will attract European supply of
gasoline and or components should the arbitrage open wide enough. We think 2019 is going to be very problemat-
ic for gasoline cracks. Undoubtedly, there will be seasonal rallies for traders to look toward, but at present there 7
are too many structural issues to overcome to really forecast sustained full out rallies in this spread. Contribution Jul-17 Jan-18 Jul-18 Jan-19
from Andrew Lebow at CRG.
COAL Newcastle Coal Last: 97.85 01/11/19
Chinese coking coal futures jumped to their highest levels in some nearly 15 months in
early December, boosted by tighter supply on account of safety checks at coal mines by 130
China’s coal mine safety watchdog. In addition, the authorities in Beijing have told coal
120
traders and utilities that they want imports for 2018 to be similar to the 279 million tons
imported in 2017. This is likely going to be a challenge since customs data showed im-
110
ports for the first 10 months of the year already running at 252 million tons, up 11% from
the same period in 2017. As a result, a big import drop-off is expected in November and 100
December, which may be why non-Chinese origin prices (i.e., from Indonesia and Aus-
tralia) are both experiencing some weakness of late. Meanwhile, Indonesia's 2018 coal 90
production stood at 528 million tons, up from 461 million tons in 2017, this according to
data from the country's Energy Ministry. Realized output surpassed the ministry's pro- 80
duction target of 507 million tons after the government raised coal output quotas. Indo-
nesia’s coal production is projected to reach around 480 million tons in 2019. 70
Jan-17 Jul-17 Jan-18 Jul-18 Jan-19
ETHANOL Ethanol Last: 1.27 01/11/19
Ethanol values have firmed in recent weeks, supported by a slowdown in produc-
tion. Due to depressed profitability margins, production has declined 6.5% since early 1.7
December. The four-week average production rate is running 2.3% behind previous 1.65
year's levels. Ethanol crush margins have improved as of late, but continue to show neg- 1.6
ative profitability — the general theme since September. Margins are typically strong in 1.55
Q2. Ethanol is experiencing the seasonal downturn in demand. Therefore, despite less 1.5
output, stocks are stable with less demand offsetting production declines. Current stock
1.45
levels are at 976 mg, or +2.4% greater than a year ago. More importantly, in a bearish
sense, the Days of Supply (four-week average) reading is at 23.27 versus 21.76 last 1.4
year. Exports have been steady, but growth is needed in order for prices to firm a great 1.35
deal more. Without China as an US ethanol import player, prices are confined will likely 1.3
be confined to a $1.20 to $1.40 trading range this year. Contribution by Mike Blackford in 1.25
Des Moines. 1.2
Jan-17 Jul-17 Jan-18 Jul-18 Jan-19
* Trading ranges mentioned in the above commentary are not an indicator of whether to buy, sell or hold any of the contracts described therein. Commodity Research Group (CRG) does not have
a futures trading account. This material should be construed as market commentary, merely observing economic, political and/or market conditions and is not intended to refer or recommend any
particular trading strategy, promotional point of view or quality of service provided by CRG. CRG is not responsible for any redistribution of this material by unauthorized third parties or any trading
decisions taken by persons either intentionally or unintentionally viewing this material. Information contained herein was obtained from sources believed to be reliable, but is not guaranteed as to
its accuracy. Write-ups represent the opinions and viewpoints of the company and are not an offer to buy or sell any futures contract or derivative. Information and data provided should not be
used for trading purposes and is for indication purposes only. Derivatives trading involves substantial and/or total risk of loss and you should fully understand these risks prior to trading.Page 9
Crude Prices v/s CFTC positions Gasoline prices v/s CFTC positions
Heating Oil prices v/s CFTC positions Natural gas prices v/s CFTC positions
Source for Charts: BloombergTel: +1-203-656-1143 / web site: www.commodityresearchgroup.com
CRG MONTHLY COMMODITY ROUNDUP - JANUARY/2019 OUTLOOK
LME BASE METALS - Page 10
COPPER COPPER Last: 5930 01/11/19
Copper traded roughly within a $600/ton range between early December to mid-January, with prices fluctuating
between $5725–$6352. Values came within $75 of hitting our 2019 forecast low of $5650 on the 3rd of January, but
7500
we have recovered slightly since then. No doubt, the more optimistic tone generated by the recently concluded US/
Chinese trade talks have helped stabilize copper of late, although growing macro weakness in China will likely keep
a more significant rally in check. To wit, the latest Chinese PMI numbers (both the official and private readings) 7000
have dipped into contraction territory for the first time in years. We should note that these readings correlate quite
significantly with copper prices, perhaps better than almost any other indicator we have seen. Meanwhile, the latest
ICSG numbers has the global refined copper market in a 595,000-ton deficit through September of last year com- 6500
pared with a 226,000-ton-deficit in the same period a year earlier. We find the ICSG’s deficit reading to be exces-
sively high and expect the 2018 number to fall from where the ICSG has it once the year is complete. In other key
developments, Chile's copper production recovered nicely in 2018, increasing 6% y-t-d through November. Given 6000
that China has been reducing its scrap imports considerably for much of the past two years, we suspect that Chile-
an refined units will find a ready home going into China as substitute material for scrap and so the increase in
Chilean production should readily be absorbed. (We should note that the scrap that China is importing is higher 5500
quality, so the country is still getting relatively high copper content). China imported 4.87 mln tons of unwrought
copper in the first eleven months of 2018, an increase of 14.9% from a year earlier; ores and conc imports reached
18.25 million year-to-date through November, up 16.4% year-on-year. Pricewise, we put out a $5650-$7220*/ton 5000
2019 forecast range in our LME outlook report for copper, but would likely shave that range by $100 a ton on either
side in view of the global macro slowdown we suspect will accelerate over the course of 2019. Jan-17 Jul-17 Jan-18 Jul-18 Jan-19
ALUMINUM ALUMINUM Last: 1861 01/11/19
Since our last report in early December, prices have been under pressure, sinking to a low of $1785/ton at one point, only
$65 away from the $1720 low we forecast in our 2019 LME outlook. Several factors were behind the Dec/Jan sell-off, the first 2600
being a rapid rise in LME stockpiles; these rose from roughly 1 mln tons in mid-December to just under 1.3 mln tons as of this
week. Secondly, the US/China trade spat, volatile US equity markets and concerns about slowing growth all seem to have hit 2500
the metals group hard in December. Although prices have recovered going into the New Year, the bounce feels tentative.
Meanwhile, the Rusal situation remains unresolved. Last month, the US Treasury announced that it planned to remove
2400
sanctions against Rusal following corporate and governance changes that were supposed to take place in companies con- 2300
trolled by Oleg Deripaska. (Deripaska himself will remain sanctioned). Although this scenario was to some extent discounted
by the markets, prices nevertheless fell on the news only to recover shortly afterwards. Prices advanced further after Demo- 2200
crats in the US Senate attempted to block any agreement the US Treasury was considering putting in place pending further
clarification from Treasury Secretary Mnuchin. Those hearings took place last week, but we did not see much come out of
2100
them. Ultimately, we suspect the sanctions will be lifted, as the company is an integral part of the US/European supply chain 2000
and politicians will eventually see it that way as well. What seems to be weighing on the market more these days, is the
uncertainty generated by the US/Chinese trade dispute and slowing global growth, discussed at length in our introduction. 1900
Elsewhere, Chinese producers said in early December that they will cut 800,000 tons of smelting capacity in coming months.
Antaike said operating pressure on smelters is "reaching the extreme limit" and calculates that the Chinese have so far
1800
closed more than 3.2 million tons of capacity in 2018, about 80% of that in the second-half of the year alone. It is interesting 1700
to note that despite these cuts, ali prices have continued to head lower during the 2nd half of the year, telling us that overall
supply still is comfortable. Our 2019 aluminum forecast presented in early December was $1720–$2330*, but we would 1600
revise it down slightly to $1680-$2280 to intake into account the recent deterioration we have seen in the global picture. Jan-17 Jul-17 Jan-18 Jul-18 Jan-19
ZINC ZINC Last: 2461 01/11/19
Zinc traded roughly within a $300/ton range between $2350–$2650 from early December through to mid-January, pretty
much following the trajectory of most other metals. The low was put in early in January and we have seen a nice bounce off
that mark since then, as optimism about the Chinese trade talks, a weaker dollar and increased conviction that the Fed 3800
may pause in its rate trajectory going into next yea all helped prices recover. However, LME stocks have increased by
roughly 20,000 tons from the early December lows, while the buildup in Shanghai during the same period of time is about
10,000 tons. These increases have kept the zinc rebound somewhat in check and may also partly explain why the cash-to- 3400
three's backwardation has shrank dramatically of late. In addition, nearby concentrate supply seems to be plentiful, reflect-
ed by the fact that Chinese zinc smelter treatment charges have surged to $180 a metric ton as of early January, the
highest since 2015. (We have heard even higher numbers than that). This will likely incentivize more refined metal to 3000
eventually come out, although we have to see this happening in China’s December figures where output was down m/m.
Meanwhile, Glencore said last month that it sees its its production rising by 28% between 2018 and 2021, while in 2019, it
sees output reaching 1.2 million tons, about 100,000 tons more than 2018 levels. Even China could see its output rebound 2600
after dipping last year; Antaike notes that in 2018, China's production plunged by its biggest amount (4.6%) since 2013
amid tighter raw material supply, longer maintenance periods and the relocation of the country's top zinc facility (the Zhu-
zhou Smelter) to another part of the country. We likely will not see these same factors play out again. As a result, zinc 2200
supply should improve in 2019 (just as demand slips a bit) and consequently, deficits this year should be much less com-
pared to what we saw in 2018. We are looking for a 150,000 deficit for 2019, about 130,000 tons less than what we called
for in 2018. For its part, the ILZSG has zinc in a 301,000 ton shortfall through the first 10 months of 2018, but the Group 1800
sees a 72,000 ton shortfall for this year. CRU has the market in a balance in 2019, banking on a surge in 2nd half produc-
tion. We put out a $2150–$3210* price forecast for zinc in our 2019 outlook, but would tighten that band to $2200-$3100.* Jan-17 Jul-17 Jan-18 Jul-18 Jan-19
LEAD LEAD Last: 1976 01/11/19
Lead traded between $1876-$2116 from early December to mid-January and actually
held up much better than any of the other metals in that it managed to preserve a more 2700
or less sideways range during this period. In fact, values were actually up some 2.3% 2600
over the course of December in sharp contrast to the downswing we saw in most other 2500
metals. From January to October of 2018, the ILZSG has the lead market in a deficit of
177,000 tons compared to a deficit of 94,000 tons in the same period a year earlier. Total 2400
refined metal stocks stood at 403,100 tons at the end of October 2018, down slightly 2300
from 413,100 tons at the end of September. Meanwhile, Glencore said in December that 2200
it expected its lead production to rise 30% between 2018 and 2021. It has 2018 lead
2100
production reaching between 280,000 tons and 290,000 tons, while 2019 output should
land somewhere between 335,000 and 355,000 tons. We forecast lead prices to trade 2000
between $1680–$2350* during 2019 in our latest LME report, but would tweak that band 1900
$50/ton higher on either side. 1800
Jan-17 Jul-17 Jan-18 Jul-18 Jan-19
* Trading ranges mentioned in the above commentary are not an indicator of whether to buy, sell or hold any of the contracts described therein. Commodity Research Group (CRG) does not have
a futures trading account. This material should be construed as market commentary, merely observing economic, political and/or market conditions and is not intended to refer or recommend any
particular trading strategy, promotional point of view or quality of service provided by CRG. CRG is not responsible for any redistribution of this material by unauthorized third parties or any trading
decisions taken by persons either intentionally or unintentionally viewing this material. Information contained herein was obtained from sources believed to be reliable, but is not guaranteed as to
its accuracy. Write-ups represent the opinions and viewpoints of the company and are not an offer to buy or sell any futures contract or derivative. Information and data provided should not be
used for trading purposes and is for indication purposes only. Derivatives trading involves substantial and/or total risk of loss and you should fully understand these risks prior to trading.You can also read