Mapping of National School
←
→
Page content transcription
If your browser does not render page correctly, please read the page content below

JRC SCIENCE AND POLICY REPORTS

        National School
Mapping of
      Food Policies across the EU28
             plus Norway and Switzerland

                 Stefan Storcksdieck genannt Bonsmann,
                 Therese Kardakis, Jan Wollgast,
                 Michael Nelson, Sandra Caldeira
                 2014

                                                 Report EUR 26651 EN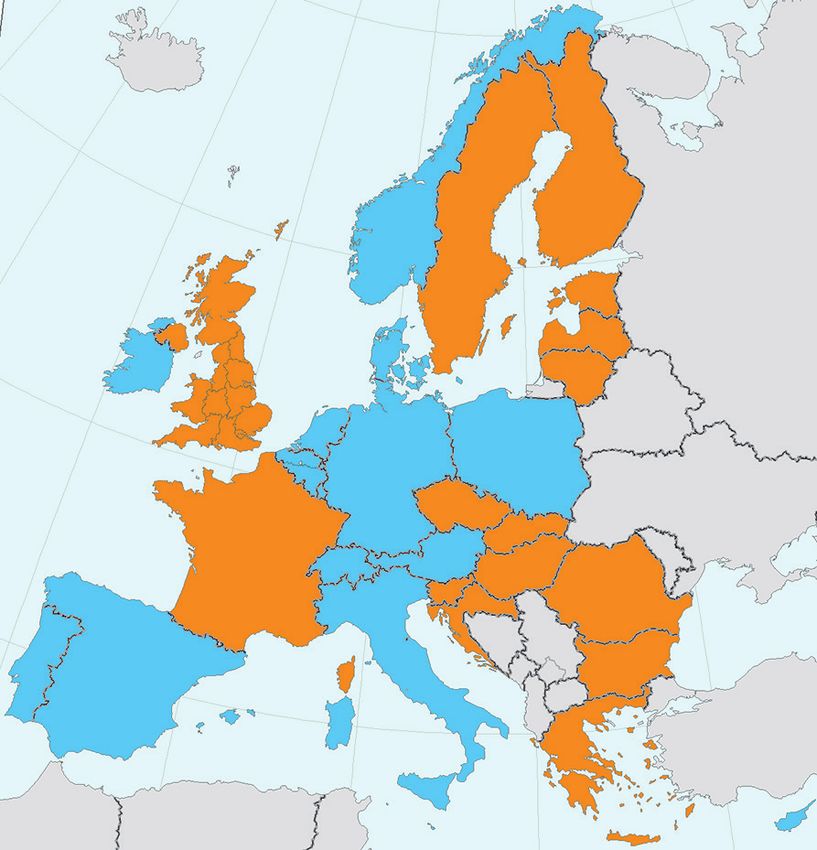
European Commission
Joint Research Centre
Institute for Health and Consumer Protection (IHCP)

Contact information
Sandra Caldeira
Address: Joint Research Centre, IHCP, Public Health Policy Support, Via Enrico Fermi 2749, TP 127, 21027 Ispra (VA), Italy
E-mail: sandra.caldeira@ec.europa.eu
Tel.: +39 0332 78 3887
Fax: +39 0332 78 9059

http://ihcp.jrc.ec.europa.eu/
https://ec.europa.eu/jrc/

This publication is a Science and Policy Report by the Joint Research Centre of the European Commission.

Legal Notice
This publication is a Science and Policy Report by the Joint Research Centre, the European Commission’s in-house science
service. It aims to provide evidence-based scientific support to the European policy-making process. The scientific output
expressed does not imply a policy position of the European Commission. Neither the European Commission nor any person
acting on behalf of the Commission is responsible for the use which might be made of this publication.

JRC 90452

EUR 26651 EN

ISBN 978-92-79-38402-8 (print)
ISBN 978-92-79-38401-1 (pdf)

ISSN 1018-5593 (print)
ISSN 1831-9424 (online)

doi:10.2788/82233 (print)
doi:10.2788/8214 (online)

Luxembourg: Publications Office of the European Union, 2014

© European Union, 2014

Reproduction is authorised provided the source is acknowledged.
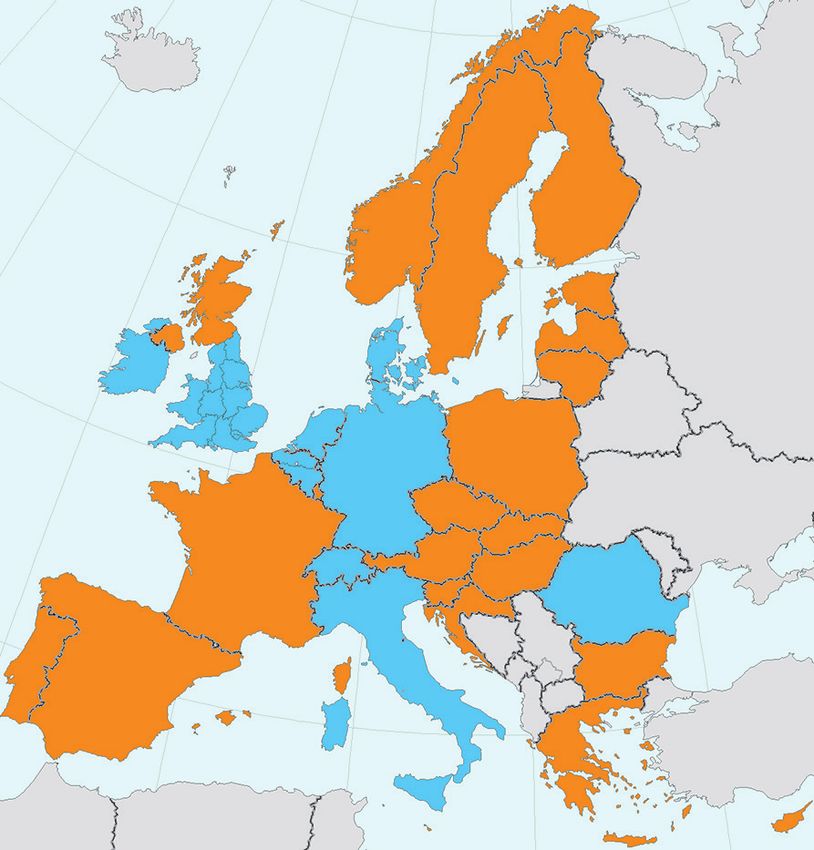
Table of Contents

Preface                                                                                  3

List of abbreviations                                                                   4

Executive summary                                                                        5
  The aim of this report                                                                 5
  Analysis of European National School Food Policies (SFP)                               5

Introduction                                                                             7

Methodology                                                                             10
  1. Policy search strategy and verification                                            10
  2. Data extraction and verification                                                   11
  3. Data analysis and visualisation                                                    11

School food policies in the EU28 plus Norway and Switzerland                            12
  1. Organisation of school food policy across Europe                                   12
  2. Types and focus of school food standards                                           14

Concluding remarks                                                                      21

Annex I: Origins and development of SNIPE                                               23
Annex II: SNIPE questionnaire                                                           26
Annex III: Overview of food- and nutrient-based standards as predefined in SNIPE        30
Annex IV: Hyperlinks to school food policy documents by country                         38
Annex V: Hyperlinks to pre-school food policy documents by country                      40

Author contributions                                                                    42
Acknowledgements                                                                        42

                                                                  Table of Contents |    1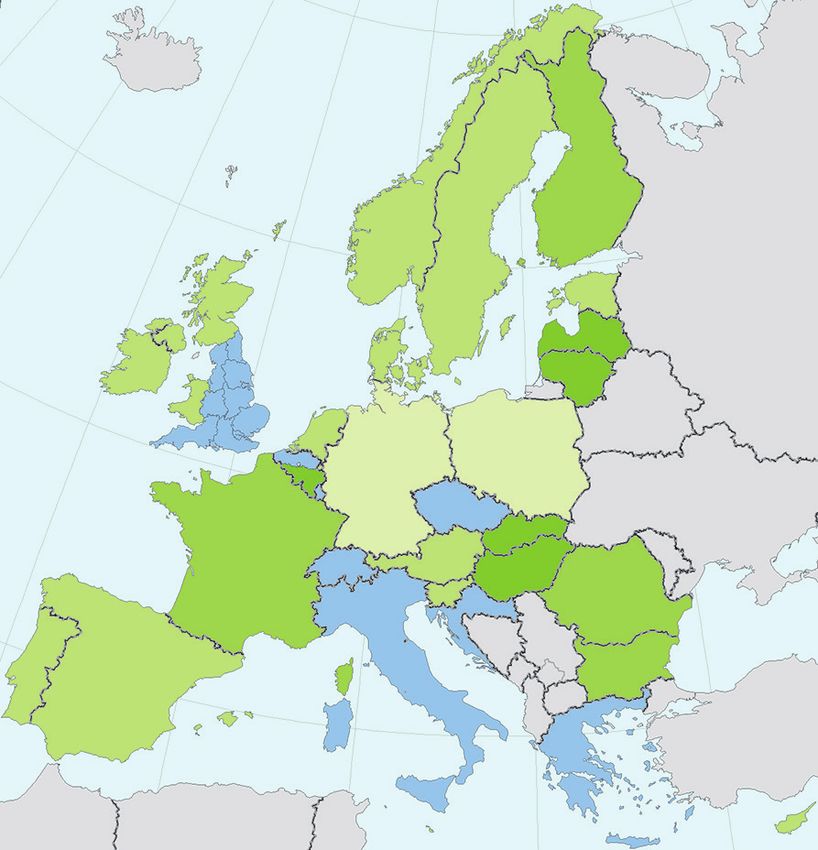
Preface

Pressing issue of childhood obesity                                       What the JRC is doing to help

A proper diet is vital for good health. The fact                          The Joint Research Centre (JRC), as the
that dietary factors nowadays claim more lives                            European Commission’s in-house science
in Europe and beyond than any other factors                               service, has started activities in the area of
shows there is a clear need for action. 1 Rising                          nutrition and public health, with one par-
overweight and obesity in all age groups across                           ticular focus on childhood obesity. In close
Europe is particularly worrying. To respond                               collaboration with DG SANCO, the JRC
to these threats to public health, the Euro-                              will draw on its experience in public health
pean Commission’s Directorate-General for                                 policy support, its independence of private
Health and Consumers (DG SANCO) has                                       and commercial interests as well as its net-
devised a Strategy on Nutrition, Overweight                               working and collaboration capacities to fa-
and Obesity-related health issues, 2 and put in                           cilitate and drive improvements in school
place the multi-stakeholder Platform for Ac-                              food policy development, implementation,
tion on Diet, Physical Activity and Health 3                              monitoring, and evaluation. Improvements
and the High Level Group (HLG) on Nutri-                                  in these domains shall help children adopt
tion and Physical Activity 4 as implementa-                               healthy diet and lifestyle habits while allow-
tion tools. Furthermore, in February 2014, EU                             ing significant strides towards reducing the
Member States adopted an EU Action Plan                                   burden of childhood obesity in Europe.
on Childhood Obesity for the period 2014-
2020, 5 and in May 2014, the WHO’s Director-                              Why this report?
General has established a high-level Commis-
sion on Ending Childhood Obesity. 6                                       The present report is the result of specific
                                                                          scientific support requested by the HLG
1. S.S. Lim et al.: ‘A comparative risk assessment of burden of           related to its work on childhood obesity. It
disease and injury attributable to 67 risk factors and risk factor        focuses on school food policies as a way to
clusters in 21 regions, 1990-2010: a systematic analysis for the Global   establish protected environments in which
Burden of Disease Study 2010’, The Lancet, 380: 9859 (2012), pp. 2224-
2260. http://dx.doi.org/10.1016/S0140-6736(12)61766-8.                    school children can learn about and experi-
2. http://ec.europa.eu/health/archive/ph_determinants/life_style          ence core principles of healthy eating and
/nutrition/documents/nutrition_wp_en.pdf.                                 drinking. The report summarises nutrition-
3. http://ec.europa.eu/health/nutrition_physical_activity/platform
/index_en.htm.                                                            related content of national school food poli-
4. http://ec.europa.eu/health/nutrition_physical_activity/high_           cies across the EU28 plus Norway and Swit-
level_group/index_en.htm.                                                 zerland in a systematic manner and provides
5. http://ec.europa.eu/health/nutrition_physical_activity/docs/
childhoodobesity_actionplan_2014_2020_en.pdf.                             quick access to corresponding source docu-
6. http://www.who.int/dietphysicalactivity/end-childhood-obesity/en/.     ments. This overview is descriptive, i.e. it

                                                                                                           Preface   |   3
does not allow any inferences on the actual thus provide a baseline from which to study implementation of the various school food policy impact and effectiveness (including policies or the degree to which they have the development of suitable indicators). succeeded or not in reaching the stated ob- jectives. It is our hope that this report serves Providing tasty and nutritious school food at least a two-fold purpose: 1) to facilitate requires strong commitment by a multitude the sharing of knowledge and experiences in of stakeholders. But if done right, the time school food policy development and imple- and money we spend on it today will reward mentation among policy makers and educa- us with social, economic, and health gains tors; and 2) to inform researchers of the sta- many times the initial investment. tus quo in European school food policy and List of abbreviations BE Belgium DG SANCO Directorate General for Health and Consumers DIETS Dietitians Improving Education and Training Standards HLG High Level Group on Nutrition and Physical Activity JRC Joint Research Centre MS Member States NOPA WHO database on Nutrition, Obesity and Physical Activity SFP School Food Policy/Policies SHE Schools for Health in Europe SNIPE School Nutrition Index of Programme Effectiveness UK United Kingdom WHO World Health Organization 4 | Mapping of National School Food Policies across the EU28 plus Norway and Switzerland
Executive summary
This report deals with national school food Analysis of European National
policies across the EU28 plus Norway and School Food Policies (SFP)
Switzerland. In the face of a growing obesity
epidemic among European children, the Euro The key findings are:
pean Commission, the World Health Organ- • All 30 countries have a SFP in place; 34
ization (WHO) and the UN have launched SFP documents (Belgium has separate
strategies on nutrition-, overweight- and policies for Flanders and Wallonia and
obesity-related health issues. Many Member the UK has separate policies for England,
States have also developed national action Northern Ireland, Scotland and Wales).
plans on food, nutrition and physical activ- • There is an almost even split between vol-
ity. As the development of eating and physi- untary guidelines and obligatory stand-
cal activity habits occurs during the early ards across the 34 SFP considered.
stages of life, the various national and EU • Despite differences in history and extent
level policy documents have identified the of providing food at school, the primary
school setting as a promising target for in- SFP aims are common to most MS: to
tervention. Furthermore, in 2006, the WHO improve child nutrition (97% of all poli-
Europe published a guidance paper to sup- cies), to teach healthy diet and lifestyle
port the development of school nutrition habits (94%), and to reduce or prevent
programmes in the European Region. childhood obesity (88%).
• Not all SFP consider evaluation: 59% de-
The aim of this report fine outcome measures, the top five being
food provision in school (56%), take up
This report aims to inform public health of school meals (35%), nutrition of chil-
policy makers, educators and researchers dren (29%), food consumption at school
about the current European school food (24%), and financial viability of services
policy landscape. It does so by systemati- (15%).
cally assessing the nutrition-related content • Most SFP ( > 90%) employ food-based
of the most recent school food policy for standards to ensure balanced menus;
each of the 28 EU Member States (MS) plus this is followed by portion size guidance
Norway and Switzerland, highlighting vari- (76 %) and nutrient-based standards for
ous options intended to promote healthier lunch (68%) and other mealtimes (56%).
school food environments to achieve given • Lunch and snacks appear as the most
objectives, and providing quick access to the common focus at almost 90% of SFP.
relevant source documents. • 65-82% of SFP set restrictions on bever-
ages available or recommended to school
Executive summary | 5children, the majority supporting (free) keting of foods and drinks high in sugar,
access to fresh drinking water and spe- fat or salt; 17 SFP specifying generic mar-
cifically limiting or banning (sugar-sweet- keting restrictions; and five SFP setting
ened) soft drinks. restrictions for both.
• Sweet treats and savoury snacks are re-
stricted in 59-79% of SFP, ranging from In summary, all 28 EU Member States as
being allowed occasionally to complete well as Norway and Switzerland acknowl-
bans. edge the important contribution of school
• Energy and fat intakes are the most com- food to child health and development by
monly referred to items in energy/nutri- providing either voluntary guidelines or
ent-based standards for lunch at 65% and mandatory regulations of what foods and
59%, respectively. drinks may/should be served in the school
• Vending machine offers are restricted in setting. This descriptive survey of European
53% of SFP; measures reach from (more) school food policies can help policy mak-
healthful options being recommended/ ers facilitate exchange of experiences and
promoted, to offers being in line with support researchers in assessing impact on
healthy eating guidance/standards, to public health.
(certain) unhealthful foods/drinks not al-
lowed in vending machines, to vending In producing this comprehensive overview
machines not existing on or being banned of school food policies in Europe, the JRC,
from school premises. DG SANCO and MS have worked together
• 65% of SFP stipulate training require- to meet the needs of European policy mak-
ments of school catering staff. ers and public health researchers alike.
• Food marketing limitations apply in 76%
of SFP, with four SFP restricting the mar-
6 | Mapping of National School Food Policies across the EU28 plus Norway and SwitzerlandIntroduction
All children deserve an environment that the European Commission has established
supports the formation of healthy dietary a coherent and comprehensive Community
and lifestyle habits for optimal growth and Strategy to address the ever more prevalent
long-term wellbeing. Worryingly, Europe is issue of overweight and obesity by adopt-
facing rising figures for childhood over- ing the White Paper A Strategy on Nutrition,
weight/obesity–one in three children aged Overweight, and Obesity-related health issues in
6-9 years was overweight/obese in 2010 com- 2007 (hereafter referred to as the ‘Strategy’). 8
pared to one in four children of the same In addition, the EU High Level Group (HLG)
age in 2008. 7 This is paralleled by persisting on Nutrition and Physical Activity has re-
deficiencies in critical micronutrients among cently drawn up an Action Plan to address
sizable fractions of children in both the 28 the issue of overweight and obesity in chil-
Member States of the European Union (EU) dren and young people, the EU Action Plan
and other European countries. These condi- on Childhood Obesity 2014-2020. 12
tions acutely put children’s health in jeop-
ardy and also increase their risk for chronic Since healthy eating and physical activity
diseases such as type 2 diabetes, cardiovascu- habits form during the early stages of life,
lar disease, and certain types of cancer later the school setting is seen as a promising tar-
in life. 8 On these grounds, urgent improve- get for intervention. Measures may include
ments to the status quo are needed. nutrition and physical activity education as
well as tailored food provision for optimal
Acknowledging the severity of the issue, the child growth and development; dedicated
European Commission (EC), the World policies can be used to guide their imple-
Health Organization (WHO), and the United mentation, monitoring and evaluation. Ini
Nations (UN) have all issued strategic docu- tiatives such as the Schools for Health in
ments on nutrition-, overweight- and obe- Europe (SHE) Network are testimony to
sity-related health issues. 8,9, 10,11 In particular, the relevance of schools as a place to learn
healthy diet and lifestyle habits. 13
7. WHO European Childhood Obesity Surveillance Initiative
(COSI), rounds 2008 and 2010. In 2006, the WHO Europe published a
8. http://ec.europa.eu/health/archive/ph_determinants/life_style guidance paper to support the development
/nutrition/documents/nutrition_wp_en.pdf.
9. WHO Global Strategy on Diet, Physical Activity and Health.
10. UN Political Declaration of the High-level Meeting of the 12. DG SANCO website, Public Health section, Key documents: EU
General Assembly on the Prevention and Control of Non-com- Action Plan on Childhood Obesity 2014-2020. http://ec.europa.eu
municable Diseases. /health/nutrition_physical_activity/docs/childhoodobesity_action
11. http://www.euro.who.int/__data/assets/pdf_file/0005/193253/ plan_2014_2020_en.pdf.
CONSENSUS-Vienna-Declaration-5-July-2013.pdf. 13. http://www.schools-for-health.eu/she-network.
Introduction | 7of school nutrition programmes in the Euro Specialised educational curricula, trained
pean Region.14 This policy development tool teachers, supportive school policies, a for-
outlines twelve steps to healthy eating for mal physical education programme, healthy
children and adolescents (Table 1). These food and beverage options, and a parental/
steps are usefully borne in mind when look- family aspect are included in the most prom-
ing at the food and nutrition standards or ising approaches. 15,16 Also of likely benefit
guidelines laid down in national school food are school garden programmes, including nu-
policies across Europe. trition and gardening education and hands-
on gardening experiences, as well as fresh
The scientific evidence supports multicom- fruit and vegetable programmes that provide
ponent interventions in school focused on free fruits and vegetables to students during
improving both diet and physical activity. the school day. Recent research furthermore
Table 1. Twelve steps to healthy eating for children and adolescents (adapted from WHO 2006 14).
1. A balanced and adequate diet should be based on a variety of foods predominantly of vegetable origin.
2. Several portions of whole grain bread, grains, pasta, or rice or potatoes should be included every day.
3. A variety of vegetables and fruits should be eaten, preferably fresh and local, several times a day.
4. Fish, poultry or lean meat are interesting alternatives. Meat with higher fat content and processed meat products
should be substantially limited. A good combination of beans, legumes, lentils occasionally can be a good
replacement for meat or fish.
5. Low-fat milk and low-fat, low-salt dairy products (kefir, sour milk, yoghurt and cheese) are preferable.
6. Fat intake should be limited to not more than 30% of daily energy, and most saturated fats should be replaced
with unsaturated options. Cooking fats should be reduced and adequately chosen.
7. Foods that are low in sugar should be preferred, sucrose should only be used sporadically, and sugary drinks
and sweets should only be consumed exceptionally.
8. A low-salt diet is best. Total daily salt intake should be limited to 2 g in children although it can increase
proportionately to energy intake as children grow older. Iodised salt should be used when there is a known
problem with iodine status.
9. Food should be prepared in a safe and hygienic way. Steaming, baking, boiling, or microwaving helps to reduce
the amount of added fat.
10. Young children should be introduced to food handling and cooking processes and encouraged to join in food
preparation safely, whenever possible. Older children and adolescents should also learn about the preparation
of food and cooking processes. All age groups should learn the importance of a healthy diet.
11. The benefits of breastfeeding should be explained to children and adolescents.
12. Children and adolescents should learn to enjoy physical activity and reduce time spent passively on TV, video
and computer games as well as other sedentary activities. When possible they should be provided with
opportunities to walk or cycle to school.
14. WHO (2006) Food and nutrition policy for schools. 16. A. Martin et al.: Lifestyle intervention for improving school achieve-
15. D. Mozaffarian et al.: ‘Population Approaches to Improve ment in overweight or obese children and adolescents, The Cochrane Li-
Diet, Physical Activity, and Smoking Habits. A Scientific State- brary, 14 Mar 2014. http://dx.doi.org/10.1002/14651858.CD009728.
ment from the American Heart Association’, Circulation, 126 pub2.
(2012), pp. 1514-63. 17. WHO (2006) Food and nutrition policy for schools, p. 24
8 | Mapping of National School Food Policies across the EU28 plus Norway and Switzerlandsuggests that dietary intakes in school chil- map of the different national school food
dren can be improved by presenting the policies. Such an overview allows policy
more desirable food choices at school in an makers to learn from one another and in
attractive and accessible way.18 doing so move towards best practice in a
setting of widely differing cultures. At the
As scientific support to the HLG and to get same time, this map will help researchers in
a clear picture as to what school-based meas- investigating potential links between school
ures for better diet and lifestyle education food policies and public health, thus giving
are seen as relevant in Europe, the JRC took an indication of the possible impact of such
on the challenge of producing a detailed strategies.
18. A.S. Hanks, D.R. Just, B. Wansink: ‘Smarter Lunchrooms Can
Address New School Lunchroom Guidelines and Childhood Obe-
sity’, J Pediatr, 162(4) (2013), pp. 867 - 69.
Introduction | 9Methodology
1. Policy search strategy and verification Youth). In some cases, notifications from
Member States to the European Commis-
To identify the school food policies in place sion gave insight into the school food policy
in the EU (initially EU27, later EU28 19) as situation.
well as Norway and Switzerland, we applied
the tiered search strategy described below: Step 3–Scientific literature and reports.
The third source was scientific literature,
Step 1 –WHO European Database on Nutri- which we searched via Pubmed and Google
tion, Obesity and Physical Activity (NOPA). 20 Scholar.21,22 References to school food poli-
The NOPA database is a searchable online cy documents were exploited. Additionally,
repository of corresponding policy docu- the Implementation progress report of the
ments and developments in the countries of Strategy for Europe on nutrition, overweight
the WHO European Region. On the NOPA and obesity related health issues 23 as well as
website, we selected the 30 countries speci- a report 24 by the UK Children’s Food Trust
fied above and restricted the search to ‘Nu- included relevant information from several
trition related’ and ‘Obesity related’. The Member States.
list of results was checked for mentions of
school food policies and any respective links Step 4–Professional contacts. Where Steps
used to access source documents. 1 to 3 did not yield sufficiently useful results
and in case of need for language support, we
Step 2–National ministerial websites and sought the help of contacts with knowledge
Notifications from Member States to the EC. of the respective national situation (e.g., di-
For countries for which NOPA did not hold eticians of the Thematic Network DIETS/
a link to or made no mention of school food DIETS2 25).
policy in the first place, we checked the web-
sites of the national ministries commonly The validity of all source documents identi-
responsible for school food policy (e.g., fied with the above strategy was confirmed by
Health, Education, Nutrition, Agriculture, representatives of each MS, i.e. HLG mem-
21. http://www.ncbi.nlm.nih.gov/pubmed.
19. EU28: Austria, Belgium, Bulgaria, Croatia, Cyprus, Czech 22. http://scholar.google.de/schhp?hl=en.
Republic, Denmark, Estonia, Finland, France, Germany, Greece, 23. http://ec.europa.eu/health/nutrition_physical_activity/docs/
Hungary, Ireland, Italy, Latvia, Lithuania, Luxembourg, Malta, implementation_report_en.pdf.
Netherlands, Poland, Portugal, Romania, Slovakia, Slovenia, 24. http://www.childrensfoodtrust.org.uk/assets/research-reports/
Spain, Sweden, United Kingdom. cft_uk_school_food_comparison.pdf.
20. http://data.euro.who.int/nopa/. 25. http://www.thematicnetworkdietetics.eu.
10 | Mapping of National School Food Policies across the EU28 plus Norway and Switzerlandbers checked policy references and pointed The final data matrix consists of 34 columns
to other and additional sources where ap- to represent the policies identified for the 30
propriate. countries considered. Belgium has separate
policies for Flanders and Wallonia, and the
2. Data extraction and verification UK has separate policies for England, Wales,
Scotland and Northern Ireland; hence the
To extract the policy content in a system- total of 34 policies. The semi-open question-
atic and comparable way, we used a subset naire contains 20 questions with a number
of the SNIPE 26 questionnaire developed by of pre-specified answers, resulting in 148
Public Health Nutrition Research Ltd, UK rows to complete per policy. Apart from the
(see Annex I for a summary of the develop- pre-specified answers, there often also was
ment of SNIPE). Where necessary, Google an option labelled ‘Other’ to include further
Translate was used to translate source texts information in an open-ended format.
into English before extracting relevant con-
tent items. All country data were reviewed by the re-
spective HLG contact, and the final data
The questionnaire template was set up in analysed as described below. The total data
Microsoft Excel®, version 14. The feasibil- collection process lasted from May 2013 to
ity of the questionnaire and the template February 2014.
for data collection were tested in a pilot
trial where the data from six different school 3. Data analysis and visualisation
food policies were extracted. The analysis of
the pilot results and their discussion led to Frequency percentages were calculated and
a revision of the questionnaire (see Annex II visualised directly from the data matrix in
for the final questionnaire version). Excel®, using the total number of 34 policies
as the reference point. Colour-coded Euro-
pean maps were created using the Eurostat
Intranet tool IMAGE.
26. School Nutrition Index of Programme Effectiveness.
Methodology | 11School food policies in the EU28
plus Norway and Switzerland
Our survey shows that all 30 countries 27 have separate policies (Fig. 1). Some SFP are only
mandatory regulations or voluntary guid- mentioned within other policies, namely
ance on school food in place. Documents for obesity, education, and health inequali-
vary from defined lists of foods (dis-)al- ties, and some of the separate SFP are also
lowed for sale on school premises to exten- referred to in these other policies. Addition-
sive guidelines or standards that, among ally, in more than half of the cases (56%),
others, specify school menu planning, pro- SFP are mentioned in national action plans
curement of catering services, staff training, broadly addressing nutrition, physical activ-
kitchen and dining facilities, and marketing ity and (child) health; other health educa-
restrictions (see Annex III for quick refer- tion programmes; or corresponding legal
ence to food- and nutrient-based standards documents (data not shown).
by country). The year of publication of the
most recent school food policy ranges from 100%
2003 to 2014 (see Annex IV and Annex V for 80%
hyperlink(s) to school and pre-school food 60% 65%
policy sources, respectively). In 82% of cases,
40%
the same or complementary policies also
cover food provision in pre-school settings 20% 26% 24%
15%
or corresponding age groups (not discussed 0%
y y y y
further). The following sections provide more polic polic polic polic
p a rate b e sity c a t ion a l i ties
Se in o in ed
u equ
detail on the types of school food policy in ded ded h in
Inclu n c l u n h ealt
I i
ded
Europe as well as the different recommen- Inclu
dations or standards laid out in them.
Figure 1. School food policy organisation in the EU28
plus Norway and Switzerland (n=34). Percentages do not
1. Organisation of school food policy sum to 100% as some separate policies may be further
across Europe embedded in other policies.
School food policies (SFP) can be organ- Given that SFP commonly address aspects
ised in various ways, the most prominent of of both health and education, it is not sur-
which are that they either constitute a sepa- prising that the corresponding ministries
rate policy or are embedded in other poli- either alone or in unison are the major re-
cies such as for health or education. Across sponsible bodies for developing the policies
Europe, two thirds of SFP are established as (Fig. 2). However, other combinations of
two or more ministries have also been en-
27. EU28 plus Norway and Switzerland. countered.
12 | Mapping of National School Food Policies across the EU28 plus Norway and Switzerland3% Combination
of ministries
Health
18% Education
Agriculture
47%
29%
Figure 2. Ministries primarily responsible for developing
school food policies in the EU28 plus Norway
and Switzerland (n =34).
Out of the 34 SFP analysed, 18 set mandatory Figure 3. School food policy bindingness across the EU28
standards and 16 offer voluntary guidelines plus Norway and Switzerland (n=34); orange=policy
for school food (Fig. 3). At a country level, mandatory, blue=policy voluntary.
the balance is even (15 vs. 15); Belgium has
voluntary SFP in both its provinces (Flan- stated or implied objective, and half of the
ders and Wallonia) whereas the UK has man SFP intend to tackle inequalities in health
datory SFP in all four constituent countries. or improve attainment. To a lesser extent
One reason for not having mandatory na- (< 30 %), SFP aim to: i) support parents, the
tional standards is that school food may be local community, agriculture and economy;
in the hands of autonomous regions (e.g. and ii) improve school attendance (data not
the federal states in Germany). On the other shown).
hand, some positive experiences have been
reported with mandatory policies in that the
100%
legal framework can promote more reliable 97% 94%
80% 88%
reporting on pre-defined indicators.
60% 65%
Objectives of the policies 53% 50%
40%
20%
The most frequent designated objective of
0%
current SFP is to improve child nutrition ion abit
s
esit
y
ritio
n litie
s
men
t
nutrit t hy h n t ob lnut e qua t tain
(Fig. 4). This is closely followed by the aim child rn h
e a l
/ pre
v e
nt m a
lth i n
rove
a
rove Lea uce reve hea Imp
Imp Red u ce / p a ckle
to make children learn healthy diet and life- Re d T
style habits, and the wish to reduce or ideal- Figure 4. Designated objectives of school food policies
ly prevent obesity. In two thirds of SFP, the in the EU28 plus Norway and Switzerland (n=34);
reduction or prevention of malnutrition is a only mentions above 50% of policies.
School food policies in the EU28 plus Norway and Switzerland | 13Evaluation criteria pupils and their parents in the planning of
menus and giving them the chance to pro-
Out of the 34 SFP, about three quarters (74%) vide feedback on the food services. Generic
specify one or more measures for outcome control of compliance with legal require-
evaluation. Food provision in school is most ments and food hygiene is also explicitly
frequently used at slightly more than half of mentioned by some countries.
all policies (Fig. 5), followed by measuring
school food take up and the nutrition of 2. Types and focus of school
children; the latter is assessed based on cri- food standards
teria such as total food consumption, nutri-
ent intake, child growth, and obesity levels. This section describes in more detail the
Food consumption at school and the finan- actual content of the school food policies.
cial viability of services complete the top five Where possible, emphasis is given to stand-
mentions. Other outcome measures speci- ards and recommendations that relate to
fied in two or more policies are: the engage- areas for action in the newly adopted EU Ac-
ment of local farmers (12%); a reduction in tion Plan on Childhood Obesity 2014-2020.28
health inequalities (6%); and the support of These are in particular: i) ‘Promote healthier
local economy (6%). Some countries focus environments, especially in schools and pre-
particularly on the social aspect of dining schools’; ii) ‘Make the healthy option the
at school, ensuring that pupils have enough easier option’; and iii) ‘Restrict marketing
time to eat (20-30 min, where specified) and and advertising to children’.
can do so in a pleasant atmosphere with the
support of teachers, trained kitchen staff As school days vary in length and organi-
and fellow students. This involves including sation across the 30 countries considered,
the corresponding SFP differ in the meal-
times covered. Lunch and snacks appear as
the most common focus at almost 90% of
100%
SFP, followed by breakfast specifications set
80% in two thirds and dinner in about half of
60% SFP (Fig. 6). Several countries actually rule
56%
40% or recommend that all food (and beverages)
35% available on school premises should comply
20% 29% 24%
15% with specified standards.
0%
l eals ren ool ices
choo ol m child t sch serv
o n at s c h o n o f o n a o f
ovis
i fs ritio ump
ti ility
d pr up o Nut viab
Foo Take o d cons a n cial
Fo Fin
28. DG SANCO website, Public Health section, Key docu-
Figure 5. Outcome measures of school food policies ments: EU Action Plan on Childhood Obesity 2014 - 2020. http://
in the EU28 plus Norway and Switzerland (n =34); ec.europa.eu/health/nutrition_physical_activity/docs/childhood
top 5 mentions. obesity_actionplan_2014_2020_en.pdf.
14 | Mapping of National School Food Policies across the EU28 plus Norway and Switzerland100% ing, is attractively decorated (e.g. plants, pic-
80% 88% 88% tures, table decoration), has easy-to-clean
60%
floors and furniture, and ideally offers 1.4-
65%
1.7 m2 of space per customer. Similarly, Mal-
40% 47%
ta suggests bright murals with a food theme,
20% new tables and chairs, and background mu-
0% sic. Various SFP generically state that dining
ch cks t er
Lun Sna kfas Dinn facilities should support the educational ex-
Brea
Figure 6. Meals covered in school food policies perience related to food, hygiene and health
across the EU28 plus Norway and Switzerland (n =34). and provide opportunities for social interac-
tion and development.
The vast majority of SFP (> 90%) define or
guide school meal composition at the level Recipes are included in 47% of SFP, and
of foods and food groups, be it for lunch around 40% address kitchen facilities/equip-
or other mealtimes (Fig. 7). This is followed ment (41%), procurement practices (38%),
by the provision of age-appropriate portion and food arrangement/presentation (38%).
sizes in three quarters of SFP, and nutrient- In this context, Austria, for example, recom-
based standards for lunch in two thirds. Still mends that a minimum of 10 pieces of fruit
more than half of all SFP specify nutrient- (at least 3 different types) are on display in
based standards for mealtimes other than every break, and the Maltese SFP proposes
lunch, and they consider catering practices, posters promoting healthy eating with pic-
staff training as well as dining spaces and fa- tures of fruit and vegetables as well as new
cilities. As regards the latter, Germany for menu boards with clear information and
example recommends that the dining room prices. Flanders emphasises that in vend-
is bright-coloured and has appropriate light- ing machines, a balanced selection of drinks
100%
94% 91%
80%
76%
60% 68%
56% 56% 53% 53%
40%
20%
0%
s s es s s s g ces
ard ard siz ard ard ice inin
nd unch nd unch n nd unch nd unch act ra spalities
t
s -la t a
s rl rtio t a
s rl t a
s -l g p r ff t g
in ci
sed non sed fo Po sed fo sed on rin Sta Din nd fa
d -ba for d -ba t - ba t - ba for n C ate a
n n
Foo Foo trie trie
Nu Nu
Figure 7. Common types of guidance or standard across school food policies in the EU28 plus Norway and Switzerland
(n=34); only mentions above 50 %.
School food policies in the EU28 plus Norway and Switzerland | 15(including water, milk, and fruit juices) and Table 2. Frequency of food-based standards across school
snacks (including fruit, high-fibre biscuits, food policies in the EU28 plus Norway and Switzerland
(n=34); n/a=not applicable. Also see Annex III.
and dairy) should be available and the nutri-
tionally more favourable options promoted
Food-based standards For lunch For other
through lower price or more access points. mealtimes
Drinks limited to specific types 82% 82%
Food recovery/wastage features in 26%, a F&V provision 79% 68%
reference to minimum or appropriate staff- Fresh drinking water 79% 68%
ing levels in 24%, and specifications of food Soft drinks restricted 71% 65%
contact materials in 21% of SFP. Sweet treats restricted 68% 79%
Frequency of serving dairy 65% n/a
Specific dietary requirements (e.g. due to
(Deep-)fried /processed 65% 65%
religious/cultural/ethical constraints, food products restricted
allergies or intolerances), local and seasonal Salt provision restricted 65% 53%
sourcing of (organic) foods, hygiene and Frequency of serving non- 59% n/a
safety aspects, and giving children enough meat /non-dairy protein
time to eat (20-30 min, where specified) are Frequency of serving (oily) fish 59% n/a
mentioned repeatedly in addition to the Crisps /savoury snacks 59% 74%
restricted
pre-specified answers (data not shown).
Frequency of serving (red) 53% n/a
meat
Food-based standards
Starchy food cooked in fat /oil 53% 53%
restricted
Among the food-based standards speci-
fied for lunch and other mealtimes (Table 2
and Annex III (Tables III.1 and III.2)), the As for the frequency of providing certain
restriction of certain beverages (mainly soft foods or food groups for lunch, dairy prod-
drinks) features most prominently. Most ucts are mentioned most often, followed by
SFP also foresee the provision of fruit and non-meat/non-dairy protein sources, (oily)
vegetables (F&V) and (free) access to fresh fish, and (red) meat. In the particular case
drinking water throughout the day. Further- of dairy products, the frequency or portion
more, many SFP restrict the use of salt (in size occasionally is guided by a set amount
food preparation and/or at the table) as well of calcium to be provided.
as the availability of sweet treats and (deep-)
fried/processed food products. Whereas re- Several SFP recommend or require choosing
strictions on starchy food cooked in fat/oil low-fat products and modes of food prepa-
in general appear in about half of all SFP, ration, sometimes specifying the type of oil
crisps/savoury snacks in particular are not or fat (not) to be used. Whole grain alterna-
allowed in well over half of SFP (especially tives are explicitly referred to in various SFP
for mealtimes other than lunch). (e.g. BE-Flanders, Bulgaria, Croatia, Ireland,
16 | Mapping of National School Food Policies across the EU28 plus Norway and SwitzerlandSpain, Switzerland), and limiting or avoid- Restrictions of sweet treats (chocolate, con-
ing food additives is seen as important in fectionery, cakes, biscuits, etc.) span from
SFP including those of BE-Wallonia, Croa- voluntary recommendations not to offer
tia, Latvia, Lithuania, and UK-England. sweets (e.g. Norway, Spain) to pre-defined
binding lists of allowed sweets (e.g. Cyprus,
Some countries (France, Germany, Hunga- Greece) to complete prohibition (e.g. Eng-
ry, Italy, and BE-Flanders) organise school land, Sweden). The same holds for crisps
food provision along menu cycles, e.g. by and other savoury snacks.
defining different dishes to cover a period
of 20 days. Energy/nutrient-based standards
There is large variation between SFP as to Standards for energy and nutrients are ex-
how the food-based standards are phrased. plicitly cited less frequently in SFP than
For example, whereas some countries sim- food-based standards, although the com-
ply request that fruit and vegetables be position of meals and menus is likely to be
served daily or a certain number of times per guided at least in part by their nutritional
week, many others detail (age-appropriate) contribution. Reference points for energy
amounts and how they should be integrated and fat content of foods or meals are speci-
in the (lunch) menu (soup, salad, dessert, fied most often for both lunch and other
etc.). Of note, more emphasis is given to mealtimes, followed by protein for lunch
vegetables than to fruit. and sugars for other mealtimes (Table 3, and
Annex III (Tables III.3 and III.4)). The other
As regards the restriction of soft drinks pre-specified nutrients are mentioned in 32-
(e.g. sugar-sweetened, artificially sweetened, 47% of SFP for lunch and in 21 -32% of SFP
squash), this ranges from considering them for other mealtimes.
acceptable occasionally (e.g. Wallonia, Swit-
zerland) to their complete prohibition (e.g. Where present, the energy-based standards
Hungary, Romania). In turn, the recom- commonly define that lunch should provide
mended or allowed beverages commonly around a third of a child’s daily energy
comprise water, unsweetened tea, (low-fat) needs. Denmark specifies recommendations
milk and (diluted) fruit juice. Caffeinated for a small and a big meal. The small meal
and alcoholic beverages are explicitly pro- (ages 7-10 years) should provide 1800-2100 kJ,
hibited or restricted to certain age groups whereas the big meal (ages 11-15 years) should
in some SFP, e.g. Austria, Belgium, Czech contain 2200-2500 kJ; additionally, there are
Republic, Hungary, and Latvia. To facilitate recipes covering 185 different meals containing
the healthy choice, Luxembourg recom- the right amount of energy and nutrients. The
mends making water cheaper than sugared Czech SFP points out that in schools with a
drinks and phasing out all sugary drinks dis- strong emphasis on physical activity, energy
tributors. intake references can be increased by 30%.
School food policies in the EU28 plus Norway and Switzerland | 17Table 3. Frequency of energy/ nutrient-based standards Table 4. Vending machine standards/guidance in school
across school food policies in the EU28 plus Norway and food policies across the EU28 plus Norway and Switzer-
Switzerland (n =34). Also see Annex III. land; countries not listed do not refer to vending machines
in their SFP.
Nutrient-based standards For lunch For other
mealtimes Vending machine policy Country
Energy 65% 44% Vending machines don’t Cyprus, Denmark, France,
exist on or are banned Malta,* Slovakia,** Slovenia
Fat 59% 44%
from school premises
Protein 50% 26%
(Certain) unhealthful Bulgaria, Hungary, Latvia,
Total carbohydrates 47% 32% foods/drinks not allowed Lithuania
in vending machines
Iron 44% 24%
Vending machine offer in Austria, Netherlands,
Calcium 44% 26%
line with healthy eating Portugal, UK-Scotland,
Vitamin C 44% 29% guidance/standards UK-Wales
Fibre 44% 24% (More) healthful options BE-Flanders,*** Italy, Spain
recommended, promoted
Sugars 41% 35%
Sodium 41% 24% * banned in all public and most private schools; ** ban specific
to vending machines offering sweets; *** balanced options should
Folate 38% 29%
be cheaper or more widely available.
Saturated fat 38% 26%
Zinc 32% 21%
Vitamin A 32% 21% nia), ‘added sugars’ (e.g. BE-Wallonia, Bul-
garia), ‘free sugars’ (e.g. Czech Republic), or
just ‘sugar’ (e.g. Hungary, Slovenia). Where
SFP tend to agree on 25-35% of daily calories specified, commonly a maximum of 10 %
from fat as the appropriate reference point. (Poland: 10-12%) of total daily energy from
Poland and the Czech Republic are exam- such sugars is set.
ples of SFP according to which animal fat
explicitly is to be limited and preference to Where SFP go beyond the prompted list
be given to vegetable fat, respectively. For (Table 3), they mostly make reference to na-
saturated fat, some SFP (e.g. Croatia, Es- tional nutrient intake recommendations.
tonia, Finland) set an intake limit of max. Of note, several countries (e.g. Bulgaria, BE-
10 % of daily calories, whereas Italy uses Wallonia, Germany, Italy, Portugal, Slove-
30% of total fat as the reference point. In nia) point out the use of iodised salt, and
this context, examples of countries with SFP BE-Wallonia, Bulgaria, Lithuania, Slovenia
mentioning trans fats (to be limited) are Bul- and Switzerland explicitly mention iodine
garia, Slovenia and Spain. in their nutrient-based standards. Overall it
appears that the overconsumption of calo-
Regarding the question about standards for ries, especially due to excess fat, is of more
non-milk extrinsic sugars, some SFP rather widespread concern than the insufficient in-
refer to ‘simple sugars’ (e.g. Croatia, Slove- take of essential (micro)nutrients.
18 | Mapping of National School Food Policies across the EU28 plus Norway and SwitzerlandVending machine restrictions Yes
No
Guidance or restrictions on vending ma-
chines in schools vary considerably across 35%
countries. Examples range from recommen- 65%
dations for balanced offers to defined lists
of foods and beverages allowed/prohibited
in vending machines to outright bans of
vending machines on school premises (Table
4). Notably, Spain sets a portion maximum Figure 8. School food policies specifying training
of 200 kcal for vending machine offers, and requirements for school catering staff across the EU28
plus Norway and Switzerland (n=34).
Portugal recommends that, where feasible,
vending machines are accessible only out-
side regular food service hours.
Training requirements of school catering staff
Two thirds of SFP stipulate training require-
ments of school catering staff (Fig. 8). In
some cases, legal acts set out formal train-
ing standards for any personnel involved in
handling food, including food business op-
erators and caterers. While SFP from Italy,
Latvia and Sweden do not legally mandate
training requirements, they do emphasise
the importance of properly trained staff.
Countries without general training require-
Specific marketing limits for the three categories stated in
ments for school catering staff are Cyprus,
SNIPE (i.e. drinks high in sugar, foods high in sugar, and
Czech Republic, Ireland, Lithuania, Nether- savoury snacks high in fat or salt) combined with restrictions
lands, Norway, Portugal, and UK-England. of a more generic kind or focussing on other types of foods/
drinks as well.
Marketing restrictions only on the three food/drink catego-
Restrictions on food marketing ries pre-specified in SNIPE.
Food marketing restricted in some other way without mak-
ing reference to the three pre-defined categories in SNIPE.
Figure 9– essentially a heatmap –shows the
Food marketing restricted in some other way without mak-
extent to which different countries restrict ing reference to the three pre-defined categories in SNIPE,
food marketing in schools. Restrictions and including a positive role of marketing/sponsoring.
No food marketing restrictions specified.
range from specific marketing limits for
the three categories of High-Fat/Sugar/ Figure 9. Food marketing restrictions in schools across
Salt (HFSS) foods and drinks pre-stated in the EU28 plus Norway and Switzerland (n=34).
School food policies in the EU28 plus Norway and Switzerland | 19SNIPE combined with other, unspecific re
strictions on one end of the spectrum, to
unspecific restrictions alone on the other.
Germany and Poland are interesting cases in
the sense that they acknowledge a positive
role of marketing. Germany considers spon-
soring as a means to establish co-operations
with external partners and increase school
budget, but a clear distinction is made from
product-specific marketing. The Polish per-
spective, on the other hand, is that school
can be a place for advertising food products,
but not for the sale of food products not
recommended in children’s diets.
Figure 10. Countries in the EU28 plus Norway and
Out of the countries surveyed, two-thirds re- Switzerland where nutrition education is a mandatory
part of the national education curriculum (n=34);
port to have food and nutrition established
orange=mandatory; blue=not mandatory.
as mandatory elements in their national
education curricula (Fig. 10). A majority of
those who do not mandate food and nutri-
tion education nonetheless acknowledge
the importance of the subject or strongly
recommend its inclusion in the curriculum
through dedicated policies or national ac-
tion plans on healthy eating and lifestyle.
20 | Mapping of National School Food Policies across the EU28 plus Norway and SwitzerlandConcluding remarks
Our school food policy analysis shows that Obesity 2014-2020,30 namely: 1) Support a
all 28 EU Member States plus Norway and healthy start in life; 2) Promote healthier
Switzerland recognise the importance of environments, especially in schools and pre-
proper child nutrition by having a SFP of schools; 3) Make the healthy option the easier
some form in place. This may range from option; and 4) Restrict marketing and ad-
a list of foods (dis)allowed to be sold on vertising to children. The following are just
school premises (Cyprus) to extensive vol- some statements highlighted in said Action
untary guidance (e.g. Germany, Italy) or Plan that were also found to have a more or
mandatory standards (e.g. Finland, Slove- less prominent role in SFP across Europe:
nia). Overall, SFP are mandatory in 15 coun-
tries and voluntary in the other 15 countries. • ‘…vital that meals provided in schools
Ministries of Health or Education, either are healthy, that the nutritional quality
alone or in combination, are the most com- of any other foods sold in schools is im-
mon governmental departments primarily proved, that the healthy option is always
responsible for SFP development. The vast the easier option…’;
majority of SFP employ food-based stand- • ‘…ensure ease of access to healthy and
ards and aim to improve child nutrition, nutritious food and to allow sufficient
teach healthy diet and lifestyle habits and time for such foods to be consumed mak-
reduce or prevent obesity. Other aspects ing healthy options more affordable and
addressed are energy/nutrient-based stand- attractive…’;
ards, restrictions on food marketing and • ‘…limit exposure to less healthy food op-
vending machines, and the importance of tions…’;
training catering and other staff involved in • ‘…reducing food waste.’;
handling food. • ‘…provide children and young people
with fresh drinking water in schools…’.
Our analysis shows that national SFP stand-
ards and recommendations to varying de- At the same time, it is worth pointing out
grees are in line with the guidance provided that little more than half of all SFP specify
in the WHO tool for the development of outcome measures. In other words, more
school nutrition programmes.29 Further- targeted efforts towards monitoring and
more, they clearly relate to at least four of evaluation–see Action Area 7 in the Child-
the eight Areas for Action in the recently hood Obesity Action Plan– would help
adopted EU Action Plan on Childhood
30. http://ec.europa.eu/health/nutrition_physical_activity/docs/
29. WHO (2006) Food and nutrition policy for schools. childhoodobesity_actionplan_2014_2020_en.pdf.
Concluding remarks | 21understand what difference SFP can make • Use of new technologies in SFP imple-
and whether it is going in the intended di- mentation, monitoring and evaluation.
rection. The complete SNIPE question-
naire, which covers seven domains includ- Where sufficient scientific evidence has ac-
ing ‘Monitoring’ and ‘Outcome and impact cumulated on a specific measure, clear goals
measures’, offers pertinent indicators and for action need to be defined and pursued
could thus help stimulate effective monitor- by strategic partnerships between all rel-
ing/evaluation, and it would allow doing so evant stakeholders.
in a harmonised way across Europe. Lack of
internationally comparable data remains an Notably, since our survey is limited to SFP
important barrier to evidence-based policy content description, the results do not al-
making. Further feasibility trials are planned low any inferences about SFP effectiveness
to inform any necessary revision of SNIPE, or the absence thereof. However, they could
and support from MS would aid its Europe- be used as a starting point for investigations
wide implementation. into the possible correlations between dif-
ferent types of school food policy and rates
Data gathered through SNIPE will be useful of childhood overweight/obesity and other
to public health research, particularly in the parameters of public health interest. The
field of health economic impact evaluations fact that the data presented have been cross-
to quantify the benefit of school meals. Other checked by national HLG representatives
suggested areas where (further) research for all countries makes this report a uniquely
could help develop and implement effective reliable resource for information about the
measures for improved nutrition in schools status quo of school food policy in Europe.
and beyond are (non-exhaustive list):
We hope that this report and the underly-
• Strategies to establish free access to fresh ing database will help policy makers learn
drinking water in all school environments from one another about SFP options and
and thus promote and achieve healthy measures and in doing so move towards
drinking habits. best practice in the context of widely dif-
• Food arrangement and display to nudge fering cultures. At the same time, this map
students towards more favourable dietary aids researchers in investigating potential
choices. links between school food policies and
• Social marketing approaches addressing public health, thus giving an indication of
the individual and local communities. the possible benefit of such strategies. It is
• Impact of school food and other healthy through these combined efforts that we are
lifestyle measures on educational attain- most likely to contribute to halting the rise
ment. in childhood obesity in Europe by 2020. No
• Low budget measures likely to result in less is the goal of the EU Action Plan on
tangible improvements. Childhood Obesity.
22 | Mapping of National School Food Policies across the EU28 plus Norway and SwitzerlandANNEX I: Origins and development of SNIPE
(School Nutrition Index of Programme Effectiveness)
In discussion with representatives from
these agencies (and others), and with those
providing the information, it became appar-
M. Nelson ent that there was considerable overlap in
22 January 2014 the interests of these agencies and the infor-
mation being sought. Yet it was often the
Introduction same person in each country or region who
was providing the same information to dif-
School food has changed dramatically in ferent agencies, often in differing formats.
the last 10 years. Across Europe, the United Discussions with information gatherers,
States, Brazil, China, Africa and elsewhere, providers and users suggested that a com-
the impetus to review the role of school food mon, coherent set of questions, shared by
as a means to improve child health, educa- all and used internationally, would improve
tional outcomes, and economic and agricul- the quality of the information collected and
tural security has fostered a raft of guidelines reduce the burden on the information pro-
and legislation to change what children eat. viders particularly.
There has been nothing less than a revolu-
tion in school food around the world. An important aspect of the development of
SNIPE was the concept that good quality
In order to track these changes in policy and information across a broad range of top-
implementation, to understand their im- ics (domains) could be used to model the
pact on school feeding on health and educa- impact of policy and implementation on
tional outcomes, and to evaluate their cost- outcomes, assess the cost-effectiveness of
effectiveness, several international agencies school food and nutrition programmes, and
(World Bank, World Food Programme (WFP), help countries identify best practice. Hence
World Health Organization (WHO), Part- the notion of an ‘index of programme ef-
nership for Child Development (PCD), fectiveness’ was generated. Included in the
EU Joint Research Centre (JRC)) have col- index was an evaluation of the quality of the
lected information about school food and data itself.
nutrition programmes through their prin-
cipal contacts. Enquiries are typically at Aims and objectives
national level, but regional information is
also sought, especially where responsibility The development of an index of effectiveness
has been delegated to provincial or regional of school food and nutrition programmes
governments. has three purposes:
ANNEX I: Origins and development of SNIPE | 23• to characterise practices which support munity involvement, agricultural support
improved nutrition for children through and sustainability, etc.
school nutrition programmes, with ele-
ments relating both to viability and sus- Development of SNIPE
tainability;
• to promote understanding of the factors In purely pragmatic terms, one of the aims
that promote or impede the successful of the consultation and development of the
implementation of school food and nu- SNIPE questionnaire is to capture much of
trition programmes; the common information that is currently
• to stimulate changes in policy and prac- being collected at different times by dif-
tice that are likely to have maximum im- ferent agencies from the same information
pact and benefit. providers in each country. The aim is to im-
prove the efficiency and consistency with
The four principles underpinning SNIPE are: which the information is gathered, and to
reduce the burden on information provid-
• Breadth of coverage. SNIPE must be com- ers by reducing the number of times that
prehensive in its assessment of factors they are asked to provide information.
that influence the success of school food
and nutrition programmes to improve Questionnaires used by World Bank, WFP,
child nutrition and health. WHO, PCD, JRC, and examples from the
• Commonality. SNIPE must provide the ba- Children’s Food Trust Annual Survey (UK)
sis for multiple agencies to obtain informa- and the School Nutrition Dietary Assess-
tion using a common format and questions. ment Study, were obtained by the author and
Data sharing between agencies is key. compiled to make a unified questionnaire.
• Evidence. The data underpinning the in-
dex must be objective, robust and valid. Domains
While self-assessment has a role, the un-
derlying principle must be that primarily Questions were classified in seven domains:
objective measures (qualitative as well as Domain 1. School food policy and its objec-
quantitative) are used in the development tives (19 questions).
and calculation of the index. These can Domain 2. Implementation (29 questions).
include evidence of the presence and de- Domain 3. Monitoring (13 questions).
velopment of policies, and evidence relat- Domain 4. Finances (15 questions).
ing to implementation. Domain 5. Outcome and impact measures
• Outcomes. There must be clear and objec- (3 questions).
tive links between policy, implementation Domain 6. Social protection and sustain-
and outcomes relating to child health, ability (12 questions).
nutrition and other benefits relating to Domain 7. Availability and validity of the
educational attainment, family and com- elements of the index (7 questions).
24 | Mapping of National School Food Policies across the EU28 plus Norway and SwitzerlandYou can also read