2020-21 CHARTER RENEWAL APPLICATION - Office of Charter Schools Indiana Connections Academy and Indiana Connections Career Academy December 18, 2020
←
→
Page content transcription
If your browser does not render page correctly, please read the page content below
Office of Charter Schools

     Indiana Connections Academy

                  and

  Indiana Connections Career Academy

2020-21 CHARTER RENEWAL APPLICATION

             December 18, 2020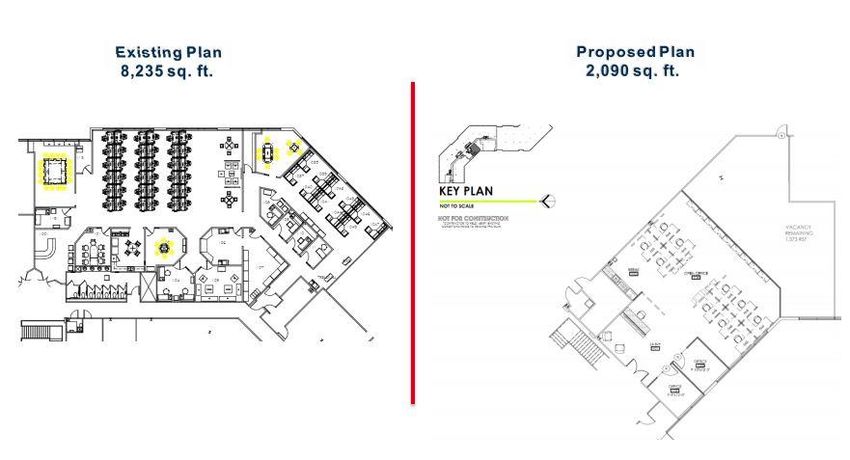
© 2018 Ball State University

This document carries a Creative Commons license, which permits
noncommercial re-use of content when proper attribution is provided.
This means you are free to copy, display and distribute this work, or
include content from the application in derivative works, under the
following conditions:

Attribution You must clearly attribute the work to the Ball State
University Office of Charter Schools.

Noncommercial You may not use this work for commercial purposes,
including but not limited to any type of work for hire, without explicit
prior permission from Ball State University.

Share Alike If you alter, transform, or build upon this work, you may
distribute the resulting work only under a license identical to this one.

For the full legal code of this Creative Commons license, please visit
www.creativecommons.org. If you have any questions about citing or
reusing Ball State University content, please contact us.

TABLE OF CONTENTS

CHECKLIST FOR CSAPPHIRE SUBMISSIONS............................................................................................ ii
RENEWAL NARRATIVE .......................................................................................................................... 1
   I.     Enrollment and Demographic Overview................................................................................... 1
   II.    Executive Summary ................................................................................................................. 5
   III.   Student Performance Diagnostic.............................................................................................. 6
   IV.    Stakeholder Diagnostic .......................................................................................................... 17
   V.     Organizational and Financial Diagnostic................................................................................. 19
   VI.    Financial Dashboard .............................................................................................................. 23
ATTACHMENT A - EXECUTIVE SUMMARY………..……………………...……..…..….……………....ATTACHMENT A-1

TABLE OF FIGURES

Figure 2. Consecutive Year Stat Analysis ...................................................................................... 13
Figure 3. State Test Achievement Gaps at Indiana and INCA ....................................................... 14
Figure 4. ELA and Math Achievement Gaps.................................................................................. 14
Figure 5. State Test Achievement (% Scoring Proficient) ............................................................. 15
Figure 6. INCA and INCC Proposed Facility Plan ........................................................................... 20
Figure 7. INCA Financial Performance Framework ....................................................................... 23
Figure 8. INCC Financial Performance Framework ....................................................................... 24

                                                                   Page i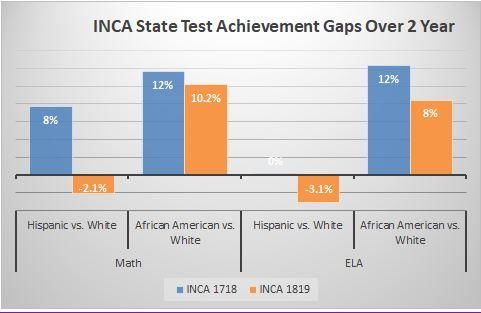
CHECKLIST FOR CSAPPHIRE SUBMISSIONS
School Documents
√Curriculum and Instructional Methods
√General Descriptions of Responsibilities of Teachers and Staff
√ Methods of Promoting Parent and Community Involvement Practices
√Methods of Pupil Assessments
√ Organizational Chart (updated administrative organizational chart with names)
√School Calendar (current school year) (annual folder titled “School Calendar”)
√ Staffing Matrix
√Supplemental Programs (Information on Current Student Clubs, Organizations, and Other
Extracurricular Activities Offered (including athletic teams))
Current School Policies and Plans
√Conflict of Interest Policy
√Criminal Background Check Policy
√Deposit of Funds Policy
√Discipline Policy
√Elementary School Reading Plan
√ Fundraising Policy and Guidelines
√Graduation Requirements, including diploma types offered (if applicable)
√ Medication Policy
√Performance Evaluation Plan for Administrators and Teachers
√Personnel Plan, including Methods of Selection, Retention and Compensation of Employees
√Policy and Procedures for ELL Students
√Policy and Procedures for Special Education
√Professional Development Methods
√Promotion/Retention Policy
√ School Admission Policy
√School Safety and Emergency Preparedness Plan
√Social Media Policy
√Staff Handbook
√Student Handbook
√Student Health Screening Policy
√ Student Records Policy
√Teacher and Staff Compensation and Benefits Plans
√Transportation Policy (if applicable)
Page iiCorporate Documents
√Articles of Incorporation (and any Amendments thereto)
√Any Fictitious Name Registrations filed with the Indiana Secretary of State
√Board By-Laws
√Board Member List (including Current Contact Information)
√Calendar of Board Meetings
√ ESP Agreement (together with all Amendments thereto, if applicable)
Financials and Budgets
√School’s Budgets for 2019-20 and 2020-21
√* School’s Audit for the school years ended 6/30/2019 and 6/30/2020
*Please note the 2019-20 audit will be uploaded by the application due date of 12/31/20
Board – Agenda and Minutes
√ Board Minutes Approving School’s Budgets for 2019-20 and 2020-21
Insurance
√ Certificate of Liability Insurance
√Evidence of Property Insurance
Facility Documents
√Lease Agreement(s) or Deed(s) for All Occupied Facilities
√Certificate of Occupancy issued by the Indiana Department of Health
Page iiiRENEWAL NARRATIVE
I. ENROLLMENT AND DEMOGRAPHIC OVERVIEW
Provide the enrollment and demographic information for the current school year.
This data is based off the reported population from the Pupil Enrollment that took place on October 1,
2020.
INCA 2020-21 ENROLLMENT & INCC 2020-21 ENROLLMENT &
DEMOGRAPHIC INFORMATION DEMOGRAPHIC INFORMATION
# % # %
Total Enrollment 6702 Total Enrollment 532
# of Students on Waiting List # of Students on Waiting List
Gender Gender
Male 3117 46.51 Male 230 43.23
Female 3585 53.49 Female 302 56.77
Ethnicity/Race Ethnicity/Race
White 5647 84.24 White 431 81.02
Black 507 7.56 Black 42 7.89
Hispanic 536 8.00 Hispanic 49 9.21
Asian 95 1.42 Asian 5 0.94
Native American 6 0.09 Native American 9 1.69
Other 414 6.18 Other 43 8.08
Special Populations Special Populations
Students with IEPs 1174 17.52 Students with IEPs 80 15.04
English Language Learners 107 1.60 English Language Learners 8 1.50
Homeless Students 36 0.54 Homeless Students 4 0.75
Eligible for Free and 2743 40.93 Eligible for Free and Reduced 213 40.04
Reduced Lunch Lunch
Provide enrollment information for length of charter contract. (ADM Count)
This data is based off the reported population from the Pupil Enrollment that took place on October 1,
2020.
2016-17 2017-18 2018-19 2019-20 2020-21
INCA Total Student Enrollment 6078 6064 6122 6817 6702
2016-17 2017-18 2018-19 2019-20 2020-21
INCC Total Student Enrollment 0 186 409 447 532
Page 1Provide the student attendance information for the length of the charter contract.
This data is based off the reported population from the Pupil Enrollment that took place on October 1,
2020.
INCA Student Attendance
Year 1 Year 2 Year 3 Year 4 Year 5
Grade 2016-17 2017-18 2018-19 2019-20 2020-21
K 74 129 132 116 269
1 80 145 168 107 277
2 108 118 142 144 292
3 108 130 147 124 333
4 127 133 161 147 364
5 161 201 208 196 362
6 223 292 304 279 495
7 306 368 382 408 576
8 405 496 603 580 668
9 642 482 410 594 642
10 642 648 574 731 790
11 670 781 767 825 823
12 486 729 856 817 811
All Grades 4032 4652 4854 5068 6702
INCC STUDENT ATTENDANCE
Year 1 Year 2 Year 2 Year 4 Year 5
Grade 2016-17 2017-18 2018-19 2019-20 2020-21
K 0 0 0 0 0
1 0 0 0 0 0
2 0 0 0 0 0
3 0 0 0 0 0
4 0 0 0 0 0
5 0 0 0 0 0
6 0 0 0 0 0
7 0 0 0 0 0
8 0 0 0 0 0
9 0 18 79 30 100
10 0 24 147 88 121
11 0 30 77 145 145
12 0 0 82 110 166
All Grades 0 72 385 373 532
Page 2Provide the number and percentage of students eligible for special education by eligibility
category for the length of the current charter contract based on each school year’s
December 1 count.
INCA SPECIAL EDUCATION STUDENT POPULATION BY CATEGORY
Year 1 Year 2 Year 3 Year 4 Year 5
2016-17 2017-18 2018-19 2019-20 2020-21
# % # % # % # % # %
Autism Spectrum Disorder 118 1.94 135 0.02 155 0.03 146 0.02 190 3.00
Blind of Low Vision 4 0.00 4 0.00 4 0.00 4 0.00 5 0.08
Cognitive Disability 39 0.64 43 0.01 37 0.01 57 0.01 58 0.92
Deaf or Hard of Hearing 10 0.16 8 0.00 14 0.00 8 0.00 21 0.33
Deaf-Blind 0 0.00 0 0.00 0 0.00 0 0.00 0 0.00
Development Delay (early 0 0.00 0 0.00 0 0.00 2 0.00 19 0.30
childhood)
Emotional Disability 94 0.02 100 0.02 95 0.02 111 0.02 113 1.79
Language or Speech Impairment 55 0.01 52 0.01 48 0.01 41 0.01 89 1.41
Multiple Disabilities 3 0.00 4 0.00 7 0.00 7 0.00 8 0.13
Orthopedic Impairment 8 0.00 14 0.00 12 0.00 13 0.00 11 0.17
Specific Learning Disability 230 0.04 253 0.04 294 0.05 289 0.04 355 5.61
Traumatic Brain Injury 1 0.00 1 0.00 3 0.00 6 0.00 5 0.08
INCC SPECIAL EDUCATION STUDENT POPULATION BY CATEGORY
Year 1 Year 2 Year 3 Year 4 Year 5
2016-17 2017-18 2018-19 2019-20 2020-21
# % # % # % # % # %
Autism Spectrum Disorder 0 0 5 2.69 17 4.16 11 2.46 11 1.91
Blind of Low Vision 0 0 0 0 0 0 0 0 0 0
Cognitive Disability 0 0 0 0 4 0.98 3 0.67 3 0.52
Deaf or Hard of Hearing 0 0 0 0 0 0 1 0.22 0 0
Deaf-Blind 0 0 0 0 0 0 0 0 0 0
Development Delay (early childhood) 0 0 0 0 0 0 0 0 0 0
Emotional Disability 0 0 2 1.08 7 1.71 2 0.45 17 2.95
Language or Speech Impairment 0 0 0 0 3 0.73 1 0.22 2 0.35
Multiple Disabilities 0 0 0 0 0 0 0 0 0 0
Orthopedic Impairment 0 0 0 0 0 0 0 0 0 0
Specific Learning Disability 0 0 6 3.23 29 7.09 16 3.58 27 4.69
Traumatic Brain Injury 0 0 0 0 0 0 0 0 0 0
Provide the number and percentage of ELL students for length of charter contract.
INCA ELL STUDENT POPULATION CHART
Year 1 Year 2 Year 3 Year 4 Year 5
2016-17 2017-18 2018-19 2019-20 2020-21
# % # % # % # % # %
30 0.49 52 0.90 44 0.72 80 1.17 107 1.60
Page 3INCC ELL STUDENT POPULATION CHART
Year 1 Year 2 Year 3 Year 4 Year 5
2016-17 2017-18 2018-19 2019-20 2020-21
# % # % # % # % # %
0 0 5 2.69 9 2.20 16 3.58 8 1.50
Provide the number and percentage of homeless students for length of charter contract.
INCA HOMELESS STUDENT POPULATION CHART
Year 1 Year 2 Year 3 Year 4 Year 5
2016-17 2017-18 2018-19 2019-20 2020-21
# % # % # % # % # %
12 0.20 32 0.53 31 0.51 42 0.62 36 0.54
INCC HOMELESS STUDENT POPULATION
Year 1 Year 2 Year 3 Year 4 Year 5
2016-17 2017-18 2018-19 2019-20 2020-21
# % # % # % # % # %
0 0 0 0 0 0 3 0.67 4 0.75
Provide the number and percentage of High Ability students for length of charter contract.
INCA HIGH ABILITY STUDENTS
Year 1 Year 2 Year 3 Year 4 Year 5
2016-17 2017-18 2018-19 2019-20 2020-21
# % # % # % # % # %
119 1.96 112 1.85 69 1.13 134 1.97 86 1.28
INCC HIGH ABILITY STUDENTS
Year 1 Year 2 Year 3 Year 4 Year 5
2016-17 2017-18 2018-19 2019-20 2020-21
# % # % # % # % # %
0 0 0 0 0 0 0 0 0 0
You may enter an optional narrative about your Enrollment Diagnostic below. If you do not
have an optional narrative, enter N/A.
INCA requests an enrollment cap of 7,000 students. Due to adding grades 6-8, INCC is requesting to
increase its enrollment cap from 2,000 to 3,000 students.
Page 4II. EXECUTIVE SUMMARY
A. School and Community Overview
1. Describe the school's size, community/communities, location, and changes it has experienced
in the last three years. Include demographic information about the students, staff, and
community at large. What unique features and challenges are associated with the
community/communities the school serves?
2. State the charter school’s mission and describe the educational needs the school’s founders
were seeking to address in your community. Describe why this initiative is important to the
community the school serves.
B. School Design
1. Provide a brief summary of the school’s key design elements and specific examples of how
the school implements the key design elements. Key design elements support the
implementation of the school’s mission and make the school unique and distinct from any
other school. Key design elements should all relate to the mission statement or the intentions
set out in the school’s original (or amended) charter.
2. Does the school engage in a systematic, inclusive and comprehensive process to review,
revise and communicate the school’s mission and design? Please describe this process, and
when it last occurred, or is planned.
3. Describe any changes to the school's mission or substantial revisions to the educational
program as described in the current charter that the school proposes to make for the next
charter term. Discuss any associated challenges or risks.
C. Goals and Plans (6000 character limit)
1. State and provide an overview of the charter school’s future goals. Summarize the plans for
accomplishing these goals (e.g. academic benchmarks, organizational changes, facility
improvements, financial stability).
2. Summarize plans for addressing any past academic, organizational, or financial deficits.
3. (OPTIONAL) Provide any additional information you would like to share with the public and
community that were not prompted in the previous sections.
The entire executive summary is completed and provided as Attachment A to stay within the required
25-page limit.
Page 5III. STUDENT PERFORMANCE DIAGNOSTIC
A. Continuous Improvement Practices
1. Describe the school’s assessment system and how it is used to improve instructional decision-
making, support student learning and implement professional development.
INCA and INCC deliver instruction primarily through web-based digital learning strategies providing
students with choice over time, place, path and modality of learning.
Using Assessment and Performance Data to Evaluate and Inform Instruction
Whenever possible, state standardized test results are integrated into an incoming student’s basic
information in the EMS. Likewise, results for state standardized tests that students take while enrolled
at INCA and INCC are included in the EMS, along with benchmark pre-, mid-, and post-test data. This
data is used to track student progress from year to year and within the year, and to inform the course
placement and instructional needs of students.
Formative assessments provide educators with critical information about student progress and can be
used to adjust the teacher’s approach and the pace of instruction throughout the year. Formative
assessments are often used as tools for uncovering opportunities for instructional intervention because
they give teachers information about where additional practice and support may be needed. Research
has shown that timely and specific feedback from formative assessments can enable teachers to make a
significant impact on student learning. In Formative Assessment in Seven Good Moves posted to the
Association for Supervision and Curriculum Development (ASCD) website, Brent Duckor stated, “The
research is clear: What teachers do in their classrooms matters. But which practices really make a
difference?” John Hattie (2012) conducted an extensive meta-analysis, looking at 800 meta-analyses
that focused on locating a specific student achievement outcome and identifying an influence on that
outcome. Formative assessment topped his list of the most influential practices that improve student
outcomes.”1
Beginning in the 2020-21 school year, INCA began using the Renaissance 360 Benchmark assessments
for early literacy, reading, and math, assessing students three times a year. At the same time, INCC
began using the NWEA MAP Benchmark assessments for their students in reading and math. The
beginning of the year test provides critical information to the teacher on the students’ starting point,
especially for those students where data about their previous year state assessment score isn’t
available. The middle and end of year benchmark assessments are used to determine if students are
making the expected level of growth during the year allowing for adjustments to instructional approach.
The benchmark assessments are also utilized along with formative assessments to identify the need for
instructional interventions. This includes INCA utilizing Freckle Math, an instructional supplement for
math that is directly connected to the Renaissance benchmark assessments. In the case, of INCC,
Imagine Math is used as the instructional supplement as it is better suited for high school students.
Teachers review assessment data as a regular part of their daily routine. Teachers review unit tests and
align curriculum-based assessment (CBA) questions accordingly. Teachers review student progress on
the benchmark assessments and student membership in various subgroups. During this review, teachers
note which students, in which subject areas, need additional assistance to achieve mastery. In addition,
1
Dukor, Brent. “Formative Assessment in Seven Good Moves”. Educational Leadership, Mar 2014. Available
(paywall) at:
Page 6teachers identify what a student must know to move forward in a course to be successful in the next
course in the sequence. The instructional methodology depends on teachers monitoring data sets that
indicate if a student is or is not learning. These data sets guide teachers towards identifying a student’s
specific skill set that needs remediation. The tools within the EMS, such as the Student Performance
Reporting for students in grades K–8, are helpful in showing alignment between assessments and the
curriculum. With support from the administrative team, teachers use that data to determine the
difference between a whole group reiteration and a small group remediation. The school also uses this
data to help determine additional instructional sessions. Students may be asked to participate in
required tutoring sessions and/or supplemental programs to help build their foundation skills. Students
who are excelling can participate in small group LiveLesson sessions as well as join the National Honor
Society.
Additionally, teachers spend several days of professional development, throughout school year, learning
how to look at and understand the data results. Teachers use this data to drive instruction and identify
at-risk students. Staff meet regularly to evaluate students’ progress and make changes as needed in the
instructional program.
INCA and INCC’s instructional methods, educational philosophy, and program include unique elements
from OBL. OBL provides specific educational products and services, always with the oversight and
approval of the INCA and INCC Board. The following descriptions of OBL’s unique core model elements
explain how the school’s assessment system operates and how it is used to improve instructional
decision-making, support student learning and implement professional development. OBL is committed
to continual improvement. Accordingly, OBL routinely updates its systems and techniques to
incorporate best practices and lessons learned. OBL continually improve its offering to INCA and INCC.
Teacher: INCA and INCC are comprised of highly qualified, state-credentialed teachers, as required by
law, who are also specially trained in online delivery and personalized instruction. Teachers work from
either a school office location and/or work remotely to deliver instruction to an online classroom of
students and work with students through highly interactive, technology-facilitated communication tools
and quality timely feedback on assignments
Teacher Professional Development: INCA and INCC receive customized professional development
which is based on school-specific needs, some of which arise from reviewing assessment results.
The INCA and INCC educational program model is supported by the high-performing OBL program that is
available for enrollment to all Indiana pupils. OBL has significant experience in delivering a quality
education program that improves pupil academic achievement. Students benefit from a top-quality,
curriculum that meets all Indiana Academic Standards. Effective, Indiana-credentialed teachers are a key
part of the program. Teachers are in regular contact with students via email, telephone, LiveLesson®
sessions, discussion boards, message boards, and other channels. Teachers instruct, motivate, monitor,
and evaluate student progress; personalize the curriculum; provide feedback; intervene as needed to
ensure student success; lead field trips; and clarify the curriculum for the students. There is a healthy
interplay between formative and summative assessment to inform instructional decision making and
additional student support.
Student Performance Reporting: Reports provide real-time student performance data on assessments.
The reports identify the student score and the performance against each item. For some courses,
objective level performance data is also provided. Teachers can use this data to determine which
Page 7students need more help with a concept. They may then participate in individual or small group tutoring
virtually with these students targeting specific skills.
Curriculum-Based Assessments: Teachers conduct CBAs, via telephone conversation or through one on
one LiveLesson sessions, as a quick and effective way to gather information on students’ understanding
of concepts. CBAs are used to validate a student’s understanding of concepts against the collected
formative data within the EMS, and identify areas where they may need additional support or practice.
CBAs also assist teachers in verifying that students are doing their own work. CBAs pinpoint strengths
and weaknesses in student mastery of concepts and verify that student learning.
OBL’s Education Management System (EMS): The EMS is the platform for organizing and supporting
INCA and INCC’s entire educational environment. This suite of web-based software delivers assignments
and tracks activities (whether conducted virtually or offline) while monitoring the completion of
individual lessons as well as mastery of discrete skills and knowledge, all under the watchful eye of
administrators, teachers, and Learning Coaches. The EMS operates within a secure, robust technology
infrastructure protecting data from loss and intrusion while maintaining a safe environment. Students,
teachers, administrators, and Learning Coaches access the EMS to organize, document, and interact,
ensuring an unprecedented level of engagement. The EMS is continually updated and improved upon
for the success of schools and families. All new releases and updates of the EMS are automatically
provided.
Interactive Reviews: Interactive reviews are additional practice opportunities embedded in the
curriculum and serve to give students targeted feedback on concepts and skills.
LiveLesson® Session/Synchronous Contact: A real-time, interactive web conferencing tool, LiveLesson
sessions allow teachers to work synchronously and directly with students using voice-over IP, electronic
whiteboard, and shared web surfing based on Adobe® Connect™. These sessions are also recorded so
students can watch on their own schedule. This live support is a direct reflection of formative
assessment that indicates to the teacher where additional efforts are needed to help students master
the content. Teachers document all synchronous contact with a student within the student’s Log in the
EMS. INCA and INCC meet the requirements of an online provider to maintain synchronous contact with
students.
Summative Assessments: Units of online instruction culminate with a summative unit test. Teachers
review these results and make decisions regarding instructional supports needed to improve learning
outcomes.
Personalized Learning Plan with Real-Time Performance Data: This instructional process creates a
unique learning experience for each student. During enrollment, academic placement advisors and
school counselors review students’ past records and performance to properly place them in INCA and
INCC. The EMS provides teachers with data to inform ongoing progress monitoring and instructional
modifications Teachers use student performance data to create lesson modifications, customize
assignments, customize assessments to address students’ learning needs, or to provide students with
additional practice opportunities.
Graduation Plan: Within the platform, the Graduation Planning tool assists school staff and families
to define and track graduation requirements tailored to the diploma type and student post-
graduation goals. The counseling department is heavily involved in the graduation plan for each student.
Counselors meet with 9-11 grade students at a minimum one time a school year to discuss the student’s
Page 8graduation plan. In the senior year, the counselor meets with the student in the fall to ensure the
student and parent have a complete understanding of the graduation requirements, timeline and post-
secondary opportunities
Benchmark Assessments: Both INCA and INCC use formative, benchmark assessments to measure
student proficiency in reading and math and to obtain a scaled score that can be used to measure
academic growth. INCA uses the Renaissance Star Assessments to assess students in grades K-10 and
INCC uses the NWEA MAP® assessment to assess students in grades 6-10. INCA and INCC use versions
aligned with the Indiana Academic Standards that provide teachers with reports and information to
address individual student needs.
State Testing: As a public school, students participate in required state testing including summative
assessments such as the I AM, ILEARN (Grades 3-8), ISTEP+, IREAD-3, and WIDA.
Student Status/Escalation Process: The school tracks and reports ongoing student progress based on
the objective quantitative data generated by the EMS. Staff members analyze attendance, participation,
performance, assessment submissions, and teacher contact. The student status is displayed on the
home page for instant identification of potential problem areas. The Escalation Process goes into effect
when students are in statuses other than “On-Track” to ensure students continue to gain the full
benefits of this educational option and unique school choice.
Cognitive Abilities Test (CogAT): CogAT is a multiple-choice test designed to measure a child’s academic
aptitude and gifted abilities. INCA uses this assessment to place gifted students in elementary school.
While participation is voluntary, we encourage all grade 2 and 5 students to take part in this assessment.
2. Describe how the school uses other data (qualitative and quantitative) to evaluate the
effectiveness of the academic program.
Managing and Interpreting Data
Teachers access the Student Performance Reports which provide real-time student performance data on
assessments. The reports identify the student score and the performance against each item. For some
courses, objective level performance data is also provided. Teachers can use this data to determine
which students need more help with a concept. They may then participate in individual or small group
intervention virtually with these students targeting specific skills.
At both the section and individual student levels, the Student Performance Reports can be generated
displaying the essential skills and standards for a course and exactly where in the curriculum each are
assessed. The Student Performance Reports provide real-time student performance on each of the
essential skills and standards based upon individual assessment items which measure standards-based
objectives that students should master by the end of that grade level. Data can be used to identify
students who have mastered or not mastered specific objectives. Teachers can run this report as
frequently as they like to see exactly how students are progressing regarding each of the skills and
standards for that subject and grade. This method enhances the multi-tiered instruction model;
identifies essential skills and standards by subject/grade level; identifies where these essential skills and
standards are assessed; adheres to the RtI model; provides access to and analysis of real-time data to
determine mastery/proficiency; incorporates data-driven decisions throughout instruction; identifies the
need for tiered interventions for non-mastered/proficient skills and standards; and identifies students'
response to the implemented interventions.
Page 9School Improvement
Each year, the Partner School Leadership Team (PSLT) coordinates with the School Leader and INCA and
INCC Board to create a School Improvement Plan (SIP) to address any issues or challenges that the
school has identified. The SIP is comprised of Action Plans used to identify the priority concerns, create a
hypothesis on why the challenge is occurring, and set goals to meet those challenges. The school sets
measurable objectives, delineates the task, assigns responsible parties for completing the action step,
sets a time frame for meeting the goal/measuring progress, provides resources that will be needed to
successfully complete the actions, and provides a metric for evaluating success. This goal setting,
monitoring, and measuring process puts the focus on continuing school improvement.
INCA and INCC consistently looks for strategies to mark improvement in student learning and academic
achievement, and uses many different data points to provide direction for the school. For instance, data
will include parent satisfaction, state testing, formative testing, attendance, retention, and graduation
rate, among others, to detail the growth and accountability of INCA and INCC.
3. Describe how the school leadership implements a continuous improvement process that
provides clear direction for improving student learning.
Prior to the start of the students' school year, all teachers and school leadership participate in staff
development sessions in which they review the previous year's data including retention rates, state
assessment scores, student achievement rates, and parent satisfaction surveys. Using these data points
as well as state and federal accountability metrics, the school leadership team and staff set goals and
strategies for the upcoming school year. This is best known as the School Improvement Plan, as
described in response to Question 2. Teachers collaborate with one another on strategies to increase
student performance and enhance their experience with the program. Teachers and staff meet monthly
for regular meetings to discuss current issues affecting the school and potential solutions. Grade level
teachers meet on a weekly basis in subject-based Professional Learning Communities (PLCs) guided by
DuFour’s four essential PLC questions. Teachers participate in weekly team meetings to target individual
students who may need interventions or additional attention. All teachers take the OBL Teacher Training
and Orientation course, which stays on their home page in EMS as a resource throughout the year.
Staff members participate in monthly professional development meetings (based on their level of
experience with online learning) with OBL School Support representatives. During this time, teachers
receive training in best practices in education and, specifically, online education. OBL provides ongoing
professional development activities throughout the year. Sessions are open to all. Sessions are
organized by teacher experience level with a special focus on teachers who are new to OBL and online
learning. New teachers benefit from the re-occurring training opportunities.
4. Describe how leadership and staff supervision and evaluation processes have resulted in
improved professional practice and student success.
Staff Development is embedded in the fabric of our schools; it is a part of our bi-weekly touch-base
meetings between staff/manager, whole-staff meetings, OBL provided PD sessions, on-boarding for new
teachers by both OBL and INCA/INCC Master Teachers. INCA and INCC also encourage external
professional development as appropriate and as budget allows, particularly when the
training/professional development focuses on trauma-informed practices or cultural competency and
racial inequities, instructional best practices (both online and traditional) or high need contents like
Math, English, Science, or for special populations like SPED or ELL.
Page 10Teacher Evaluation is conducted in partnership with OBL HR, using a school-created rubric. Counselors
use the Indiana State Counselors Evaluation tool. Yearly evaluation of all certified and non-certified staff
includes the employee’s self-assessment, Managers Mid-Year and End of Year performance expectations
and observations.
Staff evaluations are tied to our school’s outcomes. We review our staff’s evaluations ratings, and use
this performance data to design professional development or coaching cycles. Our professional
development, coaching and evaluation cycles are geared towards improving the staff’s performance,
which in turn improves our students’ successes.
B. Needs of Learners
1. Describe the systems in place to monitor the progress of individual students and facilitate
communication between interventionists, classroom teachers and parents regarding the
needs of individual students.
The EMS captures all needed data about students, their attendance, and their performance.
Incorporating all necessary precautions to protect identifiable and private student data, data is only
accessible for viewing by the appropriate school staff, teachers, and parents/guardians on a moment-by-
moment, day-by-day basis. In addition, aggregated data is used for formal reporting to various
stakeholders on the students’ and the school’s instructional progress.
• Grade Book and Data Tools: Both Learning Coaches and teachers have access to an electronic
grade book that tracks all results and serves as the basis of changes in the student’s learning
plan. A key aspect of student success is the detailed feedback provided by the teachers beyond
the simple right/wrong grading of many traditional assessment vehicles. INCA and INCC also use
a variety of advanced data visualization tools that provide students, parents, teachers, school
administrators, institutional education partners, regulators and researchers with views of how
students are performing.
• All Required Reports: The EMS is fully customizable to meet district and state reporting needs.
• Ongoing Communication with Learning Coaches: Communication with parents and Learning
Coaches are frequent and purposeful throughout the school year and communicates formative
and summative progress. Scheduled phone calls, LiveLesson sessions, and face-to-face meetings
may all be used to help teachers gauge student's mastery of concepts and to determine
appropriate instructional recommendations. Teachers conduct follow-up conversations by
parent-teacher/teacher-student conferences using messaging, LiveLesson sessions, feedback
when grading, phone conversations, and/or face-to-face interactions. Students also interact
with teachers through asynchronous communications (e.g., messages, assessment feedback,
posts, etc.) more frequently. In the secondary model, the student’s six subject teachers and
homeroom teacher may rotate this responsibility among them. The dialogue occurs by
telephone, in online synchronous sessions, or in person to ensure progress is being made.
• Curriculum-Based Assessments: As mentioned previously, teachers conduct CBAs as a quick and
effective way to gather information on students’ understanding of concepts. CBAs are used to
validate a student’s understanding of concepts against the collected formative data within the
EMS, and identify areas where they may need additional support or practice. CBAs also assist
teachers in verifying that students are doing their own work. CBAs pinpoint strengths and
weaknesses in student mastery of concepts and verify that student learning.
• Multi-tiered Systems of Support (MTSS): INCA and INCC employ a multi-tiered Systems of
Support framework based upon the Response to Intervention (RTI) model that deeply links
Page 11curriculum, standards, assessments, and interventions that have a direct impact on student
mastery and resulting standardized test performance. Through this model every student
has access to the resources they need to be successful: Tier I core curriculum with
differentiation, Tier II supplemental instructional supports, and Tier III supplemental
instructional supports. Student Support teams (SST) meet regularly to develop an intervention
plan and strategies for improvement for students who need more frequent, targeted learning
support.
Students should expect work to be graded, based on the assignment and format, from immediately to
up to one week, with the average being 24-hour turnaround time. In addition to formal, graded
assignments, teachers continuously monitor student work via the EMS, noting performance on auto-
graded quizzes and checks for understanding and reaching out to students via synchronous telephone
or LiveLesson based CBAs to verify student work and/or diagnose difficulties in mastering discrete skills
and concepts. The EMS tracks teacher response time and teacher-student/teacher-parent
communications, providing the Head of School with rich, actionable data on this key aspect of teacher
performance.
2. Explain how the school supports for diverse learners.
INCA and INCC are tailor-made for a diverse array of students who benefit from a quality alternative to
the traditional brick-and-mortar classroom. INCA and INCC serve the general education students,
students with disabilities, at-risk students, gifted students, and English language learners.
INCA and INCC complies with the Individuals with Disabilities Education Improvement Act (IDEA), 20
U.S.C.A.§§ 1400 et. seq. and implementing regulations, including Section 300.209 of Title 34 of the Code
of Federal Regulations, and Section 504 of the Rehabilitation Act of 1973, 29 U.S.C. 794 (sec. 504) and
the Americans with Disabilities Act. INCA and INCC provides a free and appropriate public education
(FAPE) to students with disabilities, as identified under such Acts. These supports include, but are not
limited to, identifying, evaluating students with disabilities, and developing 504 plans or individualized
education programs that meet each student’s unique needs, in accordance with state and federal
requirements. INCA and INCC special education leaders and intervention specialists will work closely
with the general education teachers to ensure that every student receives needed services to access and
progress in the general education curriculum in the Least Restrictive Environment according to each
student’s 504 Plan or IEP.
C. Areas of Notable Achievement and Areas for Improvement
1. Which area(s) are above and below the expected levels of performance?
In 2018-2019, INCA performance on the English Language Arts (ELA) ISTEP/ILEARN state assessment was
equivalent to other schools in the state on Grade 3 students at INCA achieved proficiency on the IREAD-
3 assessment (76.2% in 2018-19).
INCC state assessment data is limited to students in grade 10. Performance on the ELA state assessment
fell below the state in 2018-2019 (51.4% vs. 62.4%) but showed strong growth (10 percentage points)
over the prior year.
Grade 3 students at INCA are achieving proficiency IREAD-3 assessment (meeting standard; 76.2 for
2018-19).
Page 12Both INCA and INCC performed below the state average on the ISTEP/ILEARN math state assessment.
The graduation rate for INCA has significantly improved with an 11-percentage point increase from 2018
to 2019. Graduation rates were 49% in 2014-15, 43.9% in 2015-16, 49.5% in 2016-17, 49.8% in 2017-18,
and 61.4% in 2018-19. The graduation rate for INCC in 2018-2019 was 61.9%.
2. Describe the area(s) that show a positive and negative trend in performance.
It is important to understand how INCA students perform when they enroll beyond the first year. The
comparisons can be expressed as “what percent of the Indiana statewide performance did INCA students
achieve?”. A percentage of 100 means that INCA students performed equal to the state, while a
percentage greater than 100 indicates that INCA outperformed other schools in the state. The 2018-
2019 state test data reveal that with consecutive years of enrollment, the gap between the state
and INCA closes significantly, and INCA students far exceed the state in reading and science by four
years. However, the gap in math closes only slightly and continues to be a key focus for improvement.
Note that an insufficient number of years of state test data for INCC were available for this analysis.
An analysis of post-secondary readiness indicators revealed several positive trends among 11th and
12th grade students at INCA. Among students participating in AP courses, 80% earned a 3 or above on
AP tests (up from 51% in the prior year). INCA students who participated in the SAT (n=167) far
exceeded the SAT benchmark of college readiness in Evidence-Based Reading and Writing (EBRW, 559
vs. 530) as well as total SAT score (1075 vs. 1010). Per the mission of INCC, which serves students who
do not normally take college-prep tests, data for INCC is not available, as an insufficient number of
students were tested.
Figure 1. Consecutive Year Stat Analysis
Consecutive Year State Test Analysis:
Ratio of % Proficient at INCA/State
174%
132%
119%
106%
106%
85%91%92% 85%76%
44%43%39%51%50%
English Language Arts Math Science
New 2 Years 3 Years 4 Years 5+ Years
Students Enrolled Three+ Years
In the Academic Framework, Q1 1.2.K, INCA was not rated. INCA students enrolled three or more years
perform better than students overall on state assessments in both ELA and Math. Percentages are the
percent of students scoring proficient or above.
2017-18
• ELA: All Students - 57.61%, Students enrolled 3 or more years - 67.86%, increase of 10.25
percentage points
Page 13• Math: All Students - 27.94%, Students enrolled 3 or more years - 32.32%, increase of 3.48
percentage points
2018-19
• ELA: All Students - 47.41%, Students enrolled 3 or more years - 52.63, increase of 5.22
percentage points
• Math: All Students - 18.39%, Students enrolled 3 or more years - 18.93%, increase of 0.54
percentage points
3. Between which subgroups is the achievement gap closing and between which is the gap
widening? Please support with data.
The achievement gaps among economically disadvantaged, special education, Hispanic, and African
American subgroups are substantially smaller at INCA in Math, Science, and ELA than at the state
level. Moreover, state test performance among Hispanic students at INCA meets or exceeds
performance of their white peers across all subject areas.
Figure 3 shows state test achievement gaps at Indiana and INCA reflected as the percentage point
difference between students in each subgroup and that of their peers.
Figure 2. State Test Achievement Gaps at Indiana and INCA
Economically
Special Education Hispanic African American
Disadvantaged
Indiana INCA Indiana INCA Indiana INCA Indiana INCA
ELA 28 pts 16 pts 38 pts 37 pts 19 pts -3 pts 30 pts 8 pts
Math 20 pts 13 pts 35 pts 19 pts 20 pts -2 pts 32 pts 10 pts
Science 31 pts 21 pts 33 pts 23pts 25 pts -14 pts 37 pts 25 pts
In ELA and Math, the achievement gap among African American and Hispanic students has decreased
over time as shown in Figure 4.
Figure 3. ELA and Math Achievement Gaps
Page 144. Which subgroup(s) show a trend toward increasing performance, and which toward
decreasing performance? Please support with data.
INCA students from economically disadvantaged, special education, Hispanic, and African American
subgroups outperform students from the same populations statewide in English Language Arts and
Science. However, students underperform relative to their same subgroup peers in Math.
Figure 5 shows the percent of students within each subgroup scoring proficient on state tests.
Figure 4. State Test Achievement (% Scoring Proficient)
Economically
Special Education Hispanic African American
Disadvantaged
Indiana INCA Indiana INCA Indiana INCA Indiana INCA
ELA 34% 41% 16% 20% 36% 52% 25% 41%
Math 33% 19% 19% 12% 34% 29% 23% 16%
Science 32% 38% 20% 31% 31% 64% 19% 26%
5. Discuss areas of academic concern, and changes made to address any deficiencies.
INCA has had an intense focus on math improvement since the last charter renewal. Instructional staff
have had intense professional development from both OBL and external providers in teaching math and
analyzing math performance. The math curriculum was renewed with a more intense focus on the
identification of essential standards and critical vocabulary, and the vertical alignment of content.
In the past two years, INCA has utilized Math XL as a supplementary instructional tool for helping ensure
students’ 6-12 are getting sufficient practice and application of math concepts. This year, a new
formative benchmark assessment was adopted, Renaissance Star Assessments (INCA). The benchmark
assessment program is instrumental in supporting INCA in properly assessing content knowledge and
skills, and then providing appropriate content to help close the gaps. Freckle Math, in addition to Math
XL, will be used for these purposes beginning in 2020-21 with students grades 3-12.
Page 156. If academic performance has resulted in a rating of ‘Falls Far Below’ on any Quality indicator
in the Ball State Academic Framework during the charter term, please provide the school’s
assessment of those results and describe what has been done, and is planned to improve
academic performance.
INCA
INCA has adopted Renaissance Star Assessments and Freckle Math to help identify and intervene with
students who are not making expected yearly growth in both ELA and Math. INCA is using these
programs with grades 3-10. Additionally, our instructional staff for ELA and Math are continually refining
our curriculum to ensure high expectations, rigor and practice are woven throughout each course in ELA
and Math. INCA has a robust MTSS cycle for all grade levels. INCA has math and ELA interventionists
who are assigned to work with students who are scoring at the urgent level in ELA/Math, according to
Renaissance 360. These interventionists work in partnership with our ELA and math teachers to ensure
struggling students get the support and practice needed to work towards mastery of skills and concepts.
While INCA has improved on the state’s A-F accountability, scoring a D for the first time in 2018, INCA
continues to understand the importance of improving their letter grade. Deep data analysis and year-
long improvement strategies, such as cohort maintenance and the use of ELA/Math benchmark
assessments and interventionists, are utilized as part of INCA’s continual growth plan.
Graduation is the top academic goal for INCA. INCA, as described in other sections, made strong
improvements to their graduation rate over the last 3 years. INCA continues to positively impact the
graduation of their students using a strong, rigorous curriculum, MTSS cycles for skill and knowledge
gaps, quarterly cohort maintenance to ensure students who have left the school have the appropriate
cohort exit code and documentation and an internal program, Choices, to help accelerate credit
attainment for our 11th and 12the grade students.
Additionally, through INCA’s IDOE School Improvement Grant, awarded for 2020-2023, INCA will be
working with Equitable Education Solutions. The goals for this work include alignment and mapping of
Core Curriculum, K-12; professional development for all staff around cultural competency and
instructional best practices for all students; the improvement of assessments, specifically towards
increasing the depth of knowledge; and the development and implementation of a graduate profile.
INCC
Graduation is the top academic goal for INCC. INCC has made improvements to their graduation rate in
the last year. INCC continues to positively impact the graduation of their students using a strong,
rigorous curriculum, MTSS cycles for skill and knowledge gaps, quarterly cohort maintenance to ensure
students who have left the school have the appropriate cohort exit code and documentation, and career
planning and training which helps students actualize how graduation can be of benefit to their life
beyond high school.
In the 2021-2022 school year, INCC will also utilize the Choices program for their severely credit
deficient 11th and 12th grade students (more than 1 year off-track with credit attainment). Choices is an
internal program, housed at INCA. This program, with approval through the IDOE Alternative Education
district enrollment rule, will be open to both schools’ students who fit the need for at-risk alternative
placement for accelerated credit attainment.
Page 16IV. STAKEHOLDER DIAGNOSTIC
Recommended surveys to complete this diagnostic: Climate and Culture Surveys for Students and
Parents, with option of customized questions
1. Which area(s) indicate the overall highest and lowest levels of satisfaction?
Each year, we survey INCA and INCC parents to get their feedback on our program and help identify
what we’re doing well and how we can improve. Our parents review the school on several criteria
including student progress, teacher support, and quality of the curriculum. 2,637 INCA parents and 282
INCC parents completed the survey. For INCA, the areas that indicate the overall highest levels of
satisfaction include the Academic experience:
• 94.2% of parents agree strongly or agree that the curriculum is high quality
• 94.2% of parents agree strongly or agree that the use of computer and EMS is improving the
learning experience
• 91.5% of parents agree strongly or agree that they are satisfied with the variety of learning
activities provided by the program
For INCA, the areas that indicate the overall lowest levels of satisfaction include:
• 26% of parents think we can improve upon providing opportunities for interactions with other
families
• 32% of parents think we can make our curriculum more challenging
• 25% of parents would like to personalize the curriculum more to fit the learning demands and
interests of their child
For INCC, the areas that indicate the overall highest levels of satisfaction include the Academic
experience:
• 96.8% of parents agree strongly or agree that the curriculum is high quality
• 98.9% of parents are satisfied with the amount of contact their child has with CA teachers
• 97.2% of parents are satisfied with the CA program
For INCC, the areas that indicate the overall lowest levels of satisfaction include:
• 33% of parents think we can make our curriculum more challenging
• 19% of parents think we can improve upon providing opportunities for interactions with other
families
• 15% of parents would like to personalize the curriculum more to fit the learning demands and
interests of their child
2. Which of the above reported findings are consistent with findings from other sources (e.g.
surveys, observations, anecdotal, third party reviews), please explain.
Each year, we survey INCA and INCC students to get their feedback on our program and help identify
what we’re doing well and how we can improve. Our students review the school on several criteria
including student progress, teacher support, and quality of the curriculum. 710 INCA students and 29
INCC students completed the survey. For INCA, the areas that indicate the overall highest levels of
satisfaction include the Academic experience:
• 88% of students agree strongly or agree that the curriculum is high quality
Page 17• 82% of students agree strongly or agree that the use of computer and EMS is improving the
learning experience
For INCA, the areas that indicate the overall lowest levels of satisfaction include:
• 29% of students think we can make our curriculum more challenging
For INCC, the areas that indicate the overall highest levels of satisfaction include the Academic
experience:
• 96% of students agree strongly or agree that the curriculum is high quality
• 91% of students agree strongly or agree that the use of computer and EMS is improving the
learning experience
For INCC, the areas that indicate the overall lowest levels of satisfaction include:
• 26% of students think we can make our curriculum more challenging
In summary, the student satisfaction survey backs up the parent satisfaction survey with similar
statistical findings. In addition, in a recent school year, 1,107,974 lesson ratings were submitted by
parents and students attending schools supported by Connections Academy, with an average rating
of 4.31 out of five stars. This rating further shows that curriculum is high quality.
3. What are the implications and/or challenges related to any negative stakeholder
perceptions?
In addition to our most important stakeholders, the students we serve each day, INCA and INCC has
many other stakeholders including teachers, parents, and community members. Consistently, all virtual
schools are lumped into one bucket in terms of important stakeholders in the community and/or
legislative arenas. It is not a fair or accurate assumption that all virtual school performance, mission, and
ethos is the same. It has been a challenge to differentiate between quality virtual schools and those that
do not prioritize quality.
4. How will survey findings inform school improvement plans? What actionable steps will be
taken based on survey results?
In our agreement with OBL, an expert educator known as a Director of Schools from the Partner School
Leadership Team (PSLT) is available to support INCA and INCC. The Director of Schools supports INCA
and INCC with improvement planning as well as monitoring, advising, and training.
OBL is constantly working on improving the Connections Academy curriculum. The most recent initiative
has been enhancing student’s learning with new courses developed using the latest research to deliver
engaging and interactive instruction. Each new course meets state standards and presents the concepts
and skills necessary for the subject. There are upgrades in both course content and the way students will
interact with the material, including:
• Peer instruction videos that make lessons appealing (research shows that learning from a peer is
more meaningful for students, making this a powerful and effective learning tool).
• Multiple ways to learn in each lesson, so your student uses various strategies to explore material
and gain understanding
• Critical-thinking and problem-solving practice built into lessons
• Integrated social and emotional learning lessons on topics such as goal setting, positive social
interaction, and healthy attitudes
Page 18V. ORGANIZATIONAL AND FINANCIAL DIAGNOSTIC
A. Organizational
1. Provide a reflection of the school’s governance and organizational performance over the past
charter term. Describe any anticipated changes to the governance and management of the
school, including but not limited to board composition, board member roles, member
recruitment, committee structure, and/or amendments to by-laws.
INCA and INCC are actively recruiting for a fifth Board member to have an odd number for quorum and
voting purposes. The Board has a long history of recruitment and small Board member numbers,
primarily due to the in-person Board meeting requirement. Due to COVID-19, the Board has been
meeting virtually on a month-to-month basis with state approval, but intends to continue meeting in
person after COVID-19 pandemic ceases. There are no anticipated changes to the committee structure.
The Board does not expect to revise the terms of the INCA and INCC School Board’s composition as
defined within Article II, Section II of the by-laws.
2. Please specify whether the board intends to contract or terminate a contract with an
education service provider (ESP), educational management organization (EMO), or charter
management organization (CMO).
No, we do not intend to terminate our contract with OBL, our educational service provider. We
contracted with OBL during the original term and the renewal in 2015 and intend to continue to contract
with the same education service provider.
a. (OPTIONAL) If Yes, please describe evidence illustrating an effective working relationship
with an ESP, and describe the ESP’s roles and responsibilities in relation to the school’s
management and governing board; describe how the governing board holds the operator
accountable for specific academic, operational or financial outcomes from the agreed upon
contract.
b. (OPTIONAL) If Yes, please describe any anticipated changes to service contract or provider
over the next charter term, including, but not limited to, intentions to terminate your
contractual relationship with your management organization. If terminating, describe in
detail the plans for carrying out the primary operational and educational activities for which
the service provider had been responsible.
The Board is not anticipating any significant changes to service contract or provider over the next
charter term.
3. Describe the current condition of the school’s facility, and its capacity to serve students.
Discuss any anticipated changes in facilities needs and/or location, which includes any
changes to lease terms and/or building plan. If the facility is leased, how does the board
oversee the terms of the lease agreement?
INCA facility is located at 6640 Intech Boulevard, Suite 250 and Suite 260A in Indianapolis, Indiana. INCC
is a full-time virtual school and shares administrative space with INCA. INCA as leaseholder today,
occupies 8.235 sq. ft. of office space that is expiring June 30, 2021. INCC also has a PO Box address. On
10/29/2020, the INCA and INCC Board approved to move forward with downsizing the office space as
the majority of work has shifted to a virtual-first workplace. The relocation will be within the existing
building to a smaller suite on the first floor. The proposed rent is market competitive with potential
savings by relocating prior to June 2021 lease expiration. The Board approves any real estate
transactions such as signing a lease agreement and governs the operations of the school, but leave daily
Page 19You can also read