MAPPING OF UTCI IN LOCAL SCALE (THE CASE OF WARSAW) - WGSR UW
←
→
Page content transcription
If your browser does not render page correctly, please read the page content below
Prace i Studia Geograficzne
                                                         2011, T. 47, ss. 275–283

Krzysztof Błażejczyk
University of Warsaw,
Faculty of Geography and Regional Studies,
Department of Climatology
00–927 Warszawa, ul. Krakowskie Przedmieście 30
e-mail: kblazejczyk@uw.edu.pl

                   MAPPING OF UTCI IN LOCAL SCALE
                       (THE CASE OF WARSAW)

                       Kartowanie UTCI w skali lokalnej
                          (na przykładzie Warszawy)

Streszczenie. W opracowaniu przedstawiono zróżnicowanie przestrzenne warun-
ków biotermicznych w Warszawie. Jako miarę warunków biotermicznych zastosowa-
no nowy wskaźnik obciążeń cieplnych człowieka UTCI. Do obliczenia wartości UTCI
zastosowano uproszczoną formułę matematyczną:
UTCI* = 3,21 + 0,872 · t + 0,2459 · Mrt – 2,5078 · v – 0,0176 · RH
gdzie: t oznacza temperaturę powietrza (ºC), Mrt – średnią temperaturę promieniowa-
nia (ºC), v – prędkość wiatru 10 m nad gruntem (m·s–1), a RH – wilgotność względną
powietrza (%).
Do wygenerowania map i wykonania analiz przestrzennych zastosowano program
IDRISI Tajga. Zróżnicowanie przestrzenne UTCI* określono dla kilku scenariuszy
pogodowych:
– pochmurno (lub słonecznie), t = 10ºC, RH = 50%, v = 8 m·s–1,
– pochmurno (lub słonecznie), t = 20ºC, RH = 50%, v = 4 m·s–1,
– pochmurno (lub słonecznie), t = 30ºC, RH = 80%, v = 2 m·s–1.
Stwierdzono wyraźny wpływ różnych typów użytkowania terenu na kształtowanie w ich
obrębie warunków biotermicznych określonych za pomocą wskaźnika UTCI. Zróżni-
cowanie to jest szczególnie widoczne podczas pogody chłodnej i wietrznej oraz gorącej
i wilgotnej. Wyróżniają się obszary leśno-parkowe, które łagodzą warunki chłodu oraz
gorąca.

Key words: UTCI, Warsaw, GIS, recreational potential, bioclimatic conditions
Słowa kluczowe: UTCI, Warszawa, GIS, potencjał rekreacyjny, warunki bioklimatyczne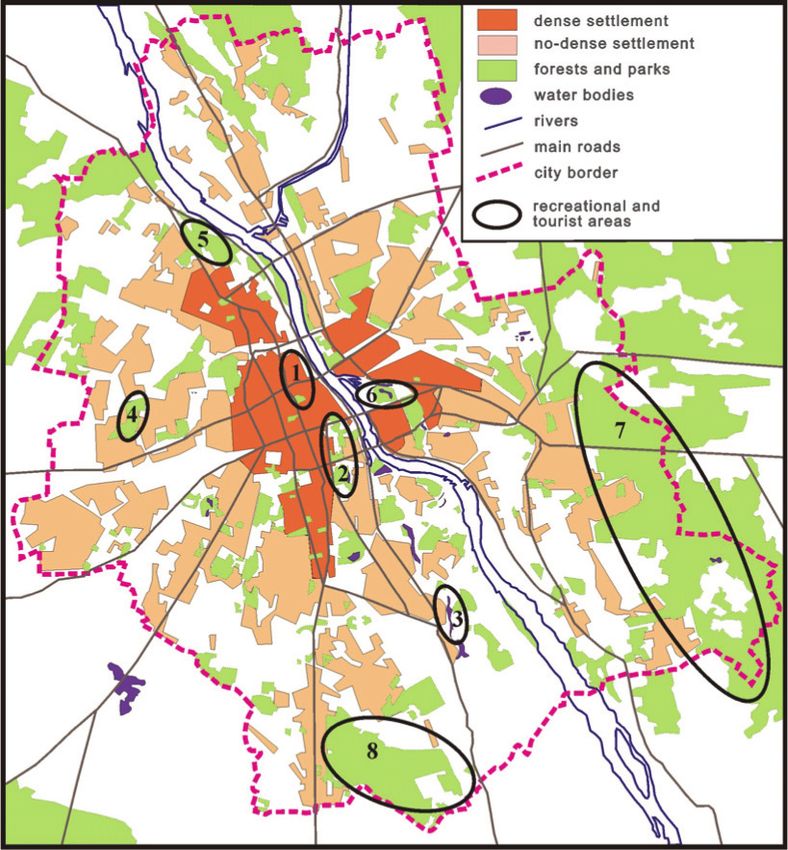
276 Krzysztof Błażejczyk
INTRODUCTION
The recent bioclimatic research should provide detail information regarded
actual impacts of ambient environment on human organism. This issue is es-
pecially important for recreational and tourism purposes. Both activities should
bring us satisfaction and relaxation. Meteorological conditions are important
agents of well being in man (Blazejczyk 2007). They can support our mental-
and-physical comfort or they can be limiting factors for outdoor activity (Scott,
Dowson 2007). Local factors also play important role in creating climate felt by
man (Kunert 2010).
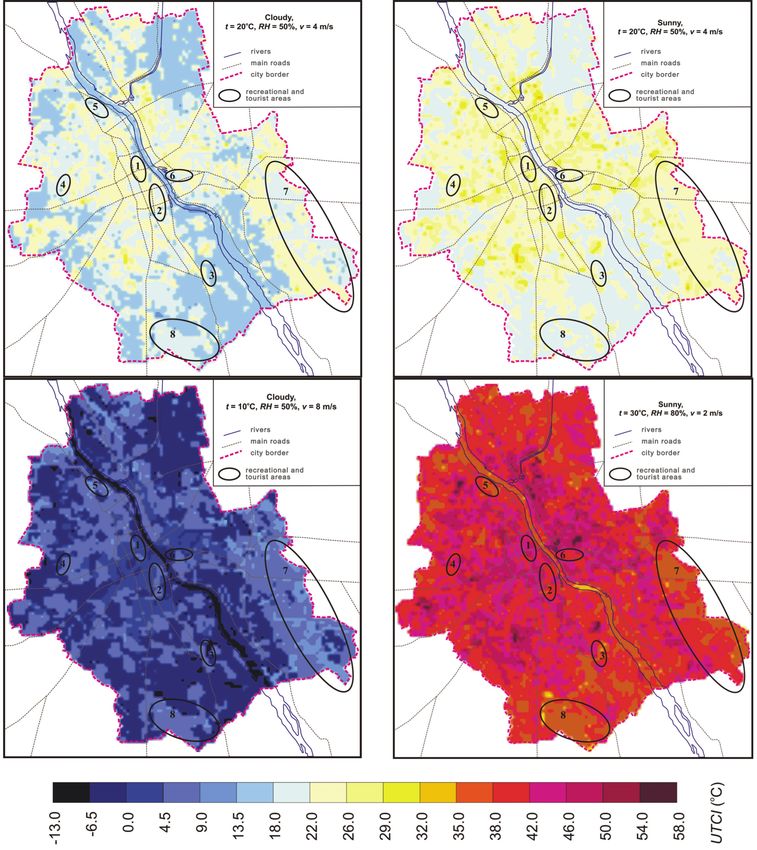
Fig. 1. Principal components of land use in Warsaw and main recreational and tourist
areas: 1 – Old Town, 2 – Royal Parks, 3 – Wilanów Royal Residence, 4 – winter sport
centre, 5 – forest park, 6 – football stadium (for Euro 2012), 7, 8 – protected forests
Ryc. 1. Podstawowe elementy zagospodarowania terenu w Warszawie oraz główne ob-
szary aktywności rekreacyjnej i turystycznej: 1 – Stare Miasto, 2 – Łazienki, 3 – Wila-
nów, 4 – Szczęśliwice, 5 – Bielany, 6 – Park Skaryszewski i Stadion Narodowy, 7 – Ma-
zowiecki Park Krajobrazowy, 8 – Las Kabacki
Thus, the evaluation of bioclimatic conditions in recreational and tourism
areas, both temporal and spatial is very important in tourism information. The
aim of the paper is to present spatial differentiation of biothermal conditions in
Warsaw at various weather scenarios. The special attention will be paid for main
recreational and tourist areas in Warsaw (Fig. 1). The places mostly visited by
tourists are: Old Town, Royal Parks, Wilanów and football stadium where Euro
Mapping of UTCI in local scale (the case of Warsaw) 277
Cup 2012 will take place. Also, the residents of Warsaw practice their daily and
weekend recreation in areas marked at figure 1.
The aim of the paper is to present the background and operational proce-
dures used for creating local scale bioclimatic maps of Universal Thermal Cli-
mate Index (UTCI).
METHODS
For the assessment of biothermal conditions the new developed Universal
Thermal Climate Index UTCI was used. The UTCI represents air temperature
of the reference conditions (i.e. no solar and thermal radiation, no wind, relative
humidity of 50%) with the same physiological response as the actual conditions
(Blazejczyk et al., 2010). The UTCI is a new bioclimate index, developed in the
frame of COST Action 730. It assesses heat stress in man outdoor during mild
walking (4 km·h–1).
The calculations were made as a part of Geographical Information System
created for Warsaw with the use of IDRISI Tajga software package (Kozłowska-
Szczęsna et al. 1996). The system consists of three groups of layers: basic envi-
ronmental layers (land use, types of relief, ground moisture, surface tempera-
ture), basic topoclimatic layers (global solar radiation, air temperature, wind
speed, air humidity) and bioclimatic layers (mean radiant temperature, UTCI).
Values of particular meteorological components were calculated by reclassifica-
tion of environmental layers and reinterpretation of LANDSAT surface tem-
perature. Bioclimatic variables were calculated for various weather scenarios for
summer season. In the present paper the following weather scenarios are dis-
cussed:
– cloudy (or sunny), air temperature of 10C, air humidity of 50%, wind speed
of 8 m·s–1,
– cloudy (or sunny), air temperature of 20C, air humidity of 50%, wind speed
of 4 m·s–1,
– cloudy (or sunny), air temperature of 30C, air humidity of 80%, wind speed
of 2 m·s–1.
For the calculations of Universal Thermal Climate Index the following sim-
plified equation (UTCI*) was applied:
UTCI* = 3,21 + 0,872 · t + 0,2459 · Mrt – 2,5078 · v – 0,0176 · RH (1)
where: t is air temperature (C), Mrt is mean radiant temperature (C), v is wind
speed at 10 m above ground (m·s–1), RH is relative humidity of air (%).
Simulated UTCI* values were also compared with UTCI calculated on the
base of observed meteorological data.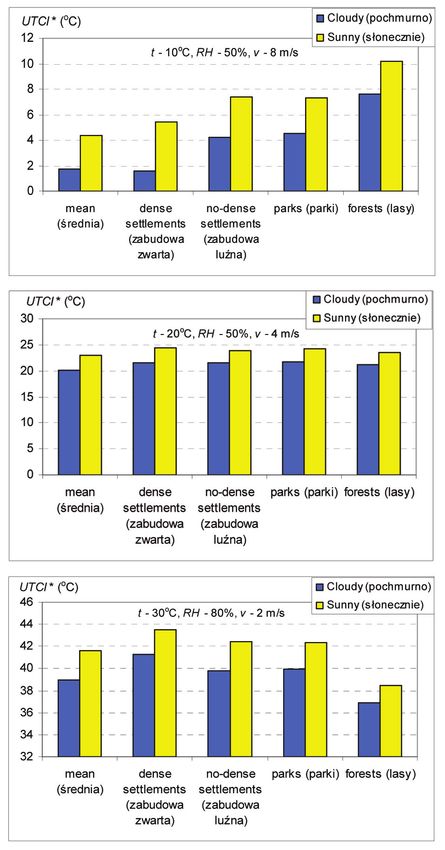
278 Krzysztof Błażejczyk
RESULTS
Warsaw is a city with an area of about 500 km2 and with significant differ-
entiation of land use (Fig. 2).
Fig. 2. Area of various land use types in Warsaw
Ryc. 2. Powierzchnia zajmowana przez różne typy użytkowania terenu w Warszawie
About 243 km2 is a built-up area (28% no-dense and 22% dense settlements).
Forests cover about 13% of city area. 85 km2 is still used for agriculture as
meadows and fields. Relatively great area (about 60 km2, i.e. 12%) is used for
transport system (roads and railways). For tourism and recreational purposes
the forests and city parks are mainly used. Tourists are concentrated in the
centre of the city (dense settlement) where Old Town, museums and theatres
are located. The another tourist place, the Wilanów Royal Residence, is located
in the south part of the city with no-dense settlements. Daily recreational activ-
ity of Warsaw’s citizens is practice in parks and forests.
When comparing biothermal conditions in selected types of land use in
various weather scenarios we can notice that the greatest spatial differentiation
of UTCI* is observed during low air temperature and strong winds. The mean
UTCI* value for whole city area is about 2C in cloudy and 4C in sunny weath-
er. In particular recreationally used types of landscape UTCI* is significantly
higher, especially inside forests (Fig. 3). On the other hand during high air tem-
perature forests reduce sensible temperature of about 5–6C in comparison to
city centre. Hot, sunny and humid weather is mostly stressed for tourists in the
city centre. During weather with moderate temperature, humidity and wind
speed there are not significant differences between tourist and recreation areas
in Warsaw.Mapping of UTCI in local scale (the case of Warsaw) 279
Fig. 3. Mean values of UTCI* in selected types of land use in various weather scenarios
Ryc. 3. Średnie wartości UTCI* w wybranych typach użytkowania terenu w różnych
scenariuszach pogody
The spatial distribution of UTCI* categories are presented on figure 4. The
smallest differentiation of heat stress is observed at moderate temperature
(20ºC), humidity (50%) and wind speed (4 m·s–1). Independent on cloudiness
UTCI* values are at majority of city area within the range of “no thermal stress”
(9–26ºC). In sunny summer days moderate heat stress (26–32ºC) can be found
only inside industrial and very dense settlement areas. During extreme weath-
er conditions complicated city structure create great spatial differentiation of
biothermal conditions. At cloudy, cool and windy weather UTCI* in the city
downtown can fall down to moderate cold stress range. On the other hand dur-280 Krzysztof Błażejczyk
Fig. 4. Spatial distribution of UTCI* in Warsaw in selected weather scenarios
Ryc. 4. Rozkład UTCI* w Warszawie w różnych warunkach pogodowych
ing sunny, hot, humid and calm weather several hot spells with extreme heat
stress are found in the city centre.
The specificity of bioclimatic conditions in Warsaw is also well seen when
considering what kind of heat stress predominates in various types of land use
in different weather conditions. During cool and windy weather in dense set-
tlements moderate cold stress can occur at about 40% of their area. At the same
weather at no-dense settlement and in the parks only at 21–24% of their areasMapping of UTCI in local scale (the case of Warsaw) 281
moderate cold stress is observed. However, slight cold stress predominates at
70–74% of those landscapes. In the forests, moderate cold stress is very rare.
However, we can experience no thermal stress at more then 36% of forested.
During the weather of moderate temperature, humidity and wind speed UTCI*
represented thermoneutral zone (18–26C) predominate in all studied types of
land use; depending on solar radiation at 80–93% of considered areas have
optimal conditions for tourism and active recreation areas (Tab. 1).
Table 1. Percentage of areas with specific UTCI* range in selected types of land use in
Warsaw
Tabela 1. Procentowy udział obszarów reprezentujących różne zakresy UTCI* w wy-
branych typach użytkowania terenu w Warszawie
Cloudy Sunny
settlements
settlements
settlements
settlements
UTCI*
no-dense
no-dense
Weather
scenario
range (°C)
forests
forests
dense
dense
parks
parks
mean
mean
–13 ÷ –6.5 4.3 1.0 1.4 0.6 1.3 0.1 0.1 × × 0.3
–6.5 ÷ 0 42.6 38.3 23.0 20.0 5.2 33.7 6.5 16.9 5.2 4.9
RH – 50%,
v – 8 m·s–1
t – 10°C,
0 ÷ 4.5 9.1 27.6 4.1 11.6 1.2 16.2 38.5 8.7 21.3 1.6
4.5 ÷ 9 35.9 32.0 66.9 59.4 56.0 12.5 30.1 15.4 29.7 5.5
9 ÷ 13.5 8.0 1.2 4.5 8.4 36.0 36.4 24.7 57.5 41.9 84.9
13.5 ÷ 18 0.1 × × × 0.2 1.1 0.1 1.4 1.9 2.8
9 ÷ 13.5 0.6 0.2 0.1 × 1.0 × × × × ×
13.5 ÷ 18 33.2 9.5 17.2 6.5 5.3 × × × × ×
RH – 50%,
v – 4 m·s–1
t – 20°C,
18 ÷ 22 32.2 44.1 27.0 48.4 54.3 38.9 13.1 21.8 14.8 17.2
22 ÷ 26 32.0 44.7 54.4 40.6 38.7 45.7 63.2 57.7 65.8 76.2
26 ÷ 29 1.8 1.5 1.3 4.5 0.5 13.0 20.4 19.2 14.8 5.9
29 ÷ 32 0.1 × × × 0.2 2.3 3.3 1.3 4.5 0.5
32 ÷ 35 × × × × × 0.1 × × × 0.2
26 ÷ 29 0.0 0.1 × × 0.1 × × × × ×
29 ÷ 32 0.6 0.3 × × 0.9 0.1 × × × 0.5
32 ÷ 35 13.9 3.9 4.5 8.4 14.1 0.7 0.2 0.1 × 0.9
RH – 80%,
v – 2 m·s–1
t – 30°C,
35 ÷ 38 34.4 17.9 23.8 23.9 66.0 17.8 3.7 2.1 9.0 51.6
38 ÷ 42 29.0 26.8 55.8 46.5 14.9 43.3 30.1 48.6 52.3 39.5
42 ÷ 46 17.3 47.5 8.7 11.0 3.2 22.5 41.3 36.1 19.4 6.0
46 ÷ 50 4.3 3.3 7.2 9.0 0.7 13.5 23.6 11.7 12.3 1.1
50 ÷ 54 0.6 0.2 0.1 1.3 0.1 1.7 1.0 1.3 6.5 0.4
54 ÷ 58 × × × × × 0.4 × 0.1 0.6 ×
Categories of UTCI* observed in present studies: from –13 to 0 – moderate cold stress, 0–9 – slight
cold stress, 9–18 – no thermal stress, 18–26 – no thermal stress (thermoneutral zone), 26–32 – moderate
heat stress, 32–38 – strong heat stress, 38–46 – very strong heat stress, > 46C – extreme heat stress282 Krzysztof Błażejczyk
At the weather with weak winds and high air temperature and humidity
bioclimatic conditions are most stressful for tourism and active recreation. In
settled areas as well as in parks located in the city centres very strong heat stress
predominates. Only inside the forests bioclimatic conditions are relatively mild-
er and strong heat stress is the most frequent range of UTCI*.
The simulated values of UTCI* were validated with the use of experimental
data taken from field experiments carried out in Warsaw. For this data full ver-
sion of UTCI was calculated with the use of BioKlima©2.6 software package.
Four types of landscapes were chosen: street canyon in downtown, rural area,
forest and river beach. Figure 5 gives two examples of field research. Data from
street canyon and rural area represent sunny day in autumn (October). There
is well seen higher UTCI in the city centre then in its vicinity, especially in the
night hours. During the day UTCI in street canyon is periodically lower then
at open area. It is due to low Sun altitude that cause great shadows in the street
bottoms. This is the phenomenon that was found in UTCI* simulations for cool,
windy weather (Fig. 4).
The second example represents sunny summer day (July) with relatively
high temperature as well as moderate humidity and weak wind. In such condi-
Fig. 5. Daily courses of UTCI in selected types of land use in Warsaw
Ryc. 5. Przebieg dobowy UTCI w wybranych dniach października i lipca w niektórych
typach zagospodarowania terenuMapping of UTCI in local scale (the case of Warsaw) 283
tions street canyon, forest and river beach were examined. The highest UTCI
was observed in street canyon. At river beach and in forest its values were
significantly lower. An interested founding was that forest was the coolest type
of landscape, of about 3–5C cooler then river bank. Also this experimental
data well fit to simulations made for hot, humid weather (see Fig. 4).
CONCLUSIONS
The use of Geographical Information System gives great possibility to pro-
vide spatial distribution of biothermal conditions, expressed by UTCI* index,
in various scales and types of land use. The UTCI* simulations made for Warsaw
show great spatial differentiation of heat stress in various weather scenarios. It
is especially well seen during cool and windy weather as well as at hot, humid
and calm conditions. The greatest differences are observed between city centre
and forests. While in cool weather forests are significantly warmer then the city
centre then in hot weather they are cooler that other types of city landscape.
GIS simulations of UTCI are well correlated with its values calculated on
the base of observed meteorological data. It is especially seen in street canyons
and forests.
References
Błażejczyk K., 2007, Weather limitations for winter and summer tourism in Europe. [in:]
A. Matzarakis, Ch. de Freitas, D. Scott (eds.), Developments in Tourism Climatol-
ogy, Commission on Climate, Tourism and Recreation International Society of Bio-
meteorology, Freiburg, 116–121.
Błażejczyk K., Broede P., Fiala D., Havenith G., Holmér I., Jendritzky G., Kampmann B.,
Kunert A., 2010, Principles of the new Universal Thermal Climate Index (UTCI)
and its application to bioclimatic research in European scale. Miscellanea Geo-
graphica, 14, 91–102.
Kozłowska-Szczęsna T., Błażejczyk K., Krawczyk B., 1996, Atlas Warszawy. 4. Środowisko
fizycznogeograficzne – niektóre zagadnienia (Atlas of Warsaw, vol. 4, Geographical
environment). PAN IGiPZ (in Polish), Warszawa.
Kunert A., 2010, Modeling of UTCI index in various types of landscape. [in:] A. Mat-
zarakis, H. Mayer, F-M. Chmielewski (eds.), Proceedings of the 7th Conference on
Biometeorology, Berichte des Meteorologischen Instituts der Albert-Ludwigs-Uni-
versität Freiburg, 20, 302–307.
Scott D., Dowson J., 2007, Climate change vulnerability of the US Northeast ski industry.
[in:] A. Matzarakis, Ch. de Freitas, D. Scott (eds.), Developments in Tourism Clima-
tology, Commission Climate, Tourism and Recreation, International Society of Bio-
meteorology, Freiburg, 191–198.You can also read