Market Access - Forest and Wood Products Australia
←
→
Page content transcription
If your browser does not render page correctly, please read the page content below
Market Access

  Estimating the benefits of an emissions
     reduction fund method for the use of
                timber products in buildings

    Project number: PRA541-2021           June 2021

Level 11, 10-16 Queen Street
Melbourne VIC 3000, Australia
T +61 (0)3 9927 3200 E info@fwpa.com.au
W www.fwpa.com.au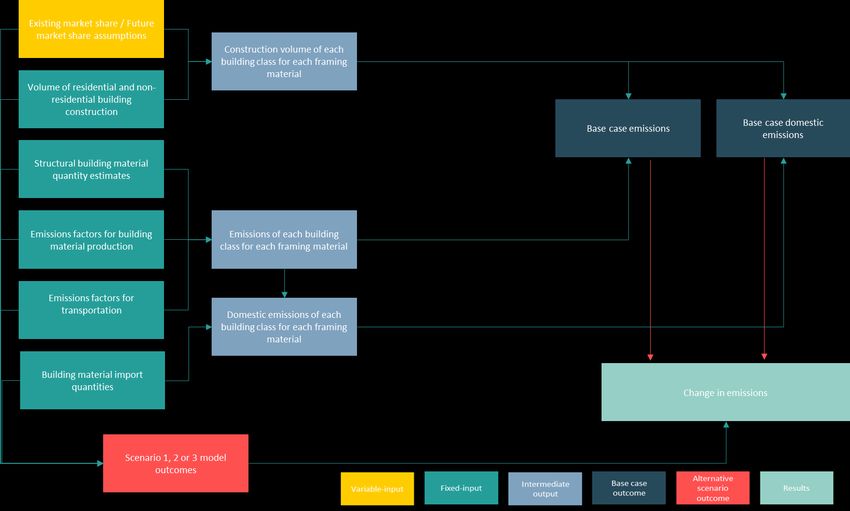
Estimating the benefits of an emissions reduction fund
  method for the use of timber products in buildings

                             Prepared for

                   Forest & Wood Products Australia

                                  by

         Mitchell Perry, Lili Pechey, Boris Lam, Jim Binney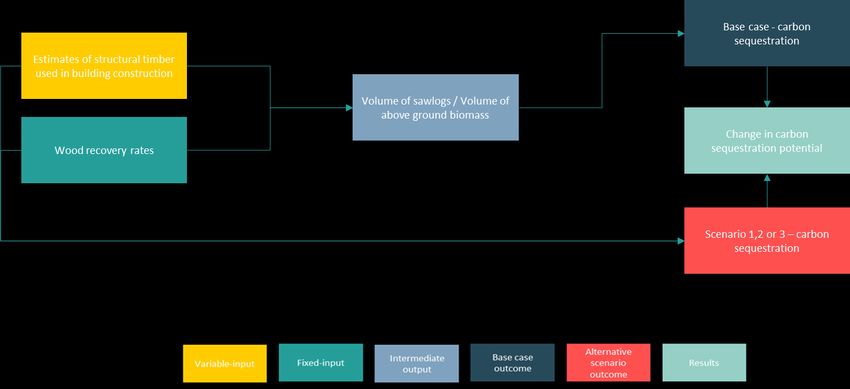
Publication: Estimating the benefits of an emissions reduction fund
             method for the use of timber products in buildings

Project No:             PRA541-2021

IMPORTANT NOTICE

This work is supported by funding provided to FWPA by the Department of Agriculture, Water
and the Environment (DAWE).

© 2021 Forest & Wood Products Australia Limited. All rights reserved.

Whilst all care has been taken to ensure the accuracy of the information contained in this publication,
Forest and Wood Products Australia Limited and all persons associated with them (FWPA) as well as
any other contributors make no representations or give any warranty regarding the use, suitability,
validity, accuracy, completeness, currency or reliability of the information, including any opinion or
advice, contained in this publication. To the maximum extent permitted by law, FWPA disclaims all
warranties of any kind, whether express or implied, including but not limited to any warranty that the
information is up-to-date, complete, true, legally compliant, accurate, non-misleading or suitable.

 To the maximum extent permitted by law, FWPA excludes all liability in contract, tort (including
negligence), or otherwise for any injury, loss or damage whatsoever (whether direct, indirect, special
or consequential) arising out of or in connection with use or reliance on this publication (and any
information, opinions or advice therein) and whether caused by any errors, defects, omissions or
misrepresentations in this publication. Individual requirements may vary from those discussed in this
publication and you are advised to check with State authorities to ensure building compliance as well
as make your own professional assessment of the relevant applicable laws and Standards.

 The work is copyright and protected under the terms of the Copyright Act 1968 (Cwth). All material
may be reproduced in whole or in part, provided that it is not sold or used for commercial benefit and
its source (Forest & Wood Products Australia Limited) is acknowledged and the above disclaimer is
included. Reproduction or copying for other purposes, which is strictly reserved only for the owner or
licensee of copyright under the Copyright Act, is prohibited without the prior written consent of FWPA.

ISBN: 978-0-9586704-2-5

Researcher/s:

Natural Capital Economics Pty Ltd (‘NCE’)

Mitchell Perry, Lili Pechey, Boris Lam, Jim Binney

Final report received by FWPA in June 2021

Forest & Wood Products Australia Limited
Level 11, 10-16 Queen St, Melbourne, Victoria, 3000
T +61 3 9927 3200 F +61 3 9927 3288
E info@fwpa.com.au
W www.fwpa.com.au
EXECUTIVE SUMMARY
Forest and Wood Products Australia contracted Natural Capital Economics to assess the potential
benefits of an Emissions Reduction Fund (ERF) method for the use of sustainable structural timber
products in buildings. The introduction of such a method has the potential to directly assist Australia
in reducing its greenhouse gas emissions by incentivising greater use of sustainable timber in the
structural components of residential and non-residential buildings in place of more emissions
intensive building materials, like steel and concrete.
The introduction of the proposed ERF method may also lead to an increase in Australia’s carbon
sequestration potential through an increase in the domestic supply of softwood sawlogs. An increase
in supply is predicated on increased sawlog demand placing upward pressure on sawlog prices and
incentivising investment in domestic sawlog supply.
Key findings from the study include:
• A 1% upward shift in the market share of structural timber in place of steel and concrete, in class
1, class 2 (below 9 storey) and non-residential buildings over the period of 2021 to 2050 would
reduce emissions by 1.3 Mt CO2-e in total and 1.0 Mt CO2-e domestically.
• The domestic emissions reduction from a 1% upward shift is equivalent to 0.03 Mt CO2-e annually
over the assessment period. A 10% and 20% increase in market share over this timeframe is
estimated to have a ten and twentyfold effect on the level of emissions reductions.
• A 1% upward shift in the market share of structural timber will require a 5.3 million m3 increase in
above ground tree biomass between present day and 2050. This biomass has the potential to
sequester 4.7 Mt CO2-e, which equates to 0.15 Mt CO2-e of reduced emissions annually.
Annual emissions reductions from a 1% increase in the market share of timber combined with
potential additional annual carbon sequestration is equivalent to 2.2% of the abatement purchased by
the Clean Energy Regulator in 2020. When these emissions reductions are combined (direct and
indirect emissions reductions), the emissions reductions from carbon sequestration account for about
80% of the total estimated emissions reductions from the proposed ERF method. However, there is
less certainty associated with emissions reductions from carbon sequestration than with the emissions
reductions from greater use of sustainable timber. This is because an increase in sawlog supply is
dependent on softwood sawlog prices increasing sufficiently to stimulate additional domestic
plantation investment.
Estimating the benefits of an ERF method for the use of timber products in buildings iiiCONTENTS
Executive summary iii
1 Background and approach 3
1.1 Background 3
1.2 Scope and approach 3
Direct emissions model 3
Indirect emissions model 4
2 Results 8
2.1 Direct emissions reductions from increased use of structural timber 8
2.2 Indirect emissions reductions from increased supply of sawlogs 9
2.3 Australian context 11
2.4 Limitations 12
3 Conclusion 14
References 15
Appendix A - Emissions reduction results by building class 18
Appendix B – Model inputs 19
Direct emissions reductions model inputs 19
Indirect emissions reductions model inputs 28
Appendix C – Case studies 29
The consequences of timber losing market share in class 1 buildings. 29
The potential of wood midrise buildings to reduce Australia’s carbon emissions. 29
FIGURES
Figure 1. Direct emissions model framework 6
Figure 2. Indirect emissions framework 7
Figure 3. Estimated total and domestic emissions reductions with increased market share of structural timber 9
Figure 4. Estimated indirect emissions reductions through time 10
TABLES
Table 1. Estimated total emissions reductions results (direct emissions) 8
Table 2. Building material imports as a percentage of the total building material used in building construction. 8
Table 3. Estimated domestic emissions reductions results (direct emissions) 9
Table 4. Estimated indirect emissions reductions results 10
Table 5. Estimated increases in above ground timber biomass 11
Estimating the benefits of an ERF method for the use of timber products in buildings 1Table 6. Emissions reductions in relation to activity of the Clean Energy Regulator 12
Table 7. Midpoint direct emissions reduction results by building class (Mt CO2-e) 18
Table 8. Midpoint indirect emissions reduction results by building class (Mt CO2-e) 18
Table 9. Volume of building materials inputs 19
Table 10. Imported building material inputs 22
Table 11. Emissions inputs 23
Table 12. Construction volume inputs 25
Table 13. Market share inputs 26
Table 14. Indirect emissions reductions model inputs 28
Table 15. Increase carbon emissions associated with timber losing 10% market share to steel between 2021
and 2050 (Mt CO2-e) 29
Table 16. Emissions reduction associated with an upward shift in the market share of structural timber in
midrise buildings between 2021 and 2050 (Mt CO2-e) 30
Estimating the benefits of an ERF method for the use of timber products in buildings 21 BACKGROUND AND APPROACH
1.1 Background
Forest and Wood Products Australia (FWPA) contracted Natural Capital Economics (NCE) to assess the
potential benefits of an emissions reduction fund (ERF) method for the use of sustainable structural
timber products in buildings. The benefits of such a method would be in the form of greenhouse gas
(GHG) emissions reductions being mainstreamed within national carbon accounting.
The introduction of this type of method has the potential to incentivise greater use of structural
timber in residential and non-residential building construction and reduce the use of more emissions
intensive building materials by allowing ERF participants to claim Australian carbon credit units (ACCU)
for associated emissions reductions. The ability to claim ACCUs is expected to create a relative
reduction in the price of structural timber compared to competing materials and is expected to
increase demand for structural timber products. Increases in demand may also incentivise greater
investment in the supply of sustainable domestic plantation timber, which would in turn increase
Australia’s carbon sequestration potential.
1.2 Scope and approach
To evaluate the benefits of the proposed ERF method, this study has investigated the reductions in
carbon emissions that can be achieved through an increase in the use of structural timber in class 11,
class 22 (below 9 storeys) and non-residential buildings (i.e. the estimated direct emissions reductions).
This study has also considered how an increase in structural timber demand and wood use could help
to increase carbon sequestration in Australian forests and plantations (i.e. the estimated indirect
emissions reductions).
This study has involved high-level desktop analysis, drawing on publicly available data, with limited
data validation. Two linked economic models were developed to calculate the direct and indirect
emissions reductions that could potentially be achieved between present day and 2050. In the models,
a range of values are used for most inputs which provides a range of results. This approach is used to
address uncertainty around the exact value of each input.
Direct emissions model
The direct emissions model calculates the estimated reductions in emissions that would occur from an
upward shift in the market share of structural timber in building construction over the period between
present day and 2050. This reflects a substitution of timber for steel or concrete building inputs.
The direct emissions model considers three scenarios, a 1% (scenario 1), 10% (scenario 2) and 20%
(scenario 3) uplift in market share for timber. These scenarios reflect a low, mid, and high outcome.
For class 1 buildings, market share is assumed to be taken exclusively from steel due to the limited
market share of concrete in these buildings. For class 2 and non-residential buildings, increased
market share of timber is assumed to be taken from both steel and concrete.
The direct emissions model does not consider the emissions reductions available from replacing
concrete or steel with timber in high rise (9 storey and above) residential buildings or for alterations
and additions works on existing buildings. It also only considers the emissions reductions achieved by
using timber instead of steel or concrete and not other structural building materials, like brick. Except
1
Domestic or residential buildings – single, standalone single houses and horizontally attached houses, such as terrace houses,
row houses or townhouses.
2
Domestic apartment buildings.
Estimating the benefits of an ERF method for the use of timber products in buildings 3for brick in class 1 buildings, other structural building materials have relatively low levels of market
share.
Direct emissions reductions are estimated in terms of volume (Mt CO2-e) and present value.
Furthermore, they are reported as total emissions reductions (i.e. ignoring national borders) and as
domestic emissions reductions. This is an important distinction as it is only emissions reductions that
occur in Australia which are eligible for ACCUs, but total emissions reductions are more reflective of
the transnational nature of climate change.
The direct emissions model framework is shown in Figure 1. Key inputs categories into the direct
emissions model include:
• Estimated market share of structural building materials. For class 1 and class 2 (up to 3
storeys) buildings, present day market share is based on estimates reported in Australian
Construction Insights (2018). In the absence of national data, market share for class 2 buildings
(above 3 storeys) and non-residential buildings is based on market share in Victoria. This was
determined through analysis of the Victorian Building Authority’s (2018; 2019; 2020) permit data,
which includes information on frame material. Market share in Victoria is expected to be similar to
market share elsewhere in Australia. However, in Western Australia there is expected to be greater
use of double brick as a building material than in Victoria.
• Volume of residential and non-residential building construction between present day and
2050. Present day residential construction volumes are based on the number of building
approvals and dwelling size data from the Australian Bureau of Statistics (ABS 2021-a; 2018). For
non-residential construction, ABS (2021-b) data on the national value of building approvals by
sector were divided by Rawlinsons (2020) estimates of the cost of constructing different types of
non-residential buildings to estimate the present day construction volume. The estimated growth
in construction volumes to 2050 is primarily based on a construction forecast to 2035 by BIS
Oxford (n.d.).
• Estimated quantities of structural building materials used in building construction. Building
material estimates are based on building material quantities reported in published lifecycle
assessments (see reference list) as well as FWPA estimates based on the quantity of material used
by the building construction industry and volumes of construction.
• Emissions factors relating to the production of building materials. These emissions factors are
based on data in published literature (see reference list).
• Emissions factors relating to the transportation of building materials. These emissions factors
are based on data in published literature. The transportation distance between the production of
the building material and the location of the building construction site was assumed to be
between 10 and 50 km.
• Estimates of the quantity of building materials being produced overseas. These estimates are
based on ABS data from input-output tables as well as other industry and government sources on
the quantity of domestic production and imported products (see reference list).
Indirect emissions model
The indirect emissions model estimates the potential increase in carbon sequestration in Australian
forests and plantations as a result of a 1% (scenario 1), 10% (scenario 2) and 20% (scenario 3) uplift in
market share for timber. The model uses estimates of the change in timber use from the direct
emission model and converts these to sawlog and above-ground tree biomass equivalent volumes
before determining the potential amount of embedded carbon. Indirect emissions reductions are
estimated in terms of volume (Mt CO2-e) and present value.
The indirect emissions model framework is outlined in
Estimating the benefits of an ERF method for the use of timber products in buildings 4Figure 2. Key input categories into the indirect emissions model include:
• Estimates of wood use from the direct emissions model.
• Wood recovery rates as presented in Downham, Gavran & Frakes (2019), Ximenes, Gardner &
Kathuria (2008), and Ximenes & Grant (2012).
• Estimates of embedded carbon in wood from ABARES (2013)
Estimating the benefits of an ERF method for the use of timber products in buildings 5Figure 1. Direct emissions model framework
Estimating the benefits of an ERF method for the use of timber products in buildings
6Figure 2. Indirect emissions framework
Estimating the benefits of an ERF method for the use of timber products in buildings
72 RESULTS
2.1 Direct emissions reductions from increased use of structural timber
The results of the direct emissions analysis for total emissions reductions are shown Table 1. It
indicates that a 1% increase in structural timber market share in class 1, class 2 and non-residential
buildings is estimated to reduce total emissions by between 0.8 and 2.6 Mt CO2-e (megatonnes of
carbon dioxide equivalent) between present day and 2050. The present value of these emissions is
estimated to be between AUD9.5 and AUD37.2 million with the low estimate based on the current
ACCU price and the high estimate based on achieving an ACCU price of $100/tonne CO2-e by 2050. A
10% (scenario 2) and 20% (scenario 3) increase in market share over this timeframe is estimated to
have a ten and twentyfold effect on the level of emissions reductions and the present value of
emissions.
Table 1. Estimated total emissions reductions results (direct emissions)
Increase in market share of Estimated emissions reductions (Mt CO2-e) Estimated present value ($ million)
timber to 2050
Low Mid High Low Mid High
1% (Scenario 1) 0.8 1.3 2.6 9.5 14.4 37.2
10% (Scenario 2) 8.5 13.4 26.3 95.2 144.3 371.6
20% (Scenario 3) 16.9 26.2 50.9 187.9 281.4 715.8
When only domestic emissions are considered the benefit of the proposed ERF method decreases.
This is because, under this model, the emissions associated with producing building materials are
excluded for imported products3. This makes the emissions of building materials appear lower than
they actually are. The assumptions associated with the percentage of each building material imported
are presented in Table 2.
Table 2. Building material imports as a percentage of the total building material used in building
construction.
Building material Residential building construction Non-residential building construction
Low Mid High Low Mid High
Cement (for concrete)4 3.0% 3.8% 9.2% 1.8% 2.3% 9.2%
Steel 20.0% 25.0% 30.0% 30.2% 37.7% 45.3%
Timber 9.3% 11.7% 28.0% 9.3% 11.7% 50.0%
The results of the direct emissions analysis for domestic emissions reductions are shown in Table 3.
They estimate that a 1% increase in structural timbers market share may reduce domestic emissions
by between 0.7 and 2.1 Mt CO2-e between present day and 2050. The present value of these
emissions is estimated to be between AUD7.8 and AUD29.4 million.
3
Only emissions reductions that occur in Australia are eligible for ACCUs
4
Cement is imported to create concrete. Cement manufacturing is estimated to account for 85% of the embodied energy of
concrete (Marceau, Nisbet & VanGeem, 2007)
Estimating the benefits of an ERF method for the use of timber products in buildings 8Table 3. Estimated domestic emissions reductions results (direct emissions)
Increase in market share of Estimated emissions reductions (Mt CO2-e) Estimated present value ($ million)
timber to 2050
Low Mid High Low Mid High
1% (Scenario 1) 0.7 1.0 2.1 7.8 11.3 29.4
10% (Scenario 2) 6.9 10.4 20.8 77.6 112.7 294.5
20% (Scenario 3) 13.9 20.5 40.3 153.8 220.0 568.4
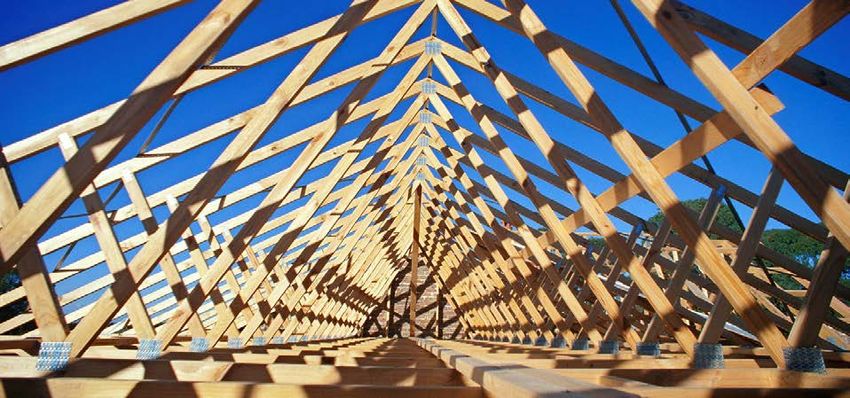
A comparison of total and domestic emissions reductions across time is shown in Figure 3.
Importantly, the results shown represents the midpoint of the estimates. Annual domestic emissions
reductions may be higher if a lower level of building materials are imported.
1.20
1.00
0.80
Mt CO2-e
0.60
0.40
0.20
0.00
2021 2026 2031 2036 2041 2046
1% - Total 10% - Total 20% - Total
1% - Domestic 10% - Domestic 20% - Domestic
Figure 3. Estimated total and domestic emissions reductions with increased market share of structural
timber
Across building classes, the biggest reduction in emissions for a 1% increase in market share is
attributed to non-residential buildings. This comes despite the volume of non-residential building
construction being about half that of class 1 building construction (on a square meter basis). The
increased use of structural timber in non-residential buildings is estimated to account for 66% of the
domestic emissions reductions, while class 1 buildings and class 2 buildings are estimated to account
for 25% and 9% respectively. Estimated emissions reduction by building class are present in Appendix
A.
There are multiple reasons why an increase in market share of timber in non-residential buildings is
expected to result in the biggest impact. In non-residential construction (as opposed to class 1),
timber buildings result in greater carbon emissions reductions per square meter, relative to steel
buildings. This is due to a greater differential in the volume of materials being used, which is partly
attributed to changes in design associated with higher storey buildings. Additionally, in non-
residential construction, timber is assumed to take market share from concrete, which is the most
carbon intensive of the three structural building material investigated.
2.2 Indirect emissions reductions from increased supply of sawlogs
ABARES estimated plantation and native forest sawlog availability and sawlog demand in Australia to
2050. Based on this data and the level of sawlog exports in 2019-20 (4.4 million m3), the average
Estimating the benefits of an ERF method for the use of timber products in buildings 9annual supply shortfall of softwood sawlogs is calculated to be between 3.4 and 6.3 million m3. For hardwood sawlogs, supply outweighs demand by an average of 0.8 million m 3. Based on this data, additional carbon sequestration in Australia could be achieved by increasing the supply of softwood sawlogs to meet demand. Sustainable structural timber products for use in buildings are mostly derived from softwood sawlogs (ABARES, 2016; 2019; 2020; Burns et al, 2015; Whittle, Lock & Hug, 2019). The results of the indirect emissions reductions analysis are presented in Table 4 and Figure 4. They indicate that a 1% increase in structural timber’s market share in class 1, class 2 and non-residential buildings has the potential to increase carbon sequestration by between 3.9 and 8.9 Mt CO2-e between present day and 2050. The present value of the CO2-e abatement is estimated to be between AUD42.4 and AUD129.6 million. Associated increases in above-ground tree biomass for each scenario are presented in Estimating the benefits of an ERF method for the use of timber products in buildings 10
Table 5.
Table 4. Estimated indirect emissions reductions results

 Increase in market share of      Estimated emissions reductions (Mt CO2-e)             Estimated present value ($ million)
 timber to 2050
                                       Low             Mid              High            Low          Mid            High

 1% (Scenario 1)                       3.9             4.7               8.9            42.4         51.3           129.6

 10% (Scenario 2)                      38.6            47.3             89.2           424.2        513.2          1295.8

 20% (Scenario 3)                      73.7            90.8             170.5          797.2        972.9          2462.7

               4.0

               3.5

               3.0

               2.5
    Mt CO2-e

               2.0

               1.5

               1.0

               0.5

               0.0
                     2021      2026                 2031             2036              2041            2046

                                      1% increase             10% increase       20% increase

Figure 4. Estimated indirect emissions reductions through time

Estimating the benefits of an ERF method for the use of timber products in buildings                                          11
Table 5. Estimated increases in above ground timber biomass
Increase in market share of timber to 2050 Estimated increase in above ground timber biomass (million m3)
Low Mid High
1% (Scenario 1) 4.4 5.3 10.0
10% (Scenario 2) 43.8 53.4 100.5
20% (Scenario 3) 83.9 102.7 192.2
2.3 Australian context
To put these emissions reductions in context, the range of emissions reductions targets that Australia
(at a national and state level) is (or was) committed to achieving has been considered.
Australia’s current emissions target for 2030 is set at 26 to 28% below 2005 levels. In 2005, Australia’s
GHG emissions were estimated to be 615.5 Mt CO2-e, which set the target level to 443.1 Mt CO2-e
(28%). To meet this target, Australia will be required to achieve abatement of between 56 and 123 Mt
CO2-e between 2021 and 2030 (DISER, 2020; 2020-a).
Before it was repealed, the Clean Energy Act 2011 set out an objective for Australia to reduce its GHG
emissions by 80% from 2000 levels by 2050 (Climate Change Authority, n.d.). In 2000, Australia’s GHG
emissions were estimated to be 544 Mt CO2-e, which set the target level to about 110 Mt CO2-e. This
is a reduction in emissions of about 400 Mt CO2-e on 2020 emissions levels (DISER, 2020-a).
In Australia, all states and territories are aiming to achieve net-zero emissions by 2050. This means
that by 2050, any emissions will need to be offset by carbon storage. This aim is in alignment with the
Paris Agreement (Climate Council, 2020).
In September 2020, the Clean Energy Regulator (CER) purchased 8.7 Mt CO 2-e abatement via the 10th
and 11th ERF auctions. This brings the total abatement purchased by the CER since 2015 to 200 Mt
CO2-e. Of this purchased abatement, 29.5% has been delivered to date (CER, 2020).
Table 6 presents the emissions reductions results of this study relative to the activity of the CER. When
both direct (domestic) and indirect emissions reductions are considered, the proposed ERF method
has the potential to reduce emissions at an annual rate equivalent to between 2.2 and 41.7% of the
total abatement purchased in 2020. If timber achieves a higher market share than 20%, this rate will
increase.
Based on the three scenarios presented, between present day and 2050, the proposed ERF method
could potentially reduce emissions in Australia by an amount equivalent to between 2.9 and 55.7% of
the total abatement purchased to date by the CER. This data suggests that an ERF method for the use
of sustainable structural timber products in buildings could make a considerable contribution to
Australia achieving its GHG emissions reductions targets.
Estimating the benefits of an ERF method for the use of timber products in buildings 12Table 6. Emissions reductions in relation to activity of the Clean Energy Regulator
Increase in market share of timber to 2050
Estimated average annual emissions Estimated emissions reductions to
reductions (Mt CO2-e) 2050 (Mt CO2-e)
Emissions model 1% 10% 20% 1% 10% 20%
Direct emissions (domestic) 0.03 0.35 0.68 1.04 10.44 20.52
Indirect emissions 0.16 1.58 3.03 4.73 47.26 90.82
Total emissions reductions 0.19 1.92 3.71 5.77 57.69 111.34
Total emissions reductions as a % of 2.2% 21.6% 41.7% n/a
abatement purchased in 2020
Total emissions reductions as a % of n/a 2.9% 28.8% 55.7%
abatement purchased to date
2.4 Limitations
The models developed for this study include a number of assumptions and have relied on imperfect
data.
Key limitations of this study include:
• Estimated building materials contained in timber, concrete and steel buildings are a key driver
of the results of this study. However, they are based on a limited number of studies. To strengthen
the model and its outcomes, a larger sample size of building material estimates for each class of
building and for each framing type is required.
• Imported materials is a critical variable to the direct emissions model. It influences the
proportion of the total emissions reductions eligible to earn ACCUs. All else equal, the higher the
level of building material imports, the less influence the proposed ERF method will have in
reducing Australia’s GHG emissions under existing accounting standards. To improve the
robustness of results, a more detailed analysis of the origin of building materials is required.
• Sawlog supply and carbon sequestration - This study has not considered the likelihood of an
increase in the domestic supply of softwood sawlogs driven by an increase in demand and price of
structural timber or factored in the time required for Australia to increase domestic supply. An
increase in the domestic supply of sustainable timber products is required for the proposed
method to be able to deliver an indirect emissions reduction benefit in the form of increased
carbon sequestration.
An increase in demand for sawlogs may not increase the price of sawlogs or domestic sawlog
supply. Firstly, a price increase may not be high enough to stimulate additional plantation
investment. Secondly, an increase in demand may be met by an increase in imports, or with
sawlogs previously earmarked for export. These alternative scenarios have the potential to limit
the indirect emissions reductions benefit associated with the proposed ERF method.
The proposed ERF method still has the potential to provide an indirect emissions reductions
benefit if Australia’s domestic supply of sawlogs remains constant. This would occur if its
Estimating the benefits of an ERF method for the use of timber products in buildings 13introduction increased the global supply of sustainably sourced5 sawlogs which would in turn
increase global carbon sequestration capacity. However, under current carbon accounting
standards, this benefit would not assist Australia in meeting its emissions targets.
• Change in market share - The introduction of the proposed ERF method is expected to cause an
upward shift in market share for the use of structural timber. However, there may also be a
gradual increase in market share through time that occurs as builders’ transition from using other
materials to timber. The models developed for this study only accounts for a one-off upward shift.
The faster market share increases, the more emissions reductions which will be achieved by 2050,
and vice versa.
• Plantation forestry ERF method - The plantation forestry ERF method outlines how ACCUs can
be claimed for stored carbon in plantation forests. As part of calculating eligible carbon
abatement, carbon emissions from management activities like harvesting must be considered
(ERF, 2021). According to Tucket et al (2009), the production of an average softwood log creates
26 kg CO2-e per m3. This carbon accounting approach means that for some wood products (those
coming from plantation forests and using the plantation forestry method) part of their emissions
are offset against sequestered carbon. This makes the net emissions of these products lower and
suggests that the results of this study may underestimate the direct emissions reductions
associated with using timber in buildings. The degree to which emissions reduction are
underestimated will depend on the volume of timber products coming from plantation forests
using the plantation forestry method to claim carbon credits as well as the quantity of emissions
associated with management activities.
To account for uncertainty, results have been presented as a range rather than discrete estimates with
the low and high estimates set at 10% and 90% confidence intervals, respectively. These ranges have
been determined from sensitivity analysis using a Monte Carlo simulation with 50,000 iterations.
5
Sustainable timber refers to timber that has been harvested responsibly from well managed forests that are continuously
replenished (Accoya, n.d.)
Estimating the benefits of an ERF method for the use of timber products in buildings 143 CONCLUSION The introduction of the proposed ERF method has the potential to assist Australia to reduce its GHG emissions and meet its emissions target in 2030. This would occur by incentivising greater use of structural timber and potentially from increasing the supply of domestic softwood sawlogs and carbon sequestration potential from Australia’s forestry estate. The proposed ERF method is expected to increase demand for structural timber. It is also expected to create a significant emissions reductions benefit. The magnitude of this benefit will depend on how quickly and to what degree timber can take market share from other structural building materials and which building materials lose market share. This high-level analysis has attempted to present realistic scenarios relating to changes in market share, however, more detailed investigation and analysis would improve the accuracy of the assumptions. Of the two benefits assessed (direct and indirect emissions reductions), the indirect emissions reductions associated with an increase in sawlog supply and carbon sequestration has potential to be the most beneficial from an emissions reductions perspective. However, further investigation is required to understand what size increase in domestic timber supply is achievable. The likelihood of the proposed ERF method resulting in an increase in supply will depend on the magnitude of any change in demand and price, as well as the economics of plantation timber which must consider land values, the price of carbon and international competitiveness. Estimating the benefits of an ERF method for the use of timber products in buildings 15
REFERENCES
Accoya. (n.d.). What is sustainable timber? Retrieved from
https://www.accoya.com/uk/sustainability/production/
Anti-Dumping Commission. (2017). Analysis of Australia’s steel manufacturing and fabrication markets
report to the commissioner of the anti-dumping commission. Retrieved from
https://www.industry.gov.au/sites/default/files/2019-
05/adc_steel_fabrication_report_november_2017.pdf
Australian Bureau of Agricultural and Resource Economics and Sciences. (2020). Summary - Tabular
data of Australian forest and wood products statistics: March and June quarters 2020 summary
statistics. Retrieved from https://www.agriculture.gov.au/abares/research-topics/forests/forest-
data#australian-forest-and-wood-products-statistics
Australian Bureau of Agricultural and Resource Economics and Sciences. (2019). Australian forest and
wood products statistics. Retrieved from
https://www.agriculture.gov.au/sites/default/files/sitecollectiondocuments/abares/publications/afwps-
overview-sep-dec-2018-v1.0.0.pdf
Australian Bureau of Agricultural and Resource Economics and Sciences. (2016). Australia’s plantation
log supply 2015–2059. Retrieved from
https://www.agriculture.gov.au/sites/default/files/sitecollectiondocuments/abares/publications/AustPl
antLogSupply2015_2059_v.1.0.0.pdf
Australian Bureau of Agricultural and Resource Economics and Sciences. (2013). Australia’s State of the
Forest report. Retrieved from
https://www.agriculture.gov.au/sites/default/files/abares/forestsaustralia/documents/criterion5-
web.pdf
Australian Bureau of Statistics. (2021-a). TABLE 20. Number of Dwelling Units Approved in New
Residential Buildings, Original – Australia. Building Approvals, Australia. Retrieved from
https://www.abs.gov.au/statistics/industry/building-and-construction/building-approvals-
australia/jan-2021
Australian Bureau of Statistics. (2021-b). TABLE 51. Value of Non-residential Building Approved, By
Sector, Original - Australia. Building Approvals, Australia. Retrieved from
https://www.abs.gov.au/statistics/industry/building-and-construction/building-approvals-
australia/jan-2021
Australian Bureau of Statistics. (2020-a). Australian National Accounts: Input-Output Tables. Retrieved
from https://www.abs.gov.au/statistics/economy/national-accounts/australian-national-accounts-
input-output-tables/latest-release
Australian Bureau of Statistics. (2018). Characteristics of new residential dwellings – A 15 year
summary. Retrieved from
https://www.abs.gov.au/ausstats/abs@.nsf/Lookup/8752.0Feature+Article2Dec%202018
Australian Construction Insights. (2018). Framing material used in residential construction. Retrieved
from https://www.fwpa.com.au/images/Newsletter_Images/Statistics-
count/2018/Dec18/ACI_Structural_framing_materials_used_in_residential_building_Final__3Dec2018.pd
f
Australian Financial Review. (2021). Australian carbon prices tipped to double by 2030. Retrieved from
https://www.afr.com/policy/energy-and-climate/australian-carbon-prices-tipped-to-double-by-2030-
20210406-p57gu2

Estimating the benefits of an ERF method for the use of timber products in buildings                  16
Burns, K., Gupta, M., Davey, S., Frakes, I., Gavran, M., & Hug, B. (2015). Outlook scenarios for Australia’s
forestry sector: key drivers and opportunities. Retrieved from
https://www.agriculture.gov.au/sites/default/files/documents/OutlookAustForSectKeyDrive_20150414_
v1.0.0.pdf
Carre, A. (2011). A comparative life cycle assessment of alternative constructions of a typical Australian
house design. Retrieved from https://www.fwpa.com.au/images/marketaccess/PNA147-
0809_Research_Report_Comparative-LCA_0.pdf
Carre, A. & Crossin, E. (2015). A comparative Life Cycle Assessment of Two Multi Storey Residential
Apartment Buildings. Retrieved from https://www.fwpa.com.au/images/marketaccess/PRA344-1415-
Australand.pdf
Cement Industry Federation. (2020). Australian Cement Production. Retrieved from
https://cement.org.au/australias-cement-industry/about-cement/australias-cement-
industry/#:~:text=An%20increasing%20amount%20of%20cement,satisfy%20demand%20in%202018-
19.
Centre for Population. (2020). National population and components, 2019-20 to 2030-31. Retrieved
from https://population.gov.au/data-and-forecasts/data-and-forecasts-projections.html
Chen, D., Syme, M., Seo, S., Chan, W., Zhou, M., & Meddings, S. (2010). Development of an Embodied
CO2 Emissions Module for AccuRate. Retrieved from
https://www.fwpa.com.au/images/marketaccess/PNA161-
0910_Research_Report_Accurate_Module_0.pdf
Clean Energy Regulator. (2021). Plantation forestry method. Retrieved from
http://www.cleanenergyregulator.gov.au/ERF/Pages/Choosing%20a%20project%20type/Opportunities
%20for%20the%20land%20sector/Vegetation%20and%20sequestration%20methods/Plantation-
forestry-
method.aspx#:~:text=The%20plantation%20forestry%20method%20increases,of%20harvesting%20for
%20forest%20products.
Clean Energy Regulator. (2020). Quarterly Carbon Market Report. Retrieved from
http://www.cleanenergyregulator.gov.au/DocumentAssets/Documents/Quarterly%20Carbon%20Mark
et%20Report%20-%20Quarter%204%20December%202020.pdf
Clean Energy Regulator. (2020-a). Auction September 2020. Retrieved from
http://www.cleanenergyregulator.gov.au/ERF/Pages/Auctions%20results/September%202020/Auction
-September-2020.aspx
Climate Change Authority. (n.d.). Targets and Progress Review Issues Paper. Retrieved from
https://www.climatechangeauthority.gov.au/targets-and-progress-review-issues-paper
Climate Council. (2020). What does net zero emissions mean? Retrieved from
https://www.climatecouncil.org.au/resources/what-does-net-zero-emissions-mean/
Department of Industry, Science, Energy and Resources (DISER). (2020). Australia’s emissions
projections 2020. Retrieved from https://www.industry.gov.au/data-and-publications/australias-
emissions-projections-2020
Department of Industry, Science, Energy and Resources (DISER). (2020-a). National Greenhouse Gas
Inventory: June 2020. Retrieved from https://www.industry.gov.au/data-and-publications/national-
greenhouse-gas-inventory-june-2020
Dodoo, A. (2019). Lifecycle impacts of structural frame materials for multi-storey building systems.
Retrieved from https://sace.ktu.lt/index.php/DAS/article/view/23229
Downham, R., Gavran, M., & Frakes, I. (2019). ABARES National Wood Processing Survey. Retrieved
from

Estimating the benefits of an ERF method for the use of timber products in buildings                      17
https://www.agriculture.gov.au/sites/default/files/sitecollectiondocuments/abares/publications/Nation
alWoodProcessingSurvey2016-17_20190613_v1.0.0.pdf
FP Innovations & Ben Romanchych Consulting. (2020). Mass Timber Outlook. Retrieved from
https://softwoodlumberboard.org/wp-content/uploads/2021/03/SLB-Mass-Timber-Outlook-2021-
Final-Condensed.pdf
Greenhouse Gas Protocol. (2017). Emission Factors from Cross-Sector Tools. Retrieved from
https://ghgprotocol.org/calculation-tools#cross_sector_tools_id
John, S., Nebel, B., Perez, N., & Buchanan, A. (2008). Environmental impacts of multi-storey buildings
using different construction materials. Retrieved from https://ir.canterbury.ac.nz/handle/10092/8359
Marceau, M., Nisbet, M., & VanGeem, M. (2007). Life Cycle Inventory of Portland Cement Concrete.
Retrieved from http://large.stanford.edu/courses/2016/ph240/pourshafeie2/docs/marceau-2007.pdf
RepuTex Energy. (2021). EU levy could impose carbon price of A$65-140 on Australian exports, with
more climate tariffs to come. Retrieved from https://www.reputex.com/research-insights/eu-border-
levy-could-impose-carbon-price-of-a65-140-on-australian-companies-by-2023/
Sinclair, R. (2018). Timber versus steel: Finding facts and taking action. Presentation to FTMA
Tucker, S., Tharumarajah, A., May, B., England, J., Paul, K., Hall, M., Mitchell, P., Rouwette, R., Seo, S., and
Syme, M. Life Cycle Inventory of Australian Forestry and Wood Products. Prepared for Forest & Wood
Products Australia. Retrieved from https://www.fwpa.com.au/images/marketaccess/PNA008-
0708_Research_Report_LCI_Timber_0.pdf
Victorian Building Authority. (2020). VBA DataVic Building permits 2020. Retrieved from
https://www.vba.vic.gov.au/about/data
Victorian Building Authority. (2019). VBA DataVic Building permits 2019. Retrieved from
https://www.vba.vic.gov.au/about/data
Victorian Building Authority. (2018). VBA DataVic Building permits 2018. Retrieved from
https://www.vba.vic.gov.au/about/data
Ximenes, F., & Grant, T. (2012). Quantifying the greenhouse benefits of the use of wood products in
two popular house designs in Sydney, Australia. Retrieved from
https://www.researchgate.net/publication/257679940_Quantifying_the_greenhouse_benefits_of_the_us
e_of_wood_products_in_two_popular_house_designs_in_Sydney_Australia
Ximenes, F., Gardner, W., & Kathuria, A. (2008). Proportion of above-ground biomass in commercial
logs and residues following the harvest of five commercial forest species in Australia. Retrieved from
https://www.researchgate.net/publication/223549680_Proportion_of_above-
ground_biomass_in_commercial_logs_and_residues_following_the_harvest_of_five_commercial_forest_s
pecies_in_Australia
Whittle, L., Lock, P., Hug, B. (2019). Economic potential for new plantation establishment in Australia.
Retrieved from
https://www.agriculture.gov.au/sites/default/files/abares/documents/PlantationEstablishmentOutlook
2050_v1.0.0.pdf

Estimating the benefits of an ERF method for the use of timber products in buildings                         18
APPENDIX A - EMISSIONS REDUCTION RESULTS BY BUILDING
  CLASS
Appendix A present the result of this study by building class.

Table 7. Midpoint direct emissions reduction results by building class (Mt CO2-e)

                              Total emissions reductions (midpoint             Domestic emissions reductions (midpoint
                                           estimates)                                        estimates)

                                                      Increase in market share of timber to 2050

 Building Class                1%              10%               20%               1%              10%           20%

 Class 1                       0.3              3.3              6.1              0.3              2.6           4.7

 Class 2 (1-3 storeys)         0.0              0.2              0.6              0.0              0.2           0.5

 Class 2 (4-8 storeys)         0.1              0.9              1.8              0.1              0.8           1.6

 Non-residential               0.9              8.9              17.8             0.7              6.9           13.7

 Total                         1.3             13.4              26.2             1.0              10.4          20.5

Table 8. Midpoint indirect emissions reduction results by building class (Mt CO2-e)

                                                            Increase in market share of timber to 2050

 Building class                                    1%                           10%                       20%

 Class 1                                           2.2                          21.7                      39.0

 Class 2 (1-3 storeys)                             0.1                           0.5                      0.9

 Class 2 (4-8 storeys)                             0.2                           2.0                      3.9

 Non-residential                                   2.3                          23.0                      44.8

 Total                                             4.7                          47.3                      90.8

Estimating the benefits of an ERF method for the use of timber products in buildings                                     19
APPENDIX B – MODEL INPUTS
Appendix B present the inputs for the direct and indirect emissions models.
Direct emissions reductions model inputs
Table 9. Volume of building materials inputs
Building Framing
Description Material Low Mid High Input Units Source Assumptions
Class Material
Class 1 Concrete Concrete 1.194 1.342 1.489 1.342 t/m2 John et al.
(2008); Carre &
Class 1 Concrete Steel 0.022 0.044 0.066 0.044 t/m2 Crossin (2015);
Carre (2011);
Class 1 Concrete Wood 0.000 0.063 0.127 0.063 m3/m2 Dodoo (2019)
Class 1 Steel Concrete 0.149 0.349 0.549 0.349 t/m2 The low and high input values are
based on building material quantities
Class 1 Steel Steel 0.020 0.027 0.090 0.027 t/m2 from published lifecycle assessments.
Estimates of For Class 1, steel-steel and wood-
John et al.
the volume wood, the mid input is based on
Class 1 Steel Wood 0.003 0.013 0.023 0.013 m3/m2 (2008); Carre
of building FWPA estimates of materials used in
(2011); Dodoo
materials by residential construction based on an
Class 1 Wood Concrete 0.101 0.248 0.396 0.248 t/m2 (2019); FWPA
framing understanding of market share and
estimates
material quantity of materials used. The
Class 1 Wood Steel 0.002 0.008 0.014 0.008 t/m2 remaining mid input values reflect the
average of the low and high input
Class 1 Wood Wood 0.044 0.082 0.242 0.082 m3/m2 values
Class 2 - John et al.
Concrete Concrete 1.194 1.342 1.489 1.342 t/m2
Low (2008); Carre &
Crossin (2015);
Class 2 - Carre (2011);
Concrete Steel 0.022 0.044 0.066 0.044 t/m2
Low Dodoo (2019)
Estimating the benefits of an ERF method for the use of timber products in buildings 20Building Framing
Description Material Low Mid High Input Units Source Assumptions
Class Material
Class 2 -
Concrete Wood 0.000 0.063 0.127 0.063 m3/m2
Low
Class 2 -
Steel Concrete 0.149 0.349 0.549 0.349 t/m2
Low
Class 2 -
Steel Steel 0.020 0.055 0.090 0.055 t/m2
Low
Class 2 -
Steel Wood 0.003 0.013 0.023 0.013 m3/m2
Low
Class 2 -
Wood Concrete 0.101 0.248 0.396 0.248 t/m2
Low
Class 2 -
Wood Steel 0.002 0.008 0.014 0.008 t/m2
Low
Class 2 -
Wood Wood 0.044 0.143 0.242 0.143 m3/m2
Low
Class 2 -
Concrete Concrete 1.194 1.342 1.489 1.342 t/m2
Mid
Class 2 -
Concrete Steel 0.022 0.044 0.066 0.044 t/m2
Mid
Class 2 -
Concrete Wood 0.000 0.063 0.127 0.063 m3/m2
Mid
Class 2 -
Steel Concrete 0.149 0.349 0.549 0.349 t/m2
Mid
Class 2 -
Steel Steel 0.020 0.055 0.090 0.055 t/m2
Mid
Estimating the benefits of an ERF method for the use of timber products in buildings 21Building Framing
Description Material Low Mid High Input Units Source Assumptions
Class Material
Class 2 -
Steel Wood 0.003 0.013 0.023 0.013 m3/m2
Mid
Class 2 -
Wood Concrete 0.101 0.248 0.396 0.248 t/m2
Mid
Class 2 -
Wood Steel 0.002 0.008 0.014 0.008 t/m2
Mid
Class 2 -
Wood Wood 0.044 0.143 0.242 0.143 m3/m2
Mid
Non-
residentia Concrete Concrete 1.194 1.342 1.489 1.342 t/m2
l
Non-
residentia Concrete Steel 0.022 0.044 0.066 0.044 t/m2
l
Non-
residentia Concrete Wood 0.000 0.063 0.127 0.063 m3/m2
l
Non-
residentia Steel Concrete 0.149 0.349 0.549 0.349 t/m2
l
Non-
residentia Steel Steel 0.020 0.055 0.090 0.055 t/m2
l
Non-
residentia Steel Wood 0.003 0.013 0.023 0.013 m3/m2
l
Estimating the benefits of an ERF method for the use of timber products in buildings 22Building Framing
Description Material Low Mid High Input Units Source Assumptions
Class Material
Non-
residentia Wood Concrete 0.101 0.248 0.396 0.248 t/m2
l
Non-
residentia Wood Steel 0.002 0.008 0.014 0.008 t/m2
l
Non-
residentia Wood Wood 0.044 0.143 0.242 0.143 m3/m2
l
Table 10. Imported building material inputs
Building
Description Materials Low Mid High Input Units Source Assumptions
Type
Concrete ABS (2020-a); Cement
Residential 3.0% 3.8% 9.2% 0.038 %
(Cement) Industry Federation (2020)
ABS (2020-a);Anti Dumping
Residential Steel 20.0% 25.0% 30.0% 0.250 %
Commission (2017)
Residential Wood 9.3% 11.7% 28.0% 0.117 % ABS (2020-a) Inputs based on estimates from input-
% of
output tables (reference year 2017-
materials
18) and statistics on material imports
imported Non- Concrete
1.8% 2.3% 9.2% 0.023 % ABS (2020-a) relative to domestic production.
residential (Cement)
Non-
Steel 30.2% 37.7% 45.3% 0.377 % ABS (2020-a)
residential
Non- ABS (2020-a); FWPA
Wood 9.3% 11.7% 50.0% 0.117 %
residential estimate
Estimating the benefits of an ERF method for the use of timber products in buildings 23Building
Description Materials Low Mid High Input Units Source Assumptions
Type
Residential Concrete 68% 85% 100% 0.850 % Marceau et al. (2007)
Residential Steel 80% 100% 100% 1.000 % NCE assumption
% of Cement accounts for approximately
Residential Wood 80% 100% 100% 1.000 % NCE assumption
emissions 85% of concrete emissions. As such,
occurring the domestic emissions of concrete
overseas Non- are assumed to be reduced by 85%
Concrete 68% 85% 100% 0.850 % Marceau et al. (2007)
for imports residential when cement is imported.
Non-
Steel 80% 100% 100% 1.000 % NCE assumption
residential
Non-
Wood 80% 100% 100% 1.000 % NCE assumption
residential
Table 11. Emissions inputs
Description Material Low Mid High Input Units Source Assumptions
Concrete (Standard, precast, t CO2-e / t Carre (2011); Carre &
0.10 0.16 0.23 0.16
blocks) of material Crossin (2015)
t CO2-e /
Product Steel (Structural, reinforcing, John et al. (2010); Carre
0.45 2.02 3.60 2.02 tonne of GWP based on data in published
emissions sheet) (2011)
material LCAs.
factors
Wood (Softwood, Hardwood,
t CO2-e /m3
CLT, LVL, glulam, plywood, 0.16 0.31 0.47 0.31 Carre & Crossin (2015)
of material
particle board)
Estimating the benefits of an ERF method for the use of timber products in buildings 24Description Material Low Mid High Input Units Source Assumptions
Transport Greenhouse gas protocol
0.0001 0.0004 0.0007 0.0004 t CO2 / t.km
emissions factor (2017)
Transport
10.00 20.00 50.00 20.00 km NCE estimate
distance
Density of wood Carre & Crossin (2015);
products Wood 0.50 0.55 0.85 0.55 tonnes / m3 John et al. (2008); Chen et
transported al. (2010)
Carbon Price –
16.55 16.55 $ / t CO2e CER (2020)
present day
Carbon Price - Reputex Energy (2021);
16.55 45.00 100.00 45.00 $ / t CO2e
2050 AFR (2021)
Discount rate 0.03 0.07 0.10 0.07 %
Estimating the benefits of an ERF method for the use of timber products in buildings 25Table 12. Construction volume inputs
Description Building Class Building type Low Mid High Input Units Source Assumptions
Class 1 Houses 91,555 114,444 137,333 114,444 no.
Semi-detached, row or terrace houses,
Class 1 23,602 29,503 35,404 29,503 no.
townhouses
Construction
volume in
Class 2 - Low Apartments - In a one or two storey block 974 1,217 1,461 1,217 no.
2020
Class 2 - Low Apartments - In a three storey block ; 2,023 2,528 3,034 2,528 no.
Class 2 - Mid Apartments - In a four to eight storey block 14,396 17,995 21,594 17,995 no.
Non-residential Retail and wholesale trade buildings 4,819,947 6,024,933 7,229,920 6,024,933 $ 000'
Non-residential Transport buildings 1,246,152 1,557,690 1,869,228 1,557,690 $ 000'
Non-residential Offices 6,698,708 8,373,385 10,048,062 8,373,385 $ 000'
3 year
ABS (2020)
average
Non-residential Commercial buildings 626,299 782,874 939,448 782,874 $ 000'
Factories and other secondary production
Non-residential 915,782 1,144,727 1,373,672 1,144,727 $ 000'
buildings
Construction
value in 2020 Non-residential Warehouses 3,551,097 4,438,872 5,326,646 4,438,872 $ 000'
Non-residential Agricultural and aquacultural buildings 330,257 412,821 495,385 412,821 $ 000'
Non-residential Other industrial buildings 755,874 944,843 1,133,812 944,843 $ 000'
Non-residential Educational buildings 6,102,548 7,628,185 9,153,822 7,628,185 $ 000'
Non-residential Religious buildings 189,291 236,614 283,937 236,614 $ 000'
Non-residential Aged care facilities 1,528,096 1,910,120 2,292,144 1,910,120 $ 000'
Estimating the benefits of an ERF method for the use of timber products in buildings 26Description Building Class Building type Low Mid High Input Units Source Assumptions
Non-residential Health buildings 2,829,172 3,536,465 4,243,758 3,536,465 $ 000'
Non-residential Entertainment and recreation buildings 2,829,813 3,537,267 4,244,720 3,537,267 $ 000'
Non-residential Short term accommodation buildings 2,891,167 3,613,959 4,336,751 3,613,959 $ 000'
Non-residential Other non-residential 2,913,027 3,641,284 4,369,540 3,641,284 $ 000'
Table 13. Market share inputs
Building Framing
Description Low Mid High Input Units Source Assumptions
Class Material
Class 1 -
Concrete - - - - %
Detached
Class 1 -
Steel 0.14 0.16 0.14 %
Detached 0.11
Class 1 -
Wood 0.74 0.88 0.74 %
Detached 0.59
Australian Construction Insights
(2018)
Market share Class 2 -
Concrete 0.22 0.26 0.22 %
- 2017-18 Low 0.18
Class 2 -
Steel 0.07 0.08 0.07 %
Low 0.06
Class 2 -
Wood 0.46 0.55 0.46 %
Low 0.37
Class 2 - Victorian Building Authority Based on average market share
Concrete 0.28 0.34 0.28 %
Mid 0.23 (2020) between 2018-2020 in Victoria,
Estimating the benefits of an ERF method for the use of timber products in buildings 27Building Framing
Description Low Mid High Input Units Source Assumptions
Class Material
according to building permit
Class 2 -
Steel 0.41 0.49 0.41 % activity data
Mid 0.32
Class 2 -
Wood 0.08 0.10 0.08 %
Mid 0.07
Non-
Concrete 0.12 0.14 0.12 %
Residential 0.09
Non-
Steel 0.71 0.86 0.71 %
Residential 0.57
Non-
Wood 0.04 0.04 0.04 %
Residential 0.03
Under the base case, the market
Growth in market share of steel share of framing materials
based on data from the National remains constant except for steel
Association of Steel Housing, HIA and wood in class 1 buildings.
Class 1 Wood 0.10 0.20 0.100 %
0.05 studies and the Victorian Building Under the base case, steel
Authority as reported by Sinclair continues to take market share
(2018) from timber in Class 1 buildings
Lost market based on current trends.
share to steel
- 2050 (Base
Class 2 -
case) Wood - - %
Low
Class 2 -
Wood - - %
Mid
Non-
Wood - - %
Residential
Gain in Wood 0.0 0.010 % Class 1 - Increase wood by 1%,
market share decrease steel by 1%; Others -
Estimating the benefits of an ERF method for the use of timber products in buildings 28Building Framing
Description Low Mid High Input Units Source Assumptions
Class Material
- 2050 Increase wood by 1%, decrease
(Scenario 1, 2 steel and concrete .05%
& 3)
Wood 0.1 0.100 %
Wood 0.2 0.200 %
Indirect emissions reductions model inputs
Table 14. Indirect emissions reductions model inputs
Description Low Mid High Input Units Source
Sawlog recovery rate 0.52 0.65 0.78 0.65 % Downham, Gavran, Frakes (2019);
Ximenes, Gardner & Kathuria (2008);
Sawn timber recovery rate 0.37 0.43 0.50 0.43 % Ximenes & Grant (2012)
Carbon sequestered in wood 0.787 0.88 0.98 0.88 t CO2-e/m3 ABARES (2013)
Estimating the benefits of an ERF method for the use of timber products in buildings 29APPENDIX C – CASE STUDIES
The consequences of timber losing market share in class 1 buildings.
Timber is the dominate framing material used in class 1 building construction. In 2017/18, timber’s
markets share was estimated to be 74%. Lightweight steel is the next most common framing material.
In the same year, its market share was estimated to be 14% (Australian Construction Insights, 2018).
Historical data suggest that the market share of steel framing in residential construction is growing.
With timber being the dominate framing material used in class 1 construction, this growth is expected
to be largely at the expense of timber framing. On current trends, steels market share will be about
25% in 2050 (Sinclair, 2018)
A loss of market share for timber framing in class 1 buildings will have consequences for Australia’s
timber industry. It will also have consequences for Australia’s level of greenhouse gas emissions as the
construction of steel framed houses is estimated to produce more carbon emissions per square meter
than timber framed houses.
Using the emissions models developed for this study, the increase in carbon emissions and forgone
carbon sequestration associated with timber framing losing 10% market share to steel by 2050 has
been estimated. These estimates are presented in Table 15 and assume a linear change in market
share between 2021 and 2050.
Table 15. Increase carbon emissions associated with timber losing 10% market share to steel between
2021 and 2050 (Mt CO2-e)
Low Mid High
Net increase in emissions (total) 0.2 1.8 8.2
Net increase in emissions (domestic) 0.0 1.4 6.5
Foregone forest and plantation carbon sequestration 9.7 12.0 38.5
The potential of wood midrise buildings to reduce Australia’s carbon emissions.
In the United States, wood is the dominant structural building material used in 5 to 6 storey residential
buildings with about 60% of the market. In 7 to 8 storey residential buildings, wood’s market share is
about 30% but with an aspirational growth target of reaching more than 50% by 2035 (FP innovations
& Ben Romanchych Consulting, 2020). For similar buildings in Australia, wood’s market share is
estimated to be about 8%, with steel holding an estimated 41% market share (Victorian Building
Authority 2018; 2019; 2020). This data suggests there is an opportunity for greater use of wood to
construct midrise buildings in Australia.
Based on estimates compiled in this study, the construction of a midrise wood building would
produce only 60% of the carbon emissions associated with an equivalent steel building and about
30% of the emissions of an equivalent concrete building. Therefore, increasing the use of wood to
construct midrise building has the potential to reduce carbon emissions.
Using the emissions models developed for this study, the carbon emissions reductions and potential
carbon sequestration associated with wood achieving similar levels of market share for midrise (4-8)
building in Australia as in the United States has been estimated. These estimates are presented in
Table 16 and assume a direct upward shift of market share in 2021 until 2050. A 50% increase in
market share is estimated to reduce Australia’s emissions by 3.9 Mt CO2-e between 2021 and 2050.
Estimating the benefits of an ERF method for the use of timber products in buildings 30You can also read