Econ & Asset Allocation - February 2022 monthly outlook Theodore Roosevelt - ktbst
←
→
Page content transcription
If your browser does not render page correctly, please read the page content below
Econ & Asset Allocation
February 2022 monthly outlook

           Theodore Roosevelt

                                1
Summary : February monthly outlook

         Policy Tightening &
                                                                Sector/Style rotation                                 Valuation bargaining
          Geopolitical shift                                  Due to the global macroeconomics risk
FOMC tried to tighten their monetary policies to combat                                                             From KTBST perspective, We saw a great
the rising in inflation while the market already accept the   overwhelming, Investment tends to reduce their        discount in DM equities especially the US, EU
view that FED will raise their policy rate but the timing     market risk and duration of the portfolio by adding   due to the rate hike immunity with 2022
and size still blur while the QT projection has been          value and financial sector into their portfolio,      impressive growth outlook while the recent
mumbling around the market while in EM like KR still got      However, the primary concern for most investors       correction gave investors the opportunity to
pressure from macroeconomics like domestic rate hike          is not how much the company will grow but the         enhance portfolio in short term before FOMC
and political dreadlock which also depress Japan stock        downside it is. However, we believed that in          March 2022 meeting
market due to increases in the regional correlation           short-term valuation pressure in semiconductor
between 2 countries                                           will toned down after KR election
                                                                                                                                                                    2
Macro factor : Quantitative Tightening conclusion

                              According to the Fed meeting in December, Some committees decided to implement Quantitative
                              tightening in this year after the policy rate hike.

                                         The quantitative tightening is highly possible in this year because the most of FOMC
                                         members is hawkish stance, the rotation members in February, supported the unease policy.

                                        If the Fed provide the signal before the QT action like tapering in July 2021, Fed tend
                                        to start the balance sheet runoff in June or July 2022

                            The risky assets in period of lasted QT is highly volatility; however, the higher volatility does not
                            mean the risky assets have underperformed or turned to negative return.

                                                                                                                                     3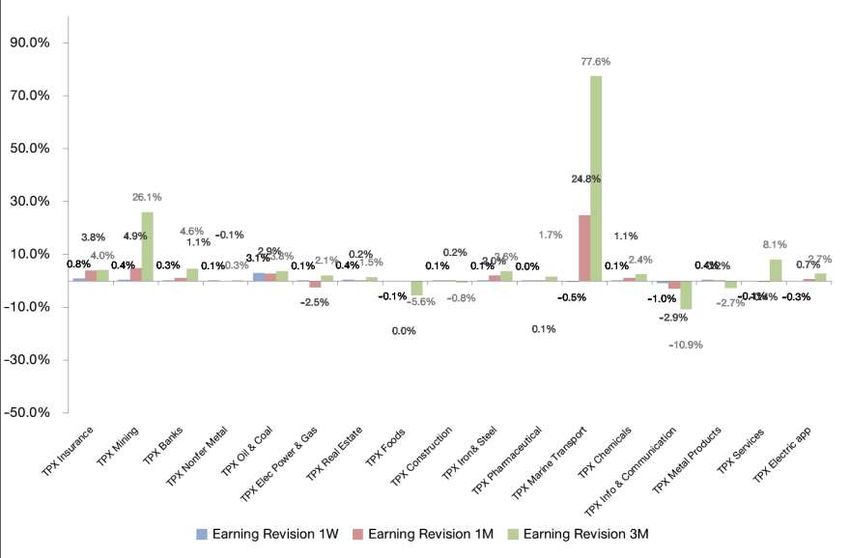
The cycle of monetary policy and this time will different
                                                                                                  The types of monetary policy
                        The current status of monetary policy tools
          10                                                                         4                                                        QT +
million

           9                                                                               QE + Rate cut        Tapering    Rate hike         Rate
                                                                                     3.5
                                                                                                                                              hike

                                                                                                                                                             The historical period of time for each policies
           8
                                                                                     3
           7
           6                                                                         2.5

           5                                                                         2
                                                                                                3 years           year         years          year
           4                                                                         1.5
           3
                                                                                     1
           2
           1                                                                         0.5     Easing is around    years Tightening is around          years
           0                                                                         0

               FED balance sheet mln USD (LHS)       Effective FED fund rate (RHS)
                                                                                                                   to combine the three types in the

                                                                                                                                                                                                               4
FOMC Rotation to be more hawkish

      2021 Committee Members                      2022 Committee Members                                Hawk vs Dove meter

Jerome H. Powel         John C. Williams    Jerome H. Powel         John C. Williams
Board of Governors      New York            Board of Governors      New York

Michelle W. Bowman      Thomas I. Barkin    Michelle W. Bowman      James Bullard          Old
Board of Governors      Richmond            Board of Governors      St. Louis            rosters            2             1     1
                                                                                          2021
Lael Brainard           Raphael W. Bostic   Lael Brainard           Esther L. George
Board of Governors      Atlanta             Board of Governors      Kansas City

Richard H. Clarida      Mary C. Daly        Christopher J. Waller   Loretta J. Mester     New
Board of Governors      San Francisco       Board of Governors      Cleveland            rosters        1                 3
                                                                                          2022
Randal K. Quarles       Charles L. Evans                            Kenneth Montgomery
Board of Governors      Chicago                                     Boston
                                                                                                   0%             50%               100%
Christopher J. Waller
Board of Governors
                                                                                                   Dove         Neutral       Hawk

                                                                                                                                           5
Quantitative Tightening brings volatility to the markets but at what cost?
                      The financial market is highest volatility in Tapering period and before QT implemented (Annualized)
100%
                                                                                                                                          88.10%
80%

60%

40%
                                              18.64%      15.55% 16.94%    17.02% 15.00%                                                           16.65%
20%    15.47%    13.11% 15.48%       12.96%                                                     14.80%
                                                                                                                                                                   9.57%
                                                                                                          0.82%         0.56%   0.00%
 0%
           MSCI DM           MSCI ACWI             MSCI EM           NASDAQ                 S&P500                10Y              BTC Index                Gold
                        QE until tapering end period (+-1Y)        1st Hike period (+-1Y)            2nd hike until QT (+-1Y)           QT period (+-1Y)

   The volatility of risky assets surge when the QE injection move to tapering and balance sheet runoff period, so the central bank is going to use the
   tapering and QT in this year, the financial market will be shaken and will be disturbed. The question for the policy makers in this round is..
                    When the QT is started
                    What a pace of QT per month?
                    How do they do the QT Autonomy and discretionary in policies
                   .What asset types do they choose in this period?

                                                                                                                                                                           6
Quantitative Tightening expectation
 ONE YEAR               JUL AUG SEP OCT NOV DEC JAN FEB MAR APR MAY JUN JUL                             Fed balance sheet unit : million USD
                                                                                        10

                                                                              million
 2021 Tapering Signal
                                                                                         9
 2021 2022                                                                               8
 Tapering Action                                                                         7                                                            Start QT
 2021 QT Signal                                                                          6
                                                                                                                                First signal for QT
                                                                                         5
 2022 1st rate hike
                                                                                         4
                                                                                         3
                                                                                                                                   Signal to halt QT May
 2022 QT Action                                                                          2                                                                       Ends QT
 expectation                                                                             1                                                                       July
                                                                                         0
             According to the J. Yellen era, the forward guidance to the
market is around 9 12 months before action. The tapering signal for this
period was announced 3 months before action, so we expected that the                    Other
proper period for                            is around June or July this                Securities, unamortized premiums and discounts, repurchase agreements, and loans
                                                                                        Coin
year while the size of QT is expected to be around 100 billion USD
                                                                                        Special drawing rights certificate account
capped per month with gradually increasing in the monthly pace                          Gold certificate account

                                                                                                                                                                           7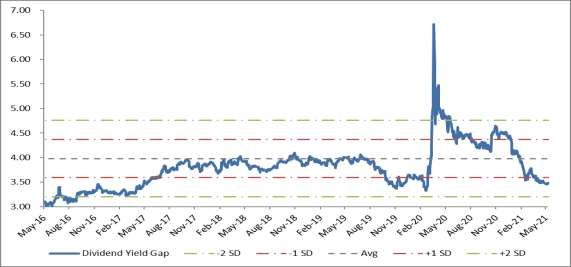
Quantitative Tightening process
                   Fed has never reached QT ceiling as it announced unit : million USD
             60
                                                                                                       In practice, Fed has never implemented QT
thousands

                                                                                         equal to the announced target The reasons are..
             40
                                                                                           The U.S. treasury bills that were expiring below the
             20                                                                          ceiling of Quantitative tightening
              0
                                                                                           The maturity of U.S. treasury bills and Mortgage-
             -20
                                                                                         backed securities expired at the same time (Red frame),
                                                                                         the expectation of the Fed is that long-term bonds
             -40                                                                         maturity is the point of time to scale down the balance
                                                                                         sheet.
             -60
                                                                                            The economic situation is one of the main factor to
             -80
                                                                                         conduct the QT implementation, e.g. the trade war in
                        Monthly Actual QT        3 Month rolling QT        QT Cap        2018-2019 pressured the central bank to halted the
            -100
                                                                                         tightening policy and Fed turned the money back to
                                                                                         economic system again (Green frame)

                                                                                                                                                   8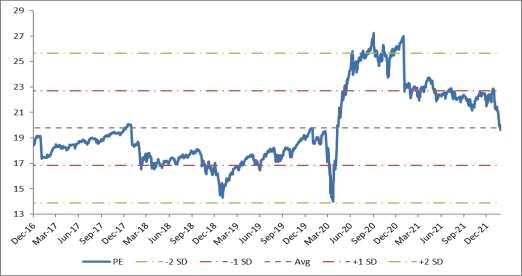
QT 2022 ≠
                   If Fed is going to implement QT the same portion to         , the overall                                  The portion of assets in
                           volume is twice the previous round (Unit : million USD)
            1500                   1,366.46
Thousands

                                                                                                                                                                   US treasury
            1000                                                                                                                                                securities 1 to 5 Y
                                                                              694.73                                                         MBS10Y

             500                                                                                                                                                       US treasury
                                                                                                                                                                     securities 5 to 10
                                                                                                                                                                              Y
               0                                                                                                                                      US treasury
                                                                                                                                                   securities over 10 Y
                                   QT 2022                                   QT 2018

The likelihood of double QT per      2022 Fed                                                                     US treasury             US treasury
                                                                            US treasury securities 1 to 5 Y                                                               MBS10Y
month increases due to the size of balance sheet                                                                securities 5 to         securities over
balance sheet doubled recently                                                                          US treasury
which expected QT per month will                                                                       securities 5
                                     2017 Fed                                                                            US treasury
be capped around 100 bln. USD balance sheet                          US treasury securities 1 to 5 Y                                                            MBS10Y
                                                                                                                      securities over 10 Y
at least
                                                          0%       10%          20%           30%             40%          50%           60%              70%       80%           90%     100%

                                                                                                                                                                                                 9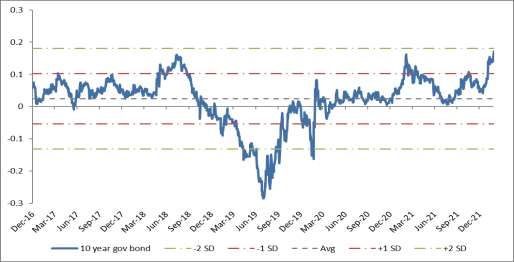
Fed turn to hawkish stance as expected
                                                           2022                      2023
                  KTBST Economics forecast
                                             KTBST   Cons         Prev.   KTBST   Cons      Prev.
                                       US            2.9          2.1             2.3        2
                      Inflation
  Base Case

                                       TH            1.1          1.2             1.7       1.3
                      Policy rate

                                       US    1.00    0.35         0.25     .      0.85      0.5
                                       TH            0.6          0.5             n.m.      0.75
                                       US            2.9          2.1             2.3        2
                      Inflation
  Hawkish Case

                                       TH            1.1          1.2             1.7       1.3
                      Policy rate

                                       US    1.25    0.35         0.75    2.      0.85       .25
                                       TH            0.6          0.5             n.m.      0.75
                                       US     2.0    2.9          2.1      2.4    2.3        2
                      Inflation
  Pandemic Case

                                       TH     0.8    1.1          1.2      1.3    1.7       1.3
                      Policy rate

                                       US    0. 5    0.35         0.25    0.75    0.85      0.5
                                       TH     0.5    0.6          0.5      0.     n.m.      0.75

                                                                                                    10
The financial market impact
10Y change (every
Trade war Change in BL (every Change in Rate (every
Easing regime Tapering 100bps from 10 R2
Tweet 1% change) 100bps) The Vector autoregressive model
weeks before)
MSCI DM
MSCI ACWI
about QE or Tapering and the negative impact of
MSCI EM rising in 10 years bond yield is not statistically
NASDAQ significant (Blue table)
S&P 500 The transition period of monetary policy to
10Y n.m. tightening stance (QT in pink table), the financial
BTC index market was more fragile to the QT
Gold announcement at least seven weeks before
QT (7 weeks Change in Rate (every 10Y change (every action, especially in the technology sector,
Trade war Change in BL (every
Tightening regime before 100bps from 1 week 100bps from 7 weeks R2 Crypto currency and gold price.
Tweet 1% change)
implement) before) before)
MSCI DM *: QT lag period for 10Y = 6 weeks , BTC = 16 weeks , Gold 7
MSCI ACWI weeks | ** : 10Y lag period for BTC = 3 weeks , Gold = no lag
MSCI EM
NASDAQ Sig. at the 99% confidence level
S&P 500 Sig. at the 95% confidence level
10Y* n.m. Sig. at the 90% confidence level
BTC*,**
Gold*,**
11QT will pressure market all along?
Mater.
1000.00%
Health
Return
Util. Health Ener.
Mater. IT
Com Ser. Con Sta. Indus. Fin.
tightening, the stock that high net profit
Fin. Indus. Con Dis. IT margin usually outperform the market. So,
Con Dis. the signal of QT period is proper to invest
Util.
1.00%
-10.00% -5.00% 0.00% 5.00% 10.00% 15.00% 20.00% 25.00% 30.00% 35.00% 40.00% in the high net profit margin stock.
EPS Growth MSCI ACWI (Technology sector has 21%) In terms of
1Y Before 1Y After Linear (1Y After) the EPS, the QT period is not statically
different to normal periods.
MSCI ACWI Growth MSCI ACWI Value
24.25% 1Y before implement 51.87% The recommendation for short-term
33.16% 6M before implement 25.49% investment is carefully to the first policy
34.41% 3M before implement 32.12% rate hike, and then we are going to
18.90% 3M after implement 26.84% overweight the technology sector in the
16.14% 6M after implement 20.57% second half of the year.
17.96% 1Y after implement 20.51%
18.13% current (17/01/2022) 17.94%
Source: KTBST
40.00% 30.00% 20.00% 10.00% 0.00% 0.00% 10.00% 20.00% 30.00% 40.00% 50.00% 60.00%
12Focus on the 1st rate hike and yield curve structure for the signal.
UST 10 years prediction for
4%
3.25%
3% 2.64%
2.13%
2% 2.57%
1.16% 2.15%
1.82%
1%
1.25% 1.18%
0%
Policy rate 3M 3Y 5Y 10Y
QT
4 rate hike without QT implemented 4 rate hike with QT implementedQT
we used the data mining to analyze the U.S. treasury bond, we found the steepening curve of UST 10 years in the rate hike cycle. On the other
hand, the UST yield curve tend to flattening, when the Fed is hiking the policy rate and running off the balance sheet together. For 2 assumptions above, we
predicted the U.S. treasury yield rate is reaching 3.25% in near term. Consequently, the growth stocks of emerging country stocks are pressuring in the first
half of this year. In contrast, The Fed is going to raise the policy rate 4 times and implement quantitative tightening that flattening the yield curve and
creating the volatility in bond market. Our base case scenarios, the U.S. treasury yield range is between 2.57% - 3.25% and the central bank will closely
manage the yield curve expectation.
13The stock markets tend to bottom-out after 1st rate hike
MSCI DM (LHS) Effective FED fund rate (RHS) 10Y Effective FED fund rate (RHS)
2400 2 6 2
5
2000 1.5 1.5
4
1600 1 3 1
2
1200 0.5 0.5
1
800 0 0 0
S&P500 (LHS) Effective FED fund rate (RHS) Gold Effective FED fund rate (RHS)
3300 2 2300 2
2800
1.5 1.5
1800
2300
1 1
1800
1300
0.5 0.5
1300
800 0 800 0
14And keep your finger crossed that FED will not do any policies mistakenly.
Recession probabilities with yield spread will increasing while the model with economics indicators still low
100%
80%
60%
40%
20%
0%
Recession Period Recession Prob of Yield Curve (RHS)
Recession Prob of Economic indicator (RHS)
15Asset classes perspective provide higher upside due to the recent correction.
2022 CME return changed update with correction from market discount turned DM more attractive
20
15
10
5
0
-5
Global DM EM US EU JP CN KR IN TH
Rf Inflation Growth Valuation Discount from YTD2022 correction
16Asset classes perspective provide higher upside due to the recent correction.
New expected return after YTD2022 correction
30
25
20
15
10
5
0
Global DM EM US EU JP CN KR IN TH
2022 previous CME expected return 2022 CME expected return after correction
17All of the markets crashed at the same time while investors mood covered in fear
Better risk adjusted return after correction to grab opportunity in tactical allocation
24
2022 previous CME expected return
22
20 2022 CME expected return after correction
Annualized Expected volatility
18
16
14
12
10
3 8 13 18 23 28
Annualized expected return
18Tightening playbook
Numbers
Scenario of rate Scale of QT Period of Method Assets
Assets impacted
s hike million USD QT of QT for QT
(times)
before the QT A B C D E
action
A 1H23
years
Maturity
DM Equities
B 694,726 2H22
2 years EM Equities
All assets
Maturity
C 2H22
2 years
sell off
assets
Growth stock
Value stock
D 4 1H22
2 years Bond
Alternative asset
1H22 Maturity
E >
2 years sell off
assets
Positive return Negative return
19Quantitative Tightening TAA roadmap
Hold equity > fixed income
March June Hold equity < fixed income
START
1 2
First rate hike, recommend Second rate hike, start to invest in DM
DM value growth/EM
September July
4 3
Third rate hike, recommend DM First QT action, move to Barbell Growth/Value
Growth/EM > Value portfolio
December Emergency cases
5 6
Fourth rate hike, recommend DM Growth/EM > Value For Yield curve is Flattening, recommend underweight
equity and hold cash at least % of portfolio
20South Korea election and stock market
National level election
Presidential elections : select the president (every five years)
• Directly elected by all citizens over the age of 18
• Plurality voting : candidate who got the most vote
are elected
• Five-year term
• Which will take place on 9 March 2022
Legislative elections : select the National Assembly (every four years) 300 members elected for a four-year term
• 253 constituency seats come from first-past-
the-post method
• 47 proportional representation seats
o 17 members come from parallel voting
method
o 30 members come from additional
• Democratic (172) • Independent (6) • Transition Korea (1)
member system
• People Power (106) • People (3) • Vacant (5)
• Justice (6) • Basic Income (1)
21List of Republic of Korea presidents
40000 5000
4500
35000
4000
30000 Moon Jae-in
Chun Doo-hwan Roh Moo-hyun Lee Myung-bak 3500
Kim Young-sam
25000
3000
Kim Dae-jung Park Geun-hye
20000 2500
2000
15000
1500
10000 election
Roh Tae-woo 1000
NIKKEI
5000
500
KOSPI
0 0
• There are only two major party in South Korea which alternately gain executive power since 1980. However, it does not imply that the president also have the legislative
power in their hand.
• There is an evidence shown the improvement of correlation between Japan stock market and Korea stock market. Besides U.S.-China trade war during 2018 there is a
conflict between Japan and Korea as well. So, we need to pay attention on the foreign policy in Japan-South Korea relations from both candidates since it could affect
the performance of both markets.
22The 20th Republic of Korea presidential election : Candidate
-myung
Yoon Seok-youl
Lee Jae-myung
People Power Party Ticket
Democratic Party Ticket
23The 20th Republic of Korea presidential election : Campaign
Foreign Consumption Industry Capital market
• Try to balance South • Raise housing supply by • Subsidize a new economy • Aim to push forward Korea
Korea-U.S. alliance 2.5 million units business stock to weight in MSCI
(security partner) and
• Deduct pre-sale ceiling • Great Digital DM instead of MSCI EM
South Korea-China
price of housing pre-sale Transformation : build • Reform Korea s equity
alliance (trade partner)
• Universal basic income data infrastructure and market
• Mainly focus on inter- expand digital space (AI,
(UBI) : KRW 1 million per
Korean cooperation than quantum technology,
person per annual / KRW 2
denuclearization of North cybersecurity,
million per person per
Korea blockchain,
Lee Jae-myung annual ( 19 -29 years old)
• Recently, Lee Jae-Myung supercomputing and
Democratic Party Ticket
met Japan ambassador semiconductors)
and ask for meeting with • Focus on a carbon
Kishida emissions tax
24The 20th Republic of Korea presidential election : Campaign
Foreign Consumption Industry Capital market
• Mainly focus on • Reduce property • Support start-ups and • Has not announced
suppress the ownership tax and real ease some restrictions to
nuclearization of North estate sales tax support the growth of
Korea by international small business
cooperation • Build housing supply by
2.5 million units • Offer tax incentives
• Enhance relationship with
United States • Help small business who
suffer from pandemic
• Increase LTV ratio to 80
Yoon Seok-youl
percent for younger age
People Power Party Ticket
groups
25The 20th Republic of Korea presidential election : Opinion polling
Yoon Seok-youl
People Power Party Ticket
Lee Jae-myung
Democratic Party Ticket
26How stock market repones with the election
15 Opinion poll Spread
Lee Jae-myung
10
Democratic Party Ticket
5 LEAD
0
-5
-10 Yoon Seok-youl
-15 People Power Party Ticket
-20
LEAD
10/21 11/21 11/21 11/21 12/21 12/21 12/21 01/22 01/22 01/22 02/22
3050 Capital Market Aspect
3000 • Lee Jae-myung pledge may favor Korean
2950
2900
stock market more
2850 • According to Goldman Sachs Global
2800
2750
2700
equity to MSCI DM index could increase new
2650 capital inflows around $54 billions
2600
2550
KOSPI
27How stock market repones with the election
32.40%
Korean stock performance during election Throughout 8 president elections
30.00% 24.08% 23.80%
22.21%
18.50% 18.84% since 1980, equity rose just 5 out
20.00%
11.03% 10.90%
7.81%
of 8 ahead 1-month period.
6.33% 6.55%
10.00% 3.35% 5.63% 6.12% 3.29% 4.14% 2.43% 0.11% 2.13%
4.94% 3.09% 4.62%
0.72% 0.14% 0.29% 2.31% 0.89%
0.88%
0.00%
-3.41% -2.49% -2.54% -1.69% -0.93% -0.86% -0.19% -0.54% -0.26% -0.73%
-10.00% -5.25% -3.42% -5.26% -6.81%
-10.36% -10.54%
-20.00% -15.40% -14.65%
-30.00% -23.61%
-40.00% -39.28%
3M before 1M before 1W before 1W after 1M after 3M after
25-Feb-1981 16-Dec-1987 18-Dec-1992 18-Dec-1997 19-Dec-2002 19-Dec-2007 19-Dec-2012 9-May-2017
Throughout 8 president elections
30.00%
Korean VS MSCI EM performance during election 23.67% since 1980, Korean equity mostly
20.00% 16.58%
18.26%
overperform EM over 1-week period.
10.00% 8.02%
4.14% 4.17% 2.90% 4.11% 3.07% 3.60%
1.37% 2.37% 1.76% 1.30%
0.43% 0.03% 0.00%
0.00%
-0.86% -1.01% -0.58% -0.36%
-5.59% -2.12% -2.93% -2.33%
-5.37% -4.67% -4.58% -4.20% -4.54%
-10.00% -6.03%
-9.67% -11.02%
-14.48%
-20.00% -16.05%
-19.81%
3M before 1M before 1W before 1W after 1M after 3M after
18-Dec-1992 18-Dec-1997 19-Dec-2002 19-Dec-2007 19-Dec-2012 9-May-2017
28Future of Korea government
Lee Jae-myung • Majority of National Assembly of the Republic • It may take time to pass the bills since most Yoon Seok-youl
Democratic Party of Korea come from Democratic Party. If Lee of seats belong to Democratic Party. Korea People Power Party
Jae-myung become the next president, there stock market may not get benefit in the
will be more chance of supporting from the aspect of fiscal policy support.
fiscal side which may benefit the stock • Have to wait until the next election of
market. National Assembly of the Republic of Korea
to unlock political dreadlock.
POLITICAL GROUPS Government (172) Government (172)
POLITICAL GROUPS
• Democratic (172) • Democratic (172)
Opposition (117) Opposition (117)
• People Power (106) • People Power (106)
• Justice (6) • Justice (6)
• People (3) • People (3)
• Basic Income (1) • Basic Income (1)
• Transition Korea (1) • Transition Korea (1)
Independent (6) Independent (6)
• Independent (5) • Independent (5)
Next election : 2024 Next election : 2024
• Speaker (1) • Speaker (1)
Vacant (5) Vacant (5)
• Vacant (5) • Vacant (5)
Best case for stock market Likely case for stock market
29Global market Valuation checking
MSCI ACWI earning yield value to growth
Value style cheaper
0.008
0.004
0
Growth style cheaper
-0.004
-0.008
The MSCI all-country earning yield index reflects the earning yield of value minus the earning yield of growth style, the pathway of index illustrates the growth
style has relatively higher earning in the short-term. The current market is showing the value style outperformed the growth style due to the uncertainty of
central bank tightening policy which directly impacts to discount rate in growth style stock. The earning yield advantages of the growth style and the
attractive valuation are opportunities to invest in this style in medium to long term to be exact is the 2H22.
30MSCI all country index sector breakdown
Current index EPS 2022 PE ratio Implied target index upside/downside Estimated profit margin
Financial *
Material
Consumer Discretionary
Real estate
Information technology
Communication services
Energy
Industrial
Consumer Staple
Healthcare
Utility
* Justify the PE ratio for the financial sector at the average 5 years
sset like a stock
market tend to support the return to the investment portfolio.
31S&P 500 still our the most favorite market for 1H22
S&P 500 target return tend to trade at premium due to higher Strong NPM compare to long term and last cycle of rate hike
NPM and ROE
16.00%
6000 13.51%
10Y avg NPM
5296.33 12.00%
9.36%
5000 8.24%
8.00%
2022 NPM
4000 4336.56 4.00%
0.00% 2015 NPM
3000 10Y avg NPM 2022 NPM 2015 NPM
2000
Strong ROE compare to long term and last cycle of rate hike
25.00% 22.47%
20.00%
10Y avg ROE
1000
14.29%
15.00% 12.26%
10.00% 2022 ROE
SP500 5.00%
Target S&P500 2022 with current P/E ratio 0.00% 2015 ROE
Target S&P500 2022 with avg 5y P/E ratio 10Y avg ROE 2022 ROE 2015 ROE
32&P 500 still our the most favorite market for 1H22
Recommendation
• The overall sectors in the U.S.
market still does not change from 1
month before, the earning growth
reflect the huge upside of the
market index.
• The U.S. market is outperform
against the other developed
countries because the potential
economic and business growth.
• The advantage sector in short-term:
Financial, Energy, and material
sectors
• Market risk: the uncertainty of
hawkish Fed has pressured the
market sentiment. Moreover, the
political budget and spending was
stuck in the parliament.
33STOXX 600 tend to relatively stronger than other markets due to low valuation
STOXX 600 target return tend to trade at premium due to higher Strong NPM compare to long term and last cycle of rate hike
NPM and ROE
12.00%
600 581.20 10.01%
10.00% 10Y avg NPM
550 8.00%
6.04% 5.68%
500 6.00%
2022 NPM
494.40 4.00%
450
2.00%
400 0.00% 2015 NPM
10Y avg NPM 2022 NPM 2015 NPM
350
Strong ROE compare to long term and last cycle of rate hike
300 12.00%
10.51%
10.00% 8.80%
250 8.49% 10Y avg ROE
8.00%
200 6.00%
2022 ROE
4.00%
STOXX600
2.00%
Target STOXX600 2022 with current P/E ratio
0.00% 2015 ROE
Target STOXX600 2022 with avg 5y P/E ratio 10Y avg ROE 2022 ROE 2015 ROE
34Earning revision flavor cyclical sector
Recommendation
• The Europe stock market reflect the
cyclical sector upgraded earning
revision, the advantage sector in the
period of tightening monetary policy.
• Compared to the developed market,
the European stock market has
relatively benefit to economic status,
so we recommend the STOXX 600 in
the portfolio to gain a return.
• The advantage sector in short-term:
Financial, Automotive& parts, and
industrial sectors
• Market risk: the economic and
manufacturing situation is sensitively
to outlook of market earning and the
Covid-19 outbreak is closely
monitoring.
35Nikkei 225 still dragged by Korea stock market due to political shifting
Nikkei 225 target return tend to trade at premium due to higher Strong NPM compare to long term and last cycle of rate hike
NPM and ROE
10.00%
34000
7.66% 10Y avg NPM
8.00%
31000
6.00% 5.35% 5.02%
28023.50
28000 2022 NPM
4.00%
25000 2.00%
25581.85
22000 0.00% 2015 NPM
10Y avg NPM 2022 NPM 2015 NPM
19000
Strong ROE compare to long term and last cycle of rate hike
16.00%
16000
12.00% 11.09% 10Y avg ROE
13000 9.57% 9.70%
8.00%
2022 ROE
4.00%
Nikkei225
Target Nikkei225 2022 with current P/E ratio 0.00% 2015 ROE
Target Nikkei225 2022 with avg 5y P/E ratio 10Y avg ROE 2022 ROE 2015 ROE
36Earning -term
Recommendation
• The Japanese stock market is
upgraded the earning revision across
the market, but the market does not
perform harmonize with their outlook.
• Compared to the developed market,
the Nikkei market has relatively
underperformed to other countries,
the currency volatility and the capital
flow ignored the risky assets.
• The advantage sector in short-term:
Financial, Electronic& semiconductors
, and industrial sectors
• Market risk: the Covid-19 outbreak is
getting worse due to the highest daily
cases and the policy support form the
new government still disappear.
37CSI 300 : The key for China is to raise more debt rather than a rate cut
CSI300 target return Strong NPM compare to long term and last cycle of rate hike
10.80
5,579.55 10.60
5,500.00 10Y avg NPM
10.40
5,177.97 10.20
5,000.00 10.00
9.80 2022 NPM
9.60
4,500.00
9.40
9.20
2015 NPM
4,000.00 9.00
8.80
10Y avg NPM 2022 NPM 2015 NPM
3,500.00
Lower ROE compare to long term and last cycle of rate hike
14.00
3,000.00 13.50
13.00 10Y avg ROE
2,500.00 12.50
12.00
11.50 2022 ROE
CSI 300 11.00
10.50
Target CSI300 2022 with current P/E ratio 10.00
2015 ROE
9.50
9.00
Target CSI300 with avg 5y P/E ratio
10Y avg ROE 2022 ROE 2015 ROE
As of 28 Jan 2022
38Earning revision : Series of earning downgrade slowdown
15.0%
China earning revision by sector
11.4%
Recommendation
10.0% • Since Chinese government has ramped
up regulations in various sectors such as
information technology, consumer
5.0% 3.1% 3.1% discretionary and finance (property)
3.0% 3.0% 3.6% 3.0%
2.4% sector, the earning of those sector has
1.2% 1.2%
0.9%
0.4% 0.6% not been upgraded yet.
0.0% 0.1%
0.0%
-0.1%
• Despite an intense policy from
-0.2% -0.4% -0.2% -0.4% -0.2%
government, China has step up
-1.8%
-2.3% monetary stimulus. If private sectors in
-3.9%
-5.0%
-5.2% -4.7% China owe more debt, it may be a better
-6.2% -5.8% sign due to low interest rate and D/E
-7.9%
-10.0%
• Market risk: A tightening monetary policy
still pressure china stock market.
-10.5%
Moreover, China regulator still strict with
-15.0%
CSI300 Finan CSI300 Indus CSI300 Cons CSI300 Info CSI300 Health CSI300 Cons Dis CSI300 CSI300 Utilit CSI300 Telecom CSI300 Energy
the zero-covid policy
Sta Tech Materials
Earning Revision 1W Earning Revision 1M Earning Revision 3M
As of 30 Dec 2021
39Review : China
11 6000
Recommendation
10 5000
• Lower Financial leverage
9 4000
minimize current China's ROE
8 3000 • Lower policy rate but business
7
Lower rate Rise in total debt Stock market perform more
2000
still aware of taking a loan
• Private sector did not take
6 1000
advantage from a lower
5 0 financing cost that much
• Easing monetary policy with
China 1 Y Lending rate cut Net profit margin Financial Leverage Total debt (RHS) last price(RHS) tightening policy from China
As of 28 Jan 2022
government is continuing,
Goldman Sachs China Regulation Barometer : Antitrust, Financial Markets, Data Security and Social Sector according to the China
Regulation Barometer from
Goldman Sachs still high
• Key Trigger : Less tightening
policy from regulator may
increase a business sentiment.
Source: Goldman Sachs
40KOSPI : good valuation but political risk headwinds
KOSPI target return tend to trade at premium due to higher NPM and ROE
Strong NPM compare to long term and last cycle of rate hike
4,237.15 8.00
7.00
10Y avg NPM
4,000.00
6.00
5.00
3,500.00 4.00 2022 NPM
3,132.87 3.00
2.00
3,000.00
2015 NPM
1.00
0.00
2,500.00 10Y avg NPM 2022 NPM 2015 NPM
Strong ROE compare to long term and last cycle of rate hike
9.00
2,000.00
8.50
10Y avg ROE
8.00
1,500.00 7.50
7.00 2022 ROE
KOSPI 6.50
6.00
Target KOSPI 2022 with current P/E ratio 5.50 2015 ROE
5.00
Target KOSPI with avg 5y P/E ratio 10Y avg ROE 2022 ROE 2015 ROE
As of 28 Jan 2022
41Earning revision : New economy upgrade
60.0% 57.2% Recommendation
50.0%
• Only some sectors in Korea has been
revised up due to a disappointed earning in
40.0% Q4 and a high EPS growth.
• Despite a remarkable valuation, Korea
30.0%
stock market still under pressure from a
19.9%
20.0% large size IPO which force institution
7.5%
8.9% investor to rebalance their portfolio.
10.0% 5.1% 7.8% 1.6%
0.7% 0.5% 0.1% 1.8% 2.0% 0.3% 0.5% Moreover, newly listed stock in Korea stock
1.0% 1.3% 0.9% 1.4% 0.0% -0.1% 0.1% 1.5% 0.1% -0.1% 0.1% 0.3%
0.0%
0.6% 0.3% 0.0% market tend to make Korea stock exchange
0.2% 0.1% 0.7% 0.0% -0.3% -0.1% -1.5% -0.2% -1.9% -0.6% -0.3% 0.3%
-4.5% -0.8% -3.0% -1.1% -4.0% has the highest implied equity duration
-10.0% -7.0% -3.9%
-3.4% compared to other countries in MXAPJ
-20.0% index.
• The advantage sector in short-term:
-30.0%
-29.5% Financial
-40.0%
-34.3% • Market risk: Korea stock market heavily
weight on information technology sector
which sensitive with the tightening
monetary policy. Fiscal policy is still no sign
As of 30 Dec 2021 Earning Revision 1W Earning Revision 1M Earning Revision 3M of support even the election is coming up.
42SENSEX does not price-in new fiscal policy yet
SENSEX target return Strong NPM compare to long term and last cycle of rate hike
16.00
65,000.00
14.00 10Y avg
59,468.70 12.00 NPM
60,000.00
10.00
57,742.65 2022 NPM
55,000.00 8.00
6.00
50,000.00
4.00
2015 NPM
2.00
45,000.00
0.00
10Y avg NPM 2022 NPM 2015 NPM
40,000.00
Lower ROE compare to long term and last cycle of rate hike
35,000.00
16.00
10Y avg
30,000.00 15.00
ROE
14.00
25,000.00
13.00 2022 ROE
SENSEX 12.00
11.00 2015 ROE
Target SENSEX 2022 with current P/E ratio
10.00
10Y avg ROE 2022 ROE 2015 ROE
Target SENSEX with avg 5y P/E ratio
As of 28 Jan 2022
43SENSEX does not price-in new fiscal policy yet
47.00
India's major expenditure at 22/23 Rajya Sabha (Upper house)
Unit: Billion USD
National Democratic Alliance (120)
31.20 United Progressive Alliance (55)
28.60 27.60 29.00 Others (62)
26.00
Vacant (8)
20.50
18.00 19.90
13.90
11.3012.50 10.70 11.60 10.20 Lok Sabha (Lower house)
10.00
6.50 6.90 6.20 7.30
5.00
National Democratic Alliance (327)
United Progressive Alliance (110)
Agriculture Education Health Rural Development Social Welfare Transport Urban Developmet
Others (111)
Vacant (1)
Source: Aljazeera, Government of India
LT ROE • There is a political stability since a ruling party dominate in both upper house and lower house.
Public investment •
government • Increment of an infrastructure spending may lead economist to revise up GDP growth in 2022 to
spending ST two-digits growth rate from an estimate of 8 to 8.5% GDP growth rate in 2022.
Public consumption
44Earning revision : More to be upgraded on new fiscal policies
2.5% Recommendation
• Earning of India stock exchange
2.0% 1.9% mostly revise up between April to
May.
1.5% • Compared to other emerging market,
India stock market become more
1.0% attractive in the aspect of fiscal policy
support and growth of India
0.5%
economy. Moreover, India has a high
chance to pass fiscal budget since
majority of India parliament consist of
0.0%
0.0% ruling party members.
• The advantage sector in short-term:
-0.5%
Materials, banking
-0.4%
• Market risk: A tightening monetary
-1.0%
policy from both internal central bank
SENSEX
and external central bank.
Earning Revision 1W Earning Revision 1M Earning Revision 3M
45SET index may need to focus on new election?
SET target return tend to trade at discount due to soft ROE Strong NPM compare to long term and last cycle of rate hike
7.60
1,900.00 7.40
1,854.27 10Y avg
7.20 NPM
1,800.00
7.00
6.80
1,700.00 2022 NPM
6.60
1,600.00
6.40
6.20
1,500.00 6.00 2015 NPM
5.80
1,400.00 5.60
1,387.40 10Y avg NPM 2022 NPM 2015 NPM
1,300.00
Lower ROE compare to long term and last cycle of rate hike
1,200.00 12.00
10.00 10Y avg
1,100.00
ROE
1,000.00
8.00
6.00 2022 ROE
SET 4.00
2.00 2015 ROE
Target SET 2022 with current P/E ratio
0.00
Target SET with avg 5y P/E ratio 10Y avg ROE 2022 ROE 2015 ROE
As of 28 Jan 2022
46Earning revision :
15.0%
Thai earning revision by sector
9.3%
Recommendation
10.0%
6.8% • Only some sectors in Thai stock
5.6% 5.0% 3.6% 4.3%
5.0% 3.6%
4.5%
2.4%
3.9% exchange has been revised up due to
1.2% 2.1%
0.3% -0.4% 1.4% 1.0%
0.5% -0.4%-1.1% 0.5% 0.0% 0.7% 0.1% 0.1% 0.0%
0.4% 0.6%
-0.1%
0.6% 0.0% a strong demand from foreign such
0.0% 0.1% 0.0%
-0.1% -0.5% 0.1% -0.1% -0.5% -1.1% -0.3% 0.0% 0.1% -0.1% -0.3%
-1.8% -0.4% as an electronic component sectors.
-1.6% 1.7%-3.0% -1.6% -1.5% -1.7% -1.6% -2.3%
-5.0% -3.5% -2.4% -3.7% • Compared to other emerging market,
-10.0% -7.6% -7.1% Thai stock market is less attractive in
the aspect of the EPS growth. While
-15.0% -13.7%
-14.0% the other emerging countries has two
-20.0% digits of EPS growth, Thai EPS
growth is negative.
-25.0% -23.9% • Market risk: A tightening monetary
-26.9%
-30.0% policy still pressure Thai stock
-35.0%
exchange whereas Thai economy is
-33.9%
not already for the domestic
-40.0% tightening policy. Moreover, Thailand
has a political instability.
As of 30 Dec 2021 Earning Revision 1W Earning Revision 1M Earning Revision 3M
47Stick to the plan : DM and value 1st then EM and growth later
Factors and KTBST
2021 YTD
Policies
Safehaven Safehaven
Asset Rotation
seeker seeker
Value for 1H
Style Rotation Growth Growth Blend Growth Growth Value Growth Blend Growth Growth Value
Growth for 2H
Country G-7 for 1H
Non-G7 Non-G7 G7 Non-G7 G7 Non-G7 Non-G7 Global G7+1 G7+1 G7
Rotation Non-G7 for 2H
DM EM DM EM DM EM EM EM DM EM DM DM for 1H
Regional play
Outperform outperform Outperform outperform Outperform outperform outperform outperform Outperform outperform Outperform EM for 2H
Most Asset Country Country Country Regional Country Regional Asset Style Style Style
Style Rotation
outperform Rotation Rotation Rotation Rotation play Rotation play Rotation Rotation Rotation Rotation
Aid
Fiscal policy Tax cut Trade war Trade war Aid package Infra plan
package
Tapering/Rate
Monetary policy QE QE Late QE Tapering Rate hike Rate hike Rate hike Rate hike Rate cut QE Late QE
hike
Source : KTBST
Tightening policy
Expansionary policy2022 Tactical Asset allocation summary
Current Asset preferrences Current Regional preferences Next 3 - 6 mths Regional preferences Thematic and Sector preferences
Slightly Overweight UW N OW UW N OW
Adv. Economies
Adv. Economies
Adv. Economies
DM DM Omicron uncertainties
US US Clean energy
DM
Equities
EU EU Growth disparities
JP JP Policy tightening
EM EM Valuation Laggard
Dev. Economies
Dev. Economies
Dev. Economies
CN CN Pre-reopening
KR KR EM Commodities exporter play
IN IN Omicron uncertainties
TH TH
Current Asset preferrences Current Regional preferences Next 3 - 6 mth Regional preferences Thematic and Sector preferences
Slightly Underweight UW N OW UW N OW
IG FI Govt. FI
IG FI Govt. FI
IG FI Govt. FI
DM DM DM FED's asset underweight
Incomes
EM EM EM FED's asset underweight
Fixed
DM DM DM n.m.
EM EM EM n.m.
DM DM DM Yield seeking
HY FI
HY FI
HY FI
EM EM EM Yield seeking
Current Asset preferrences Current Regional preferences Next 3 - 6 mth Regional preferences Thematic and Sector preferences
Underweight UW N OW UW N OW
Alternative Asset
Alternative Asset
Alternative Asset
Gold Gold Gold FED's asset underweight
Alternative
REIT REIT REIT Leisure and hospitality play
Assets
Global Global Global Leisure and hospitality play
US US US Open boarder reopening
TH TH TH Laggard play
MBS MBS MBS FED's asset underweight/Yield seeking
Current Asset preferrences Current Regional preferences Next 3 - 6 mth Regional preferences Thematic and Sector preferences
Overweight Cash Cash Cash Liquidity BufferTAA Market recommendation
Asset Class Selection Prev. New Comment
Q21
U.S. OW OW
Omicron
slightly overweight
Europe OW OW
KTBST
FOMC
Japan NT NT
regulatory risk Evergrande
Foreign Equity China NT NT
Omicron lockdown
Opinion poll
Korea NT NT
Omicron
India UW NT
% GDP
Other EMs UW UW BM Omicron
Thai Equity Thailand UW UW Omicron
TH Money
1 year Deposit OW OW Omicron Delta
Market
Government
UW UW DM EM QT
Bond
Fixed Income
High yield DM EM Tapering
Corporate Bond OW OW
Property/REIT NT NT Neutral FOMC REIT
FED
Alternative asset Gold UW UW
QT
THBUSD Hedge hedged .50 $ % Portfolio
50TAA playbooks
+1 +3 - 6 Key factors turning recommendation to
Asset Class Selection
Months Months
Strategy
Positive Negative
U.S. OW OW Value/blend Vaccine gen 2 - 3 Lockdown
Europe OW OW Value/blend Vaccine gen 2 - 3 Lockdown
Value,semiconductor , exporter
Japan NT OW Vaccine gen 2 - 3 Geopolitical
China NT OW EM mRNA vaccine/Antiviral medication Tradewar
Foreign
Equity
Opinion poll
Korea NT NT Earning upgrade No revision in EPS
Omicron
India NT OW Policy easing Omicron control
% GDP
Other EMs UW UW EM H22 mRNA vaccine/Antiviral medication Trade war
Thai Equity Thailand UW UW Selective buy" FDI EV Lockdown
TH Money 1 year
OW UW Omicron Delta
Market Deposit
Governmen
UW UW DM EM Gradually QT Hawkish policy
Fixed t Bond
Income Corporate High yield DM EM Tapering
OW NT Reopening NPL rising
Bond
Property/RE
NT NT Tapering policy FED Occ. Rate improvement Hawkish policy
IT
Alternative
asset FED
Gold UW UW US and russia tension Hawkish policy
THBUSD Hedge hedged Portfolio
51TAA Recommendation
Conservative Moderate Aggressive
Asset Class Selection Prev. New SAA TAA Change SAA TAA Change SAA TAA Change
Overall DM portion OW OW Conservative
U.S. OW OW ER = 5.38 %
Europe OW OW S.D = 3.45 %
Japan NT NT Var95 = -0.31%
Foreign Equity Overall EM portion UW UW Sharpe = 1.1253
China NT NT
Korea NT NT
India UW NT
Balance
Thailand UW UW
ER = 6.37 %
Liquidity 1 year Deposit OW OW S.D = 4.81 %
Government Bond UW UW Var95 = -1.58 %
DM UW UW Sharpe = 1.011
EM UW UW
Fixed Income
Corporate Bond OW OW
DM OW OW Growth
EM OW OW
ER = 8.27 %
Global REIT NT NT
Alternative asset S.D = 8.24 %
Gold UW UW
Var95 = -5.33 %
Sharpe = 0.8209
522020 : Tactical Asset Allocation Performance
Total Return (D) Total Return (P) Total Return (B)
50 TAA 2020 Performance as of 1 February 2022 3
40 2.5
30 2
20 1.5
10 1
0 0.5
-10 0
-20 -0.5
-30 -1
WTD Active return as of 1 February 2022 TAA Aggressive portfolio Performance as of 1 February 2022
35
Comments: Port BM 31.96 31.97
30
Our portfolio weekly
25
outperforms around 7 bps
20
from recovery in DM 15 12.57 13.44
equity asset after 10
correction for a whole 5
1.16 1.10
month of January. 0
Source: KTBST, Bloomberg as of 1 -5
-3.71 -3.14
-1.19 -0.84
-3.68 -2.86
Feb -10
WTD 3M 6M YTD 1Y SI
532020 TAA aggressive portfolio
0.0500 Selec Curr MTD Active return attribution as of 1 February 2022
0.0400
0.0300
0.0200
0.0100
-
(0.0100)
(0.0200)
(0.0300)
(0.0400)
(0.0500)
(0.0600)
TAA AGG 2020 CSI 300 TR EM USD Aggregate Global Aggregate Gold KOSPI INDEX MSCI EM GR MSCI WORLD GR Nikkei Total Return Idx S&P 500 Total Return S&P Global REIT USD TR STXE6 $GR
MTD return composition as of 1 February 2022 MTD Active return attribution as of 1 February 2022
54Appendix : Equity Market : U.S. Market
Source: Bloomberg as of 01/02/2022
55Appendix : Equity Market : Euro Market
Source: Bloomberg as of 01/02/2022
56Appendix : Equity Market : Japan Market
Source: Bloomberg as of 01/02/2022
57Appendix : Equity Market : China Market
Source: Bloomberg as of 01/02/2022
58Appendix : Equity Market : South Korea Market
Source: Bloomberg as of 01/02/2022
59Appendix : Equity Market : India Market
Source: Bloomberg as of 01/02/2022
60Appendix : Equity Market : Emerging Market
Source: Bloomberg as of 01/02/2022
61Appendix : Equity Market : Thailand Market
Source: Bloomberg as of 01/02/2022
62Appendix : Equity Market : Property fund and REITs
Thai REIT Singapore REIT
Japan REIT Global REIT
Source: Bloomberg as of /0 /2020
63Appendix : Volatility in Market
Source: Bloomberg as of /0 /2022
64Appendix : Volatility in Market
Source: Bloomberg as of /0 /2022
65Appendix : Global Price/Earnings Ratio Current
Growth
Bloomberg ticker fwd P/E 2021 EPS 2021 2022 2023
DJIA INDU 19.73 1855.92 3.52% 4.52% 10.00%
S&P500 SPX 24.75 209.98 15.14% 7.40% 9.49%
STOXX 600 SXXP 20.06 29.42 25.35% 5.83% 4.50%
Nikkei 225 NKY 15.83 1650.18 -5.93% 7.32% 6.41%
CSI300 SHSZ300 16.58 310.58 6.09% 16.61% 14.65%
Hang Seng HSI 9.56 2007.99 -19.05% 10.39% 13.64%
Nifty 50 NIFTY 25.12 743.41 8.28% 17.82% 14.79%
BSE SENSEX SENSEX 27.05 2341.37 9.33% 17.80% 15.84%
KOSPI KOSPI 13.65 214.98 28.53% -2.21% 11.18%
SET SET 19.08 85.76 3.05% 11.46% 12.10%
MSCI AC MXWD 20.79 39.28 12.68% 6.32% 8.46%
MSCI DM MXWO 22.18 158.61 13.93% 6.47% 8.10%
MSCI EM MXEF 14.04 93.38 6.90% 5.48% 10.40%
Source : Bloomberg, Fiscal year, as of 03/01/2022, Green = Increase in P/E , Red = Decrease in P/E
66Appendix : Global Manufacturing PMI Monitor
70
Global Manufacturing PMI
60
50
40
30
20
ISM US PMI Caixin China PMI Markit Euro PMI Nikkei Japan PMI
Markit Germany PMI JPMorgan Glabal PMI Nikkei India PMI Nikkei SK PMI
Markit UK PMI Markit Thai PMI Markit EM PMI
67Appendix : Correlation across asset
68•
•
•
•
•
•
•
•
69You can also read