Market Chartbook: February 2021 - February 28, 2021 Baird Private Wealth Management
←
→
Page content transcription
If your browser does not render page correctly, please read the page content below
Market Chartbook: February 2021
Baird Private Wealth Management

February 28, 2021

Wealth Management | Capital Markets – Investment Banking | Private Equity | Asset Management

                                                                                               rwbaird.com
Markets at a Glance
As of February 28, 2021
Trailing Returns (%) Annual Returns (%)
Asset Class Last Mo. YTD 1-Year 3-Year 5-Year 10-Year 2020 2019 2018 Benchm ark
U.S. Stocks
Large Cap 2.8 1.7 31.3 14.1 16.6 13.4 18.4 31.5 (4.4) S&P 500
Large Cap Value 6.0 5.1 22.2 8.2 11.8 10.4 2.8 26.5 (8.3) Russell 1000® Value
Large Cap Grow th (0.0) (0.8) 44.3 21.0 22.0 16.4 38.5 36.4 (1.5) Russell 1000® Growth
Mid Cap 5.6 5.3 36.1 13.7 15.7 12.3 17.1 30.5 (9.1) Russell Midcap®
Small Cap 6.2 11.6 51.0 14.9 17.8 11.9 20.0 25.5 (11.0) Russell 2000®
International Stocks
Developed Markets 2.6 2.2 14.0 5.0 8.8 7.1 1.3 22.3 (10.5) MSCI EAFE (Gross)
Emerging Markets 1.0 4.9 34.8 9.3 15.3 7.9 19.5 18.5 (9.7) MSCI Emerging Mkts (Gross)
Bonds
Short-Term Taxable (0.0) 0.0 1.9 3.1 2.1 1.6 3.3 4.0 1.6 BBgBarc 1-3 Yr Govt/Credit
Intermediate-Term Taxable (0.8) (1.1) 2.4 4.8 3.1 3.0 6.4 6.8 0.9 BBgBarc Intermed. Govt/Credit
Short-Term Municipal (0.1) 0.1 1.5 2.1 1.5 1.4 2.1 2.8 1.8 BBgBarc 1-3 Yr Municipal
Intermediate-Term Municipal (1.5) (1.0) 1.5 4.6 2.9 3.8 5.1 6.7 1.7 BBgBarc 7 Yr Municipal
Cash
Cash/Cash Equivalents 0.0 0.0 0.4 1.5 1.2 0.6 0.7 2.3 1.9 BBgBarc 3 Month T-Bill
Satellite
High Yield 0.4 0.7 9.4 6.6 9.1 6.5 7.1 14.3 (2.1) BBgBarc US Corporate High Yield
Real Estate 3.0 2.8 2.8 9.8 8.2 8.3 (5.7) 28.2 (4.0) DJ Composite All REIT
Commodities 6.5 9.3 20.3 0.3 3.7 (5.9) (3.1) 7.7 (11.2) Bloomberg Commodity
Source: FactSet; Russell, MSCI, Bloomberg Barclays., FTSE, and Dow Jones benchmarks. Performance greater than one year is annualized. Performance is represented by the benchmark listed in the “representative benchmark”
column. Performance is a total return index, or price return plus reinvested dividends. See important disclosures and definitions included with this publication.
Robert W. Baird & Co. Member SIPC.S&P 500 Index
As of February 28, 2021
Year-to-Date Performance of the S&P 500 Price Return Index
YTD +1.5%
Source: FactSet, Standard and Poor’s. The S&P 500 Index, computed by the Standard & Poor's Corporation, is a well-known gauge of stock market movements determined by the weighted capitalization of the 500 leading U.S. common
stocks. Indices are unmanaged and it is not possible to invest directly in an index.
Robert W. Baird & Co. Member SIPC.Domestic Asset Class Performance
As of February 28, 2021
Year-to-Date Performance by Market Cap and Style
Source: FactSet. Asset classes are represented by the following benchmarks: S&P 500 (Large Cap), Russell Midcap® (Mid Cap), Russell 2000® (Small Cap), Russell 1000 Value® (Large Value), Russell 1000 Growth® (Large Growth),
Russell Midcap Value® (Mid Value), Russell Midcap Growth® (Mid Growth), Russell 2000 Value® (Small Value), and Russell 2000 Growth® (Small Growth). See important disclosures and definitions included with this publication.
Robert W. Baird & Co. Member SIPC.Domestic Asset Class Performance
As of February 28, 2021
S&P 500 Index: Performance by Sector (YTD) S&P 500 Sector Statistics
P/E Ratio P/E Ratio Dividend 1-Yr EPS
(TTM) (NTM) Yield (%) Grow th (%)
S&P 500 Index 26.9 21.6 1.5 (19.2)
Communication Services 27.6 23.0 0.9 (12.7)
Consumer Discretionary 42.6 36.5 0.6 (34.6)
Consumer Staples 21.3 19.5 2.7 4.0
Energy - 28.0 4.7 (158.5)
Financials 17.0 14.4 2.0 (23.7)
Health Care 23.5 15.9 1.6 (3.0)
Industrials 25.4 24.2 1.5 (48.2)
Info. Tech. 33.3 25.8 0.9 6.4
Materials 28.9 19.7 1.8 (12.5)
Real Estate 42.7 20.6 3.0 (24.6)
Utilities 18.5 17.3 3.5 (10.8)
Source: FactSet. Performance greater than one year is annualized. Performance is represented by the benchmark listed in the “representative benchmark” column. See important disclosures and definitions included with this publication.
Robert W. Baird & Co. Member SIPC.International Equity Snapshot
As of February 28, 2021
Trailing Returns (%) Annual Returns (%)
Asset Class/Region Last Mo. YTD 1-Year 3-Year 5-Year 10-Year 2020 2019 2018 Benchm ark
Broad Developed Markets
Developed Markets (USD) 2.3 1.2 23.0 5.1 10.3 5.5 8.3 22.7 (13.4) MSCI EAFE USD
Developed Markets (Local Currency) 2.6 2.2 14.0 5.0 8.9 7.1 1.3 22.3 (10.5) MSCI EAFE Local
Currency Effect (USD - Local Returns) (0.4) (1.1) 9.0 0.1 1.4 (1.6) 7.0 0.3 (2.8)
Broad Em erging Markets
Emerging Markets (USD) 0.8 3.9 36.5 6.7 15.7 4.8 18.7 18.9 (14.2) MSCI Emerging Markets
Emerging Markets (Local Currency) 1.0 4.9 34.8 9.3 15.3 7.9 19.5 18.5 (9.7) MSCI Emerging Markets Local
Currency Effect (USD - Local Returns) (0.3) (1.0) 1.7 (2.6) 0.3 (3.1) (0.8) 0.4 (4.5)
Returns by Style
Value 5.0 4.8 7.9 0.4 6.5 5.2 (8.2) 16.3 (11.4) MSCI EAFE Value
Grow th 0.2 (0.4) 19.3 9.3 10.9 8.9 10.8 28.3 (9.7) MSCI EAFE Growth
Large Cap 3.0 2.4 13.3 4.9 8.7 6.8 0.5 21.8 (9.8) MSCI EAFE Large Cap
Mid Cap 1.4 1.7 16.6 5.1 9.3 8.5 4.0 24.1 (13.1) MSCI EAFE Mid Cap
Small Cap 3.0 3.3 21.8 5.4 10.7 9.8 5.5 24.9 (15.1) MSCI EAFE Small Cap
Returns by Region
Europe 2.4 1.4 10.1 4.6 8.0 6.6 (1.7) 24.6 (10.0) MSCI Europe
Japan 3.3 3.7 27.3 5.5 10.1 9.2 9.2 18.9 (14.9) MSCI Japan
Pacific (ex Japan) 2.3 3.5 8.2 5.3 10.5 7.0 0.4 18.2 (4.4) MSCI Pacific ex Japan
Source: FactSet; MSCI benchmarks. Performance greater than one year is annualized. Performance is represented by the benchmark listed in the “representative benchmark” column. See important disclosures and definitions included
with this publication.
Robert W. Baird & Co. Member SIPC.International Country Performance
As of February 28, 2021
Selected Country Performance (YTD) MSCI ACWI Ex U.S. Performance by Sector (YTD)
Source: FactSet; MSCI Indices; Baird Analysis. All returns are reported in USD. MSCI EAFE (Developed markets) and MSCI EM (Emerging markets) are broad benchmarks representing many countries. Includes the 10 largest countries
by weighting in the benchmark. See important disclosures and definitions included with this publication.
Robert W. Baird & Co. Member SIPC.Bond Market Snapshot
As of February 28, 2021
Trailing Returns (%) Annual Returns (%)
Bond Types Last Mo. Last 3 Mos. YTD 1-Year 3-Year 5-Year 10-Year 2020 2019 2018 Benchm ark
Broad Developed Markets
U.S. Taxable Bonds (1.4) (2.0) (2.2) 1.4 5.3 3.6 3.6 7.5 8.7 0.0 BBgBarc US Aggregate Bond
U.S. Municipal Bonds (1.6) (0.4) (1.0) 1.1 4.8 3.4 4.4 5.2 7.5 1.3 BBgBarc Municipal Bond
International Bonds (1.9) (0.8) (2.9) 6.3 2.5 3.5 1.6 10.1 5.1 (2.1) BBgBarc Glbl Agg. Bond ex US
Broad Em erging Markets
Emerging Market Bonds (1.4) (0.8) (2.3) 2.7 5.3 6.2 5.7 6.5 13.1 (2.5) BBgBarc Emerging Markets
Taxable Bond Categories
Treasuries (1.8) (3.0) (2.8) (0.1) 5.0 2.6 3.1 8.0 6.9 0.9 BBgBarc US Treasury
Agencies (1.8) (2.9) (2.7) (0.0) 4.9 2.6 3.0 7.9 6.8 0.9 BBgBarc US Government
Mortgage-Backed (0.7) (0.4) (0.6) 1.5 4.1 2.6 2.9 3.9 6.4 1.0 BBgBarc US MBS
Inv-Grade Corporate (1.7) (2.6) (3.0) 2.8 6.9 5.9 5.2 9.9 14.5 (2.5) BBgBarc US Corporate Bond
High Yield Corporate 0.4 2.6 0.7 9.4 6.6 9.1 6.5 7.1 14.3 (2.1) BBgBarc US HY Corporate Bond
Municipal Bond Categories
Insured (1.5) (0.2) (0.8) 1.4 5.6 4.2 5.1 5.7 8.3 2.3 S&P Municipal Bond Insured
State GO (1.6) (0.5) (1.0) 1.2 4.6 3.0 3.8 5.1 6.8 1.4 BBgBarc Municipal State GO
Local GO (1.8) (0.9) (1.3) 1.2 5.1 3.6 4.4 5.9 7.9 1.2 BBgBarc Municipal Local GO
Revenue (1.6) (0.2) (0.9) 1.0 5.0 3.7 4.8 5.3 7.9 1.2 BBgBarc Municipal Revenue
High Yield (1.0) 2.9 1.0 1.3 7.4 6.4 7.0 4.9 10.7 4.8 BBgBarc High Yield Muni
Source: FactSet; BBgBar. benchmarks. Individual security types are subsets of either the BBgBar. U.S. Aggregate or Municipal Bond benchmarks. Duration, measured in years, is a relative term that expresses the price sensitivity of an
investment/benchmark to changes in interest rates. All else equal, the lower the duration, the less price sensitivity to interest rate changes. See important disclosures and definitions included with this publication.
Robert W. Baird & Co. Member SIPC.Performance by Maturity and Credit Quality
As of February 28, 2021
Performance by Maturity (YTD)
Performance by Credit Quality (YTD)
Source: FactSet, Baird Analysis. Ratings are as defined by Bloomberg and represent bonds in the BBgBar. Aggregate Bond index (taxable bonds) and BBgBar. Municipal Index (municipal bonds). Short-term maturity is defined as 1-3 years,
intermediate is 5-7 years for taxable and 6-8 for municipal, long-term is 10+ years for taxable and 8-12 years for municipal. See important disclosures and definitions included with this publication.
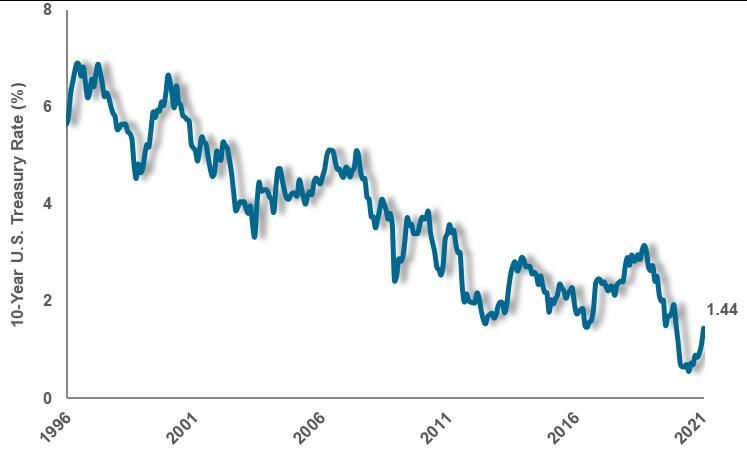
Robert W. Baird & Co. Member SIPC.U.S. Treasury Bonds
As of February 28, 2021
U.S. Treasury Yield Curve Historical U.S. Treasury Rates
Current U.S. Treasury Yields by Maturity
Source: U.S. Department of Treasury; Baird Analysis. See important disclosures and definitions included with this publication.
Robert W. Baird & Co. Member SIPC.Disclosures
Disclaimers Russell 3100® Value Index: Measures the performance of those Russell 3100® Index companies with lower
This is not a complete analysis of every material fact regarding any company, industry or security. The price to- book ratios and lower forecasted growth values. An all-cap index.
information has been obtained from sources we consider to be reliable, but we cannot guarantee the Russell Top 50® Index: Measures the performance of the 50 largest companies in the Russell 1000® Index,
accuracy. Past performance is not a guarantee of future results. which represents approximately 40% of the total market capitalization of the Russell 1000® Index. A mega-cap
Style Definitions index.
Large Growth: equity securities of large capitalization companies having growth stock characteristics (high Russell Top 200® Index: Measures the performance of the 200 largest companies in the Russell 1000®
price to earnings, high return on equity and low dividend yield. Based upon the Russell 1000® Growth Index. Index, which represents approximately 68% of the total market capitalization of the Russell 1000® Index. A
Large Value: equity securities of large capitalization companies having value stock characteristics (low large-cap index.
forecasted price-to-earnings ratio, low price-to-book ratio, high dividend yield). Based upon the Russell 1000® Russell 1000® Growth Index: Measures the performance of those Russell 1000® Index companies with
Value Index. Mid Growth: equity securities of middle capitalization companies having growth stock higher price-to-book ratios and higher forecasted growth values. A large-cap index.
characteristics (high price to earnings, high return on equity and low dividend yield). Based upon the Russell Russell 1000® Value Index: Measures the performance of those Russell 1000® Index companies with lower
Midcap® Growth Index. Mid Value: equity securities of middle capitalization companies having growth stock price to- book ratios and lower forecasted growth values. A large-cap index.
characteristics (high price to earnings, high return on equity and low dividend yield). Based upon the Russell
Midcap® Value Index. Small Growth: equity securities of small capitalization companies having growth stock Russell 1000® Defensive/Dynamic Index: Measures the performance of those Russell 1000® Index
characteristics (high price to earnings, high return on equity and low dividend yield). Small capitalization stock companies based in terms of volatility of price and earnings, leverage and return on assets. The Russell 1000®
July be subject to additional risks including illiquidity. Based upon the Russell 2000® Growth Index. Small Defensive Index includes those with relative stability and less sensitivity to economic cycles. The Russell
Value: equity securities of small capitalization companies having value stock characteristics (low price-to- 1000® Dynamics Index includes those with less stability and greater sensitivity to economic cycles.
earnings ratio, low price-to-book ratio, high dividend yield). Small capitalization stocks July be subject to Russell Midcap® Index: Measures the performance of the 800 smallest companies of the Russell 1000®
additional risks including illiquidity. Based upon the Russell 2000® Value Index. International: a free float- Index, which represents approximately 36% of the total capitalization of the Russell 1000® Index. A mid-cap
adjusted market capitalization index that is designed to measure developed market equity performance, index.
excluding the US & Canada, consisting of 21 developed market country indices. Based upon the MSCI EAFE Russell Midcap® Growth Index: Measures the performance of those Russell Midcap® Index companies with
Index. Satellite: these asset classes, as defined by Baird, include commodities, real estate, high yield bonds higher price-to-book and higher forecasted growth values. A midcap index.
and emerging markets. Representative benchmarks are as follows: Dow Jones UBS Commodity
(commodities), Dow Jones US REIT (real estate), BofA High Yield Master II (high yield), and MSCI Emerging Russell Midcap® Value Index: Measures the performance of those Russell Midcap companies with lower
Markets (emerging markets). Short Term Taxable: Short-term bond portfolios invest primarily in corporate price-to book and lower forecasted growth values. A mid-cap index.
and other investment-grade U.S. fixed-income issues and have durations of one to 3.5 years. Based upon the Russell 2000® Index: Measures the performance of the 2,000 smallest companies in the Russell 3100®
BBgBar. 1-3 Year Govt/Credit Index. Intermediate Taxable: Intermediate-term bond portfolios invest Index, which represent approximately 10% of the total market capitalization of the Russell 3100® Index. A
primarily in corporate and other investment-grade U.S. fixed-income issues and have durations of 3.5 to six small-cap index.
years. Based upon the BBgBar. Intermediate Gov’t/Credit Index. Short Term Municipal: Muni national short Russell 2000® Growth Index: Measures the performance of those Russell 2000® Index companies with
portfolios invest in bonds issued by various state and local governments to fund public projects. These higher price-to-book ratios and higher forecasted growth values. A small-cap index.
portfolios have durations of less than 4.5 years. Based upon the BBgBar. 3 Year Municipal Index.
Intermediate Term Municipal: Muni national short portfolios invest in bonds issued by various state and Russell 2000® Value Index: Measures the performance of those Russell 2000® Index companies with lower
local governments to fund public projects. These portfolios have durations of 4.5 to 7 years. Based upon the price-to- book ratios and lower forecasted growth values. A small-cap index.
BBgBar. 7 Year Municipal Index. Russell Microcap Index: Measures the performance of smallest 1000 companies in the Russell 2000® Index,
which represents less than 3% of the total market capitalization. A micro-cap index.
GICS
Dow Jones U.S. Real Estate: Measures the performance of Real Estate Investment Trusts (REIT) and other
The Global Industry Classification Standard ("GICS") is the exclusive property of Morgan Stanley Capital
companies that invest directly or indirectly through development, management or ownership, including
International Inc. ("MSCI") and Standard & Poor's, a division of The McGraw-Hill Companies, Inc. ("S&P") and
properties.
is licensed for use by Robert W. Baird & Co. Inc. MSCI and S&P hereby provided all information "as is" and
expressly disclaim all warranties. Without limiting any of the foregoing, in no event shall MSCI or S&P have Dow Jones Industrial Average: A price-weighted index composed of 31 actively-traded large cap stocks.
any liability. Bloomberg Commodity: Aims to provide broadly diversified representation of commodity markets and
Domestic Equity Benchmarks represents 20 commodities, weighted based on economic significance and market liquidity.
S&P 500® Index: A representative sample of 500 leading companies in leading industries of the U.S. S&P 500® High/Low Quality Index: The S&P Quality Rankings System measures growth and stability of
economy. Considered a large-cap index. earnings and dividends within the S&P 500 Index. The S&P 500 High Quality Index tracks stocks identified by
Standard & Poor’s as high quality (ranked A and above); The S&P 500 Low Quality Index tracks stocks
Russell 3100® Growth Index: Measures the performance of those Russell 3100® Index companies with identified by Standard & Poor’s as low quality (ranked B and below).
higher price-to-book ratios and higher forecasted growth values. An all-cap index.
The Russell Indices are a trademark of the Frank Russell Company. Russell® is a trademark of the Frank
Russell Company.
Investors should consider the investment objectives, risks, charges and expenses of a fund carefully before investing. This
and other information is found in the prospectus or summary prospectus. For a prospectus or summary prospectus, contact
your Baird Financial Advisor. Please read the prospectus carefully before investing.Disclosures
MSCI International Equity Benchmarks Fixed Income Benchmarks
MSCI EAFE Index: A free float-adjusted market capitalization index that is designed to measure developed BBgBarc. Aggregate Bond Index: is an unmanaged index that tracks domestic investment-grade
market equity performance, excluding the US & Canada. The MSCI EAFE Index consists of 21 developed bonds, including corporate, government, and mortgage-backed securities.
market country indices in Europe, Australasia, and the Far East. An international index.
BBgBarc. 1-3 Yr Government/Credit Bond Index: Includes bonds covered by the BBgBar.
MSCI EAFE Large Cap: The MSCI EAFE Large Cap Index is an unmanaged, market-weighted index of large Government/Credit Index, with maturities from 1 up to (but not including) 3 years.
companies in developed markets, excluding the U.S and Canada. An international large cap index.
BBgBarc. Intermediate Government/Credit Bond Index: Composed of approximately 3,500
MSCI EAFE Mid Cap: The MSCI EAFE Mid Cap Index is a free float-adjusted market capitalization index
publicly issued corporate and U.S. government debt issues rated Baa or better, with at least one year
that is designed to measure the performance of mid capitalization equities in the developed markets excluding
to maturity and at least $1 million par outstanding. The index is weighted by the market value of the
the US & Canada. An international mid cap index.
issues included in the index. The Index has duration of a little over 3 years and a maturity equal to
MSCI EAFE Small Cap: The MSCI EAFE Small Cap Index represents the small cap segment in 21 slightly more than 4 years.
developed equity markets outside of North America. It targets 40% of the eligible small cap universe in each
country. An international small cap index. BBgBarc. Muni Bond Index: Bonds must have a minimum credit rating of at least Baa, an
outstanding par value of at least $3 million, part of a transaction of at least $50 million, issued after
MSCI EAFE Growth: A sub-set of the MSCI EAFE Index, this benchmark is generally considered to be
November 30, 1990 and have a year or longer remaining maturity.
representative of the international growth stock market activity and often used as a benchmark for
international growth equity portfolios. An international growth index. BBgBarc. 3 Year Muni Bond Index: Includes bonds that have a minimum credit rating of BAA3, are
MSCI EAFE Value: A sub-set of the MSCI EAFE Index, this benchmark is generally considered to be issued as part of a deal of at least $50 million, have a minimum maturity of 2 years and a maximum
representative of international value stock market activity and often used as a benchmark for international maturity of 4 years, and have been issued after November 30, 1990.
value equity portfolios. An international value index. BBgBarc. 7 Year Muni Bond Index: This index is a subset of the BC Municipal Bond Index. It
MSCI Europe Index: A free float-adjusted market capitalization index that is designed to measure developed includes maturities of six to eight years.
market equity performance in Europe. As of June 2006, the MSCI Europe Index consisted of the following 16 BBgBarc. Global Aggregate ex USD Index: Tracks investment-grade government, corporate,
developed market country indices: Austria, Belgium, Denmark, Finland, France, Germany, Greece, Ireland, agency, and mortgage-related bonds in markets outside the U.S. An international bond index.
Italy, the Netherlands, Norway, Portugal, Spain, Sweden, Switzerland and the UK. An international index.
BofA/ML US High Yield Master II Index: The US High Yield Master II Index tracks the performance
MSCI Pacific ex Japan Index: A free float-adjusted market capitalization index designed to measure equity
of below investment grade US dollar-denominated corporate bonds publicly issued in the US domestic
market performance in the Pacific region, minus Japan. As of June 2006, the MSCI Pacific ex Japan Index
market, subject to various qualifications. A high yield taxable bond index.
consisted of the following 5 Developed Market countries: Australia, Hong Kong, New Zealand, and Singapore.
An international index. BBgBarc. US Treasury Bond Index: Measures the performance of public obligations of the US
MSCI BRIC: A free float-adjusted market capitalization weighted index that is designed to measure the equity Treasury with a remaining maturity of one year or more.
market performance of the following four emerging market country indices: Brazil, Russia, India and China. BBgBarc. US MBS Index: Measures the performance of investment grade mortgage-backed pass-
MSCI Emerging Markets Index: A free float-adjusted market capitalization index that is designed to measure through securities of GNMA, FNMA and FHLMC.
equity market performance in the global emerging markets. As of February 2003 the MSCI Emerging Markets BBgBarc. IG Corporate: Measures the performance of investment grade corporate bonds with a
Index consisted of 26 emerging market country indices. An emerging markets index. remaining maturity of one year or more.
MSCI Country Indices: To construct an MSCI Country Index, every listed security in the market is identified. FTSE Treasury Bill 3 Month: An unmanaged index of three-month Treasury bills. Representative of
Securities are free float adjusted, classified in accordance with the Global Industry Classification Standard short-term money market deposits, or “cash”.
(GICS®), and screened by size and liquidity. MSCI then constructs its indices by targeting for index inclusion
85% of the free float adjusted market capitalization in each industry group, within each country. By targeting S&P/LTSA Leveraged Loan: A broad index designed to reflect the performance of U.S. dollar
85% of each industry group, the MSCI Country Index captures 85% of the total country market capitalization facilities in the leverage loan market.
while it accurately reflects the economic diversity of the market. International indices. Other Benchmarks
Dow Jones CSFB Managed Futures: Designed to provide transparent representation of managed
futures hedge fund performance. Funds are selected by Credit Suisse based on eligibility standards,
rebalanced semi-annually and performance is calculated quarterly.
Dow Jones CSFB Multi-Strategy: Designed to provide transparent representation of fund of hedge
fund performance. Funds are selected by Credit Suisse based on eligibility standards, rebalanced
semi-annually and performance is calculated quarterly.
Dow Jones CSFB Long/Short: Designed to provide transparent representation of long/short equity
hedge fund performance. Funds are selected by Credit Suisse based on eligibility standards,
rebalanced semi-annually and performance is calculated quarterly.
Investors should consider the investment objectives, risks, charges and expenses of a fund carefully before investing. This
and other information is found in the prospectus or summary prospectus. For a prospectus or summary prospectus, contact
your Baird Financial Advisor. Please read the prospectus carefully before investing.You can also read