Assessment and Analysis of Impurities in Ground Water of Sunder Nagar - A Case Study
←
→
Page content transcription
If your browser does not render page correctly, please read the page content below
Volume 6, Issue 2, February – 2021                            International Journal of Innovative Science and Research Technology
                                                                                                              ISSN No:-2456-2165

     Assessment and Analysis of Impurities in Ground
         Water of Sunder Nagar – A Case Study
                                     Daljeet Kumar1, Dr. Devinder Sharma, Sanjay Kumar 3
            1
             M.Tech. Student, Dept. of Civil Engineering, SIRDA Institute of Technology, Sundernagar-175018, India
                   2
                     Associate Professor, Abhilashi University, Chailchowk, District Mandi (H.P)-175028, India
          3
            Assistant Professor, Dept. of Civil Engineering, SIRDA Institute of Technology, Sundernagar-175018, India
                                                Corresponding author: Daljeet Kumar

Abstract:- The management of ground water quality is a                     Water is an very necessary basic element for
major environmental challenge in now a days. Monitoring              sustainability of life on earth. And now a days increasing
the different sources of pollutants load contribution to the         population is the major problem in growing demand of
ground water is quite difficult. The main objective of this          Ground water used for drinking, irrigation, industry, and
present study is the Assessment and analysis of impurities           hydroelectricity which also impact the quality of water. In our
of Ground water in Sunder nagar Town of Mandi District               India 85% of population drinking water needs are fulfilled by
of Himachal Pradesh India .                                          the aquifers due to which level of ground water is decreasing
                                                                     in our country. This excessive use of ground water and
      To determine the impurities of ground water in                 pollution in surface water which is caused by the discharge of
Sunder Nagar area, the following Physical as well as the             the untreated waste, dumping of industrial waste, runoff from
Chemical processes were conducted to determine various               agriculture field puts a lot of pressure in Ground water
                physical and chemical characteristics. The           resources. This leads to the decrease in Ground water quality
five sites were chosen randomnly for taking sample of                and depletion of natural resources.
ground water i.e Sample1 is taken from village
Bherjwanu, which is an agriculture area. Sample 2 is                       Many countries has developed specified standard for
taken from DhanotuNH23(National Highway) ,Sample 3                   their own country. In our India the water quality standards are
is taken from chambi area(which is an residential                    defined by the Bureau of Indian Standard (BIS).This BIS
area).Sample 4 is taken from Jangam bag the place of                 Code 10500: Revised 2012 sets the standard for water quality
JAMADAGNI RISHI .He is one of the Saptarishis in the                 parameters of drinking water.
seventh, and he is the father of Parashurama. Sample 5 is
taken from Sukhdevvatika,(Which is place of sukhdev                            II.    OBJECTIVES OF THE STUDY
muni). All of these sample were collected from Tehsil
Sunder nagar in order to evaluate the Ground water                   1. To determine the Physical Analysis of ground water
suitability for drinking and agricultural purpose. For this             around Sundernagar Area.
purpose, we have conducted Physical process test i.e. pH             2. To determine the Chemical Analysis of ground water
(alkalinity test), turbidity, conductivity, Total dissolved             around Sundernagar Area and remedial measure to be
solids (TDS) ,Temperature test. The chemical Process tests              suggested.
includes Residual chlorine test, Hardness of water,                  3. To determine the statistical correlation between different
Alkalinity of water ,Chloride, Presence of Fluoride, Iron,              parameters.
Nitrate. These all tests were performed in IPH (Irrigation
& public health department) Lab of SunderNagar circle.                                III.   METHODOLOGY

                 I.     INTRODUCTION                                       From the very beginning firstly five different sites have
                                                                     been selected in the Sundernagarblock for taking the sample
      Ground water is very necessary natural resource not            of Ground water testing. It has been properly checked the
only for a state or country, but for entire world living beings.     information and descriptions of the local authority that is
Ground water is the water that seeps through rocks and soil          responsible for maintenance of ground water sources in the
which is stored below the ground. The rock in which ground           vicinity of the area under the investigation.
water is stored are called aquifers. Water moves through these
rocks because they have large connected spaces that make                   The Ground water samples were collected in the
them permeable. In other words we can also say that Ground           properly sterilized bottle having capacity of about 1-1.5 liter,
water is the water found underground in the cracks and spaces        so that the sample collected from each individual sites were
in soil, sand and rock. It is stored in and moves slowly             sufficient to undertake all the physical (pH Test, Turbidity
through geologic formations of soil, sand and rock that is           Test, Conductivity Test and TDS Test) as well as chemical
named aquifer.                                                       tests (Residue Chlorine Test, Hardness Test, Alkanity Test,
                                                                     Chloride Test, Flouride Test, Iron Test and Nitrate Test Test)
                                                                     .

IJISRT21FEB566                                              www.ijisrt.com                                                       859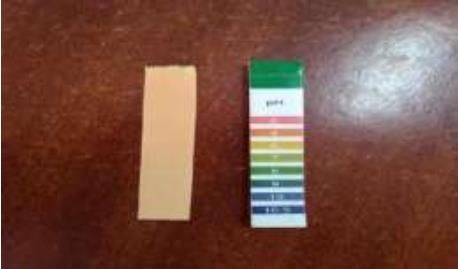
Volume 6, Issue 2, February – 2021 International Journal of Innovative Science and Research Technology
ISSN No:-2456-2165
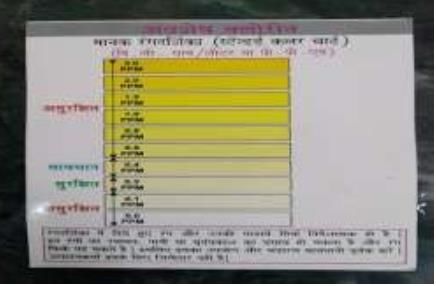
All the tests were performed quickly, as soon as 4) When the colour of water sample become more yellow
possible, because environment temperature might effect the from light yellow i.e. 0.4PPM mg/l then it is in alert zone.
properties of water samples. The Lab where all the tests were 5) And above 0.4- 1.0 PPM range Water is not in use of
performed ia as shown in the figure 3.1. drinking.
pH VALUE TEST
The pH stands for Potential Hydrogen. pH is the
measure of hydrogen ion concentration , or in other words, it
is the measure of acidity or alkalinity of the sodium . The pH
scale ranges from 0 to 14 is as shown in figure3.3 .
Figure 3.1:The View of Testing lab Procedure Of Residual
Chlorine Test
1) Taking a 10ml sample of water and adding Ortho-Tolidine
3-4 drops in the sample. if no colour changes that mean
the chlorine is absent.
2) If colour changes after the addition of Ortho- Tolidine, Figure 3.3: pH Scale
match it with the standard colour chart of Residual
chlorine test. 6) pH value of pure water is = 7 (Which is neutral point)
7) The solution having pH less than 7 are acidic and while
those with a pH greater than 7 are basic or alkaline. pH
range for drinking water is 6.5 to 8.5 (unit less). If the pH
value is below 6.5, then it means solution is acidic and
likely to be contaminated with pollutants, and water is
unsafe for drinking purpose. When the pH value increases
from 8.5 then the solution is basic or alkaline which does
not have any taste change but excess of alkalinity in our
body cause gastrointestinal issue.
IV. RESULTS & DISCUSSION
The results of test samples from different sites, are
Figure 3.2: Standarad Colour Chart Of Residue Chlorine given in sequence form. This results of different tests have
Test been sequenced in order to compare the ground water quality
of various sites under investigation. All of the tests were
If the colour is white i.e. value is 0.0PPM mg/l that means conducted under laboratory, with digital meters & tool kits ,
no chlorine is present and it is chlorine free water which is chemical processes. Based on the above observation, a set of
under very safe zone. data is prepared with various parameters.
3) If the colour of water sample become light yellow and
value is 0.1- 0.2 PPM mg/l then it is considered in safe
zone.
Table 4.1: Results of Different Test
Test Name/Sample Sample1 Sample2 Sample3 Sample4 Sample5 Safe –Unsafe zone Range
Residual Chlorine test 0.0 0.0 0.0 0.0 0.0 0.2-0.4
pH Value test 6.7 7.7 7.82 7.32 6.96 6.5-8.5
Conductivity test 463 281 297 226 512 800-1000
Hardness Test 300 166 146 170 252 0-200
Turbidity test 0.0 59 48 0 1 0-5
T.D.S. Test 303 183 195 226 335 0-500
Chloride test 21 10 11 8 34 0-250
Alkalinity Test 260 195 179 150 200 0-200
Fluorides Test 0 0.5 0 0.1 .5 1-1.5
Nitrate test 0.5 25 10 10 10 10-45
Iron Test 0.3 0.5 0.5 0.3 0.3 0-0.5
IJISRT21FEB566 www.ijisrt.com 860Volume 6, Issue 2, February – 2021 International Journal of Innovative Science and Research Technology
ISSN No:-2456-2165
Results of all the above parameters for different samples sample S1 and sample S5 is not in safe zone and hence not
named S1, S2, S3, S4, S5 and S6which shows permissible applicable for drinking purpose because tolerance value of
limits) are shown in table 4.1 and figures 4.1 to 4.11. From hardness for drinking water is 200mg/l but hardness of these
Table4.1, No residue of chlorine were found in all the samples exceeded from 200mg/l. Effective measures should
samples of ground water taken from different places. Due to be adopted to reduce the hardness of these two samples.
no chlorine present in the water can cause risk of bacterial Hardness of other samples(S2, S3, S4) were found to be in
contamination .pH value of all these ground water samples safe zone hence applicable for drinking purpose. Figure 4.4
were found to be with in the permissible limits and hence shows the results of turbidity test. Turbidity of S1, S4, S5
water is applicable for drinking purpose as shown in figure were found with in permissible limits whereas sample S2 and
4.1. In figure 4.2, Conductivity of all these five ground water S3 were found above the safe limits hence not applicable for
samples were found in safe zone and is hence applicable for drinking purpose. It requires proper filtration processes to use
drinking purpose. Figure 4.3 shows the result of hardness test it for drinking purpose.
Figure4.1: pH Value Graph Figure4.2: Conductivity Test Value Graph
Figure 4.3 pH Value Graph Figure4.4: Hardness Test Value Graph
Figure4.5: Turbidity Test Value Graph Figure4.6 :TDS Test Value Graph
IJISRT21FEB566 www.ijisrt.com 861Volume 6, Issue 2, February – 2021 International Journal of Innovative Science and Research Technology
ISSN No:-2456-2165
Figure4.7: Chloride Test Value Graph Figure4.8: Alkanity Test Value Graph
Figure4.9: Flouride Test Value Graph Figure4.10: Nitrate Test Value Graph
Figure4.11:Iron Test Value Graph
V. CONCLUSION Hardness of sample 1 and sample 5 is not applicable for
suitable use as it requires effective measures to be taken to
Which preventive measures should be taken into The reduce the temporary & permanent hardness by boiling water
present investigation has led us to conclude that the quality of or using R.O. system. Therefore Alkalinity of sample 1 is also
water samples undertaken for the study was acceptable from not applicable for drinking .Too much alkalinity may also
majority of physical processes testing parameter except agitate the body’s normal pH, leading to metabolic alkalosis,
Turbidity test of sample 5 , which is problematic for drinking a condition that may produce the following symptoms:
purpose. High turbidity in drinking water can shield bacteria nausea, vomiting. For consideration before using it for
or other organisms so that chlorine cannot disinfect the water drinking purpose.The study has revealed that the ground
as effectively. Some organism found in water with high water resource of study area in few cases, the hardness of
turbidity can cause symptoms such as nausea, cramps, and water , turbidity & alkalinity of water is more than the
headach. Ultrafiltration membrane system and reverse permissible limit. The ground water resource needs to be
osmosis is necessary for this. In Chemical processes test treated to make it more palatable and useful.A comparative
parameters, water is applicable for drinking purpose except study between pH value Test and Turbidity Test Value,
IJISRT21FEB566 www.ijisrt.com 862Volume 6, Issue 2, February – 2021 International Journal of Innovative Science and Research Technology
ISSN No:-2456-2165
Hardness Test value and Turbidity Test Value, Chloride Test
value and Alkanity Test Value, Flouride Test value and
Nitrate Test Value. A poor correlations were observed b/w
pH & Turbidity, Hardness & Turbidity and Chloride &
Nitrate test values, Avery good correlations was observed b/w
Flouride and Nitrate test values.
REFERENCES
[1]. L. Elango and D. Gnanasundar ,” Ground water quality
of a Coastal Urban Aquifer”,Indian journal of
Environmental Protection, pp 752-757, 1998.
[2]. Mohd, S. Yusoff and Christopher O.
Akinble,”Environmental Impact of Leachate Pollution
on Ground Water Supplies in Akure”,Nigeria.
International lournal of Environmental Science and
Development. pp 201-264, February 2011.
[3]. O.D.Ansa-Asare and A.Y.Karikari,”Physicochemical
and Microbial Water Quality Assessment of Densu
River of Ghana”,West African Journal of Applied
Ecology, pp 87-100, 2006.
[4]. MuriGregor,”Physicochemical Characteristics of Lake
Water in 14 Slovenian Mountain Lakes”, Slovenian
Chemical Society, pp257-272, 2004.
[5]. Cong-Qiang Liu, Zhi-Qi Zhi-Qi Zhao, Yun- Chao Lang,
Si- Lang Li and Gui-Lin Han, ”Geochemistry of Surface
and Ground Water in Guiyang, China, Water/rock
Interaction and Pollution in a Karst Hydrological
System”, Applied GEOchemistry, pp 887-903, 2006.
[6]. R. Sharmila, K. Karunakaran, P. Thamilarasu,”
Statistical Study on Physicochemical Characteristics of
Ground Water in and Around Namakkal”, Tamilnadu,
Indian journal of Chemistry, pp 909-904, 2009.
[7]. A. Saraswat and D. Mohan , V.K. Singh, D.S.
Bikundia,” Ground Water Quality Assessment in the
Village of Lutfullapur, Navada, U.P.”, India,
Environment Monitoring Assessment, pp 4473-4488,
2012.
[8]. RanjanaAgarwal,”Study of Physicochemical Parameters
of Ground Water Quality of Dudu Town”, Rajasthan,
India, Indian Journal of Remote Sensing, pp969-971,
2009.
[9]. R.S. Lokhande and L.K. Dhar, ”Physicochemical and
Bacteriological Analysis of Tap Water in Gurgaon”,
Haryana, International Research Journal of
Environmental Sciences, pp 1-7, 2012.
[10]. R. Ramesh, K. Shiv Kumar, S. Eswarramoorthi and
G.R. Purvaji,”Central Eater Resources”, Anna
University, Madaras, pp 9601-9610, 1995.
[11]. R. Radhakrishna, K. Dharmaraj and RanjithaKumari,”
A Comparative Study on the Physicochemical and
Bacterial Analysis of Drinking, Borewell and Sewage
Water in Sivakasi”, Tamil nadu, India, journal of
Environmental Biology, pp105-108, 2007.
IJISRT21FEB566 www.ijisrt.com 863You can also read