MARKET GREATER BOSTON - Colliers

Page created by Lillian Blair
 
CONTINUE READING
MARKET GREATER BOSTON - Colliers
Q3 2020

GREATER BOSTON
MARKET
MARKET GREATER BOSTON - Colliers
SUPPLY AND DEMAND
                                                                           • Lab is still front and center, both in future development and
                                                                             conversions; it’s the hottest asset type out there today. 105
                                                                             W. First Street is moving forward thanks to a full building
                                                                             lease from CRISPR, adding an anchor to the emerging A
                                                                             Street Life Science Corridor. As of now, it appears that
                                                                             projects underway at the start of the pandemic will continue
                                                                             to move forward, with others hot on their heels. Winthrop
                                                                             Center received approval to modify its plans on the residential

BOSTON OVERVIEW
                                                                             component of its project, reducing the size and changing
                                                                             from condos to for-rent apartments. The office component of
                                                                             Winthrop Center is unchanged.
Conditions continue to soften in the Boston market. After a
record-setting decline in Q2, absorption struggled again in                • Demand has slowed considerably since the start of the year,
Q3, when overall negative net absorption of 1.3 million SF                   as most tenants hesitate to sign long-term commitments
sent the vacancy rate up to 12.6%, its highest rate since Q1                 or are unsure of future space needs, especially since rents
2013. Sublease space has flooded the market, adding a net                    have not declined significantly. Tech companies formerly
630,000 SF in the quarter. This marks the most sublease                      in aggressive growth modes have cooled, some reversing
space ever added to the market in a two-quarter period                       course with layoffs and space reductions. Employers from
of time, topping the figure in the early 2000s recession.                    across industries have delayed a return-to-work until 2021.
Meanwhile, rents have begun to weaken, though only                           While we haven’t seen big leases cancelled or tenants not
slightly, with Class B declining less than 1% in Q3.                         occupying space (as with Pinterest in San Francisco, or
                                                                             REI in Portland, Oregon), leasing activity is just a fraction
Employees have hesitated to return to the office, as
                                                                             of its normal market rate. Boston and the surrounding area
remote work has taken hold across many office-intensive
                                                                             rank among the top spots across the country for VC funding
industries until the successful development and distribution
                                                                             to cutting-edge technology — from autonomous vehicles,
of a COVID-19 vaccine. This is further delaying the ultimate
                                                                             cybersecurity, IoT, robotics, AI/machine learning, and
decision-making of many firms, which are unable to project
                                                                             biotech/life science — supporting new businesses going
their future space needs. The back-to-school challenges of
                                                                             forward. Life science VC investment has never been stronger.
remote or hybrid education will keep many office workers
at home, at least part-time, for the foreseeable future. This
shift could profoundly affect office vacancies in Boston, but
it will take time to manifest.                                                  SOME OF THE LARGER REQUIREMENTS INCLUDE:

                                                                                                             350K
                                                                                                     50      Eaton Vance

      12.6%                       1.3M                     2.7M
     vacancy rate               SF negative
                                absorption
                                                           SF total
                                                        sublease space
                                                                                                             225K
                                                                                                             Loomis Sayles & Co

Statistics in the core submarkets are as follows:                                                            80K
                                              VACANCY       YTD 2020                                         Whoop
 MARKET SEGMENT              SUPPLY
                                               RATE*       ABSORPTION
 Back Bay                     13,379,652       9.7%           (435,792)
 Class A
 Class B
                              11,549,046
                               1,830,606
                                               9.4%
                                               11.3%
                                                              (393,440)
                                                               (42,352)
                                                                                                             70K
                                                                                                             Sasaki
 Financial District           34,354,264       13.4%          (627,742)
 Class A                      28,676,597       12.1%           (502,140)
 Class B
 Seaport
                               5,677,667
                              12,002,934
                                               20.0%
                                               16.2%
                                                              (125,602)
                                                                 48,290
                                                                                                             60K
                                                                                                             American Well
 Class A                       5,964,295       12.3%              5,760
 Class B                       6,038,639       19.9%             42,530

                                                                                                             45K
 * includes sublease space

                                                                                                             Tessera Therapeutics
MARKET GREATER BOSTON - Colliers
Highlighted transactions from this quarter include:
                                                                                                                                RENTAL RATES

                                                                                                                                                                                                               BOSTON
                                                                                                                                • Rents are showing limited signs of decline. In aggregate they
                        Back Bay         Financial District         Seaport               Fenway
                                                                                                                                  continue to hold, but differences are emerging between Class A
                                                                                                                                  and B. Class B rents fell less than 1% in Q3. We had seen some
                  CRISPR | 105 W. First Street
                                                                                                                                  adjustments in rents quarter-to-quarter at a building level in Q2,
                  Columbia Threadneedle | 290 Congress Street                                                                     which continued in Q3. Landlords have been trying to hold on to
                  Chewy.com | 343 Congress Street                                                                                 face rents, but they increased concessions in the form of more
                                                                                                                                  free rent or a higher tenant improvement allowance (i.e., turnkey
                  Pearson | 1 Federal Street
                                                                                                                                  space). The surge in sublease space has caused Class B rents to
                                   Citadel Investment Group | 28 State Street                                                     soften first. If history is a guide, it will take time for price discovery
                                Frontier Capital | 99 Summer Street                                                               and for rents to hit bottom. From there, rents tend to stabilize
                                                                                                                                  before recovering, which can take years. With limited leasing
                                                                                                                                  velocity, there are few deals to help set the market.
                         10K     20K    30K   40K     50K     60K     70K      80K             260K
                  Square Feet
                                                                                                                                  The spread between asking rents in various segments of the
                 ABSORPTION, VACANCY, AND FORECAST                                                                                market is depicted below:
                 • Absorption was negative in Q3, declining a net 1.3 million SF.
                   Vacancies rose to 12.6%, up 1.8 percentage points from last
                   quarter and 4.4 percentage points from one year prior, and are
                   now back to 2013 levels. Both Class A (negative 980,000 SF)
                   and Class B (negative 286,000 SF) vacancies increased. The
                   biggest difference was between direct and sublease vacancy. In
                   Q2 sublease space additions outpaced those of direct space, but
                                                                                                                                   $80-$115            $65-$80            $60-$65                $50-$65
                   in the third quarter both increased about 630,000 SF. The North                                               Class A High Rise   Class A Mid Rise    Class A Low Rise         Class B

                   Station market has the highest ratio of sublease space, at 7.9%,
                   and also the highest vacancy level, 23.2%.                                                                   LOOKING AHEAD...
                                                                                                                                • Neither Boston nor the U.S. economy has experienced the kind
                                                                                                                                  of concerted, deliberate pullback in economic activity seen in
                                                                                                                                  the COVID-19 pandemic. Economic figures have been ugly,
                      The outlook is unknowable. However, we are                                                                  businesses are closing and will continue to close, and human
                      projecting limited business activity by year-                                                               lives are being lost to the virus, all together, not a normal end to
                      end, before a resumption next year, resulting                                                               a business cycle. In this situation, we have to take a wait-and-
                      in a lower absorption projection for 2020. At                                                               see approach, as past experience, while a helpful guide, is much
                      this time, we’re holding to our supply forecast                                                             less comparable, given the unprecedented nature of intentionally
                                                                                                                                  pressing pause on almost all economic activity and then
                      in the chart below, with the caveat that project
                                                                                                                                  restarting in a staggered approach.
                      completion dates could be adjusted, based on
                                                                                                                                • Coworking is showing signs of a retreat. Regus, Greater Boston’s
                      how social distancing affects timelines.
                                                                                                                                  second-largest flexible office provider, has filed for bankruptcy
                                                                                                                                  in some of its locations, including three in the Boston area,
                                                                                                                                  while WeWork wants to get out of some of its space in Boston
                                                                                                                                  (it has let leases lapse in other markets, and pulled out of other
                                                                                                                                  locations across the country). The growth of coworking has been
                      Forecast | Vacancy & Absorption                                                                             well documented, and if it unravels as an industry, it will only add
                                                                                                                                  more stress to the office market as WeWork is Boston’s second-
             4,000
                                                                                    Forecast
                                                                                                           16%
                                                                                                                                  largest tenant.
                                                                              14%
             3,000                                                                                 13.1%   14%

             2,000                                                                                         12%
                                                                                                                                                                   105 W 1st Street | CRISPR Deal
             1,000                                                                                         10%
                                                                                                                 Vacancy Rate

                                                                                                                                                                   Boston, MA
SF (000s)

                 0                                                                                         8%                                                      Source: www.bostonglobe.com
            (1,000)                                                                                        6%

            (2,000)                                                                                        4%

            (3,000)                                                                                        2%

            (4,000)                                                                                        0%

                           Absorption    Supply     Vacancy
MARKET GREATER BOSTON - Colliers
OFFICE MARKET

                                                                      • Office absorption was negative 163,000 SF in the third quarter. All
                                                                        three submarkets posted negative absorption. Rents meanwhile
                                                                        softened, however this is more a result of a changing sample size,
                                                                        than true market weakness.
                                                                      • Sublease space, while increasing, is modest. Overall levels are akin
                                                                        to those at the end of 2019. While sublease space held flat at mid-
                                                                        year, it increased by 80,000 SF in Q3.

                                                                           Life science companies needing office space
                                                                           are looking to Boston for growth or relocation,
CAMBRIDGE OVERVIEW                                                         particularly out of East Cambridge, for rent
The Cambridge market remains relatively unscathed by the                   savings north of $20/SF that could push beyond
ongoing global pandemic. With the biotech sector’s deep                    $30/SF. Case in point: bluebird bio plans to
strength in research and development, Cambridge-based
firms are at the forefront of COVID-19 research and therapies.
                                                                           offer the office space at 50 Binney Street in
Tremendous capital flowing into life science from government               Cambridge for sublease (it had subleased it
grants, NIH funding, M&A, and venture capital is essentially               from Sanofi) with a number pushing $100/SF
speeding up our medical research. That should be good news
for startups and demand in the Cambridge and broader life
                                                                           triple-net, to be available when Sanofi moves to
science marketplace into the future.                                       its new headquarters in 2022. An increase in
Vacancies barely budged in the third quarter, up to 4.5%, and              quality sublease space in Boston makes it even
rents softened slightly. However, given the low vacancy rates,             more appealing for cost-conscious firms.
any change in direct vacancy can have an outsized impact on
rent levels. As Boston and the suburbs held flat, that is the
likely outcome in Cambridge as well. New development, which
is highly preleased, has yet to come on the market, and new
projects have recently been announced. Tenants continue to look
to Cambridge for expansion, as seen by Bristol-Myers Squibb’s                LAB MARKET
recent deal at Cambridge Crossing.
                                                                      • Lab vacancies are moving down — decreasing modestly to 1.7%
                                                                        during the quarter — the opposite of the direction of office market
                                                                        vacancies. Both direct and sublease lab space decreased. East

     4.5%                 80K                     0.3%
                                                                        Cambridge vacancies are pushing a record low.
                                                                      • Bristol-Myers Squibb’s 360,000 SF lease at Cambridge Crossing
                                                                        will help the firm consolidate operations under one roof. Its current
  vacancy rate           SF negative           East Cambridge
                         absorption           lab vacancy rate          locations will likely be gobbled up before it even moves.

Key statistics for the quarter include:
                                                                           The active tenant-in-the-market list shrunk
                   SUPPLY SF     VACANCY      ABSORPTION (000s)
 MARKET
                     (000s)        RATE           Q3 2020                  quickly at the outset of the COVID-19 pandemic.
 Total Cambridge       24,721          4.5%                  (80)          However, that list is filling back up. The current
                                                                           active tenant requirement list is dominated
                       11,948          7.4%                 (163)
                                                                           by Series A and early-stage firms, which are
                                                                           seeing strong capital inflows from VC firms and
                       12,774          1.7%                      83        a healthy IPO market.
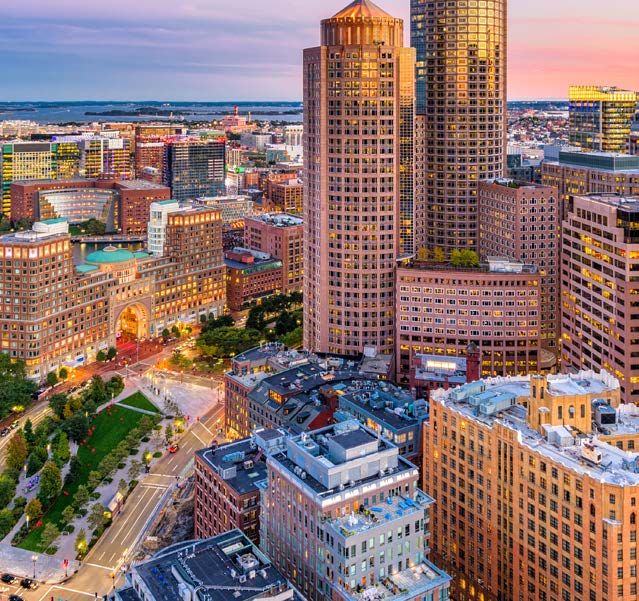
MARKET GREATER BOSTON - Colliers
CAMBRIDGE
                                                                                      LOOKING AHEAD…

                                                                                      • The underlying fundamentals of Massachusetts’ life science
                                                                                        market remain sound despite the COVID-19 outbreak. As the
                                                                                        global R&D epicenter, Cambridge is still at the forefront of
                                                                                        cutting-edge therapies and treatments for a wide range of
                                                                                        medical conditions. The life science industry has clustered
                                                                                        around Kendall Square for a number of reasons, chiefly
                                              Bristol-Myers Squibb Lease
                                              Cambridge Crossing | Cambridge, MA        connections to both talent from MIT and mass transit.
                                              Source: www.bldup.com

Highlighted active tenants and recent transactions are                                       But competition is appearing. The A Street
shown in the tables below.                                                                   Corridor in Boston, Harvard’s planned
                                                                                             expansion in Allston, and multiple locations
                                                                                             in Somerville all aim to become the next
                                       200K                                                  “it” location for life science. The Cambridge
                                                                                             market will remain at the center of this
                                       Ragon Institute
                             20                                                              industry and drive growth, but in the years
                                                                                             ahead will have far more competition. In fact,
                                                                                             some of Cambridge’s largest landlords are

                                       200K                                                  investing in new markets. BioMed recently
                                                                                             joined Somerville’s Xmbly development,
                                       GSK
                                                                                             while Alexandria has focused on Watertown,
                                                                                             Waltham, and Boston.

                                       150K
                                       Smartlabs
                                                                                      • Alewife could be next in line for Cambridge’s surging life science
                                                                                        market growth. Across the train tracks from Cambridgepark

                                       100K                                             Drive, properties off Concord Avenue could be the next relief
                                                                                        valve, and recent investment/property turnover there suggests
                                       TCR2                                             that redevelopment is not far off. Since Alewife is just a few
                                                                                        stops away on the Red Line, the area might offer alternatives
                                                                                        to East Cambridge firms needing space. Cambridge needs new

                                       80K                                              areas to emerge to maintain its competitive advantage because
                                                                                        of Kendall’s limited growth opportunities.
                                       Constellation

 VELOCITY

      East Cambridge         Alewife         Harvard Square

 Bristol-Myers Squibb

 GCP Applied Technologies
 Verve

 Korro

 QurAlis

0K      5K    10K      15K    20K              280K      285K    290K          360K
Square Feet
MARKET GREATER BOSTON - Colliers
SUPPLY AND DEMAND

                                                                              Underway projects are driven by a mix of build-
                                                                              to-suits (Olympus in Westborough) and life
                                                                              science (225 Wyman St., Waltham; 75 Hayden
                                                                              Ave., Lexington; 101 South St., Somerville).

SUBURBAN OVERVIEW
                                                                              There are conversions underway in Watertown,
                                                                              Waltham, and Lexington (among others), to make
 Boston’s suburban market had a generally slow third quarter, save
                                                                              buildings lab or lab-ready. Lab has become the
 for the former Reebok campus in Canton coming off the market.                main driver of the pipeline. And that looks to hold:
 The property was purchased by Tufts, and removes the largest                 the next development cycle is becoming clearer,
 block of vacancy in the suburbs. Outside of that, leasing velocity is
 well below normal levels, like downtown Boston’s. Sublease space
                                                                              with Alexandria recently purchasing a portfolio in
 has started to increase (860,000 SF in the quarter), putting it in           Waltham, including a development site, as well as
 league with the surge of that space downtown. PTC’s sublease                 land in Watertown.
 space at 140 Kendrick in Needham has been a bright spot, with
 strong interest and additional LOIs signed in the quarter. Overall
 suburban vacancies moved up 1.3 percentage points in the third
 quarter, to 17.2%. Lab has been the best story, posting positive
                                                                         • Life science has been a key driver across Greater Boston, and
 absorption on the year, while office has turned negative.
                                                                           the suburbs are no exception. Year-to-date, lab accounts for
 There is talk in the market, though we have yet to see it, of a           all positive suburban absorption. Two million SF of life science
 trend to move back to the suburbs. Some groups are considering            growth has come to the suburbs, including lab/manufacturing
 suburban offices in addition to their urban spaces. While we              space in recent years, and 75 Hayden Ave. in Lexington will
 do not expect a reversal in the urbanization trend of recent              deliver fully occupied in Q4 after strong leasing.
 years, opportunities exist for landlords. At the end of the day, a
                                                                         • The suburbs’ highly educated workforce has been driving strong
 diversified base of industries and a rapidly expanding life science
                                                                           demand from numerous industries and business categories.
 market have been and remain the backbone of suburban Boston’s
                                                                           The suburban markets have long been dominated by technology
 office market.
                                                                           companies, but technology has evolved to software as a service
                                                                           (SaaS), 3-D printing, robotics, manufacturing, and life sciences,
                                                                           now current and future drivers of the market. Healthcare and
                                                                           medical and business services have remained key drivers.

      17.2%                  1.5M                      FLAT
    vacancy rate           SF negative                quarterly
                           absorption              rent movement

                                                                                                               “The Block”
                                                                                                               Canton, MA
Aggregate statistics for the office and lab market                                                             Source: www.bizjournal.com | les vants photography

are provided below:
 MARKET/                                 VACANCY     ABSORPTION SF
                     SUPPLY SF (000s)
 SUBMARKETS                                RATE         Q3 2020

 Suburban Boston           123,666        17.2%          (1,454)
 Inner Suburbs               6,876        14.1%           (150)
 Route 128                  68,296        14.6%           (251)
 Route 495                  45,602        21.7%           (938)
 Worcester                   2,892        16.7%           (115)
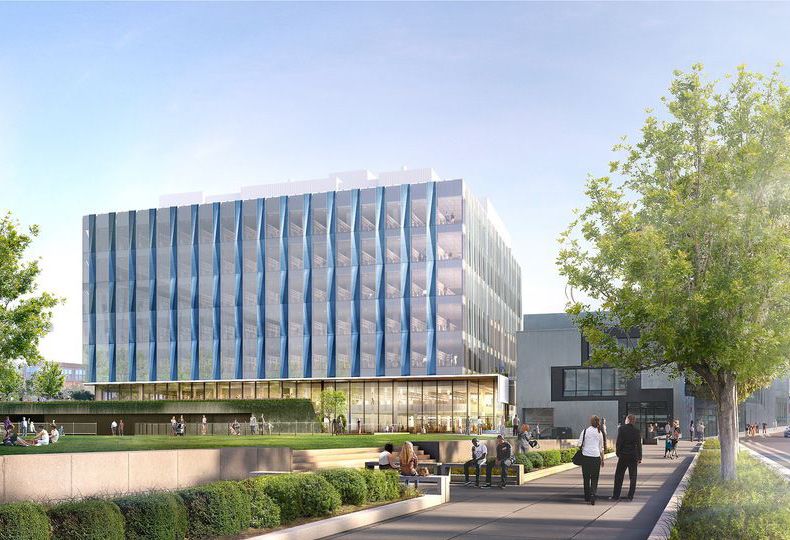
MARKET GREATER BOSTON - Colliers
SUBURBAN
 Some of the larger requirements include:

                              50          150K
                                          ZoomInfo

                                          150K
                                          Translate Bio

                                          90K
                                          Siemens                                      • Rents held flat in the third quarter in aggregate, continuing
                                                                                         their pattern from the start of the year. However, as vacancies

                                          60K
                                                                                         started to rise in the third quarter, the suburbs’ most expensive
                                                                                         submarkets, 128 Mass Pike, 128 Northwest, and Inner Suburbs,
                                          Ophthalmic Consultants                         have shown signs of rent declines. As in Boston, concessions
                                          of Boston                                      to get a deal over the finish line are now more common.

                                          50K                                          LOOKING AHEAD…
                                          6 River Systems/Shopify

                                          40K
                                                                                       • The future of work is an open-ended question: how much space
                                                                                         tenants will need in a post-pandemic world is unknown. Where
                                          Vicarious Surgical                             employees work is likely to become more flexible, and a distributed
                                                                                         workforce has been floated as a possible future space-planning
                                                                                         strategy. Will this cause a sea change in the suburbs? Tenant
 Some of the larger transactions during the quarter included:
                                                                                         relocations out of Boston have been limited to small firms, but
                                                                                         some larger operations are considering the move. Life science and
       Inner Suburbs          Route 128          Route 495         Worcester
                                                                                         tech have been pushed out of Cambridge for years, but that hasn’t
                                                                                         happened yet in Boston. With substantial projects around the Mass
  Azzur Group                                                                            Pike coming up in the years ahead, some suburban flight could be
  Affinia Therapeutics                                                                   just around the corner.

  Integral Health
  Dragonfly Therapeutics

                              The Hilb Group of New England LLC
                                                                                            The future of large blocks is the key to
                Meta Systems
                                                                                            the suburbs’ rebound. They have been
       5K     10K      15K   20K   25K     30K   35K   40K   45K     50K   55K   60K        dealing with large-scale vacant blocks
Square Feet
                                                                                            caused by space givebacks from State
                                                                                            Street, Computershare, Eisai, Oracle,
                                                                                            Sanofi, Philips, and others, while upcoming
ABSORPTION, VACANCY, AND FORECAST
                                                                                            losses from Puma and more fallout from
• Absorption took a sharp turn down in the third quarter, by                                Sanofi are next. These big blocks weigh
  negative 1.5 million SF, the first quarter with such losses since                         on the suburban market: Spaces larger
  the first quarter of 2009. These losses were widespread in
                                                                                            than 100,000 SF account for 28% of total
  markets, except 128 South, supported by the completion of two
  build-to-suit projects for Meketa and Citizens Bank, and Tufts’                           vacancy. As these big blocks go, so goes
  purchase of the former Reebok campus, dubbed The Block. Both                              the suburban market.
  direct and sublease space increased, after holding steady at
  midyear. Vacancies are back to 17.2%, reminiscent of early 2018
  levels.
MARKET GREATER BOSTON - Colliers
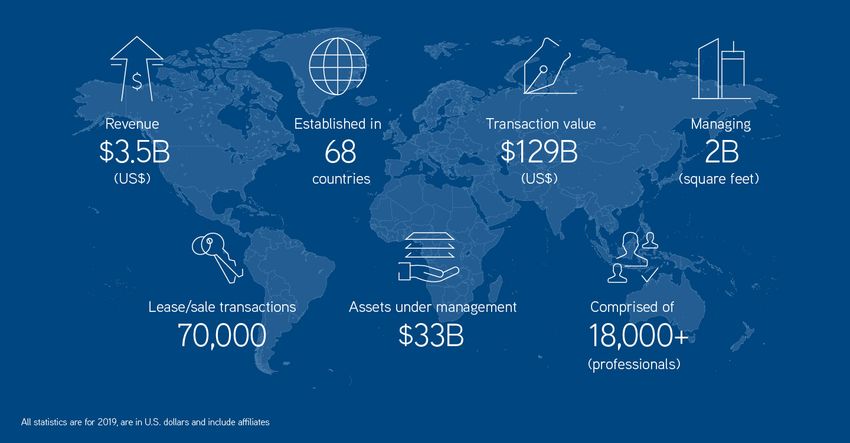
CAPITAL MARKETS                                              OFFICE/LAB

SALES AND HIGHLIGHTS                                                      1 UPLAND ROAD
                                                                          NORWOOD
• The debt markets are alive and well. Interest rates
  are favorable, and lenders are back in the game.
                                                                          BUYER: 		 ALEXANDRIA REAL
                                                                                    ESTATE EQUITIES
 Transaction volumes have slumped, a                                      PRICE: 		 $97,783,696
 national phenomenon, but should start to                                 PSF: 		 $440
 improve later this year, into next, as deals
 have started to come back to the market.

• International capital sources are still looking, focused
  on core. A persistent low-interest-rate environment        OFFICE/LAB
  will drive investors to real estate over time.
                                                                          151 CAMPANELLI DRIVE
• Lab and industrial are the favored asset classes.                       MIDDLEBOROUGH
  Triple-net deals with term are easier to transact. The
  inherent growth within e-commerce and life science
  is a major positive in favor of these asset classes.                    BUYER: 		 BOYD WATTERSON
                                                                                    ASSET MANAGEMENT
                                                                          PRICE: 		 $15,900,000
                                                                          PSF: 		 $272

 OFFICE/LAB                                                  OFFICE/LAB

                       40-50-60 SYLVAN ROAD                               405 COCHITUATE ROAD
                       WALTHAM                                            FRAMINGHAM

                       BUYER: 		 ALEXANDRIA REAL 		                       BUYER: 		 R.J. KELLY COMPANY
                                 ESTATE EQUITIES                          PRICE: 		 $12,400,000
                       PRICE: 		 $330,000,000                             PSF: 		 $291
                       PSF: 		 $644

OFFICE/LAB                                                   OFFICE/LAB

                       36-64 WHITTEMORE AVE                               60 HICKORY DRIVE
                       CAMBRIDGE                                          WALTHAM

                       BUYER: 		 IQHQ                                     BUYER: 		 KHS MANAGEMENT
                       PRICE: 		 $125,000,000                             PRICE: 		 $12,050,000
                       PSF: 		 $435                                       PSF: 		 $208
MARKET GREATER BOSTON - Colliers
CAPITAL MARKETS
MULTI-FAMILY                                     INDUSTRIAL

               BELL STOUGHTON                                 3 TECHNOLOGY DRIVE
               400 TECHNOLOGY CENTER DRIVE,                   PEABODY
               STOUGHTON

                                                              BUYER: 		 WHEELOCK STREET CAPITAL
               BUYER: 		 BELL PARTNERS
                                                              PRICE: 		 $30,100,000
               PRICE: 		 $71,650,000
                                                              PSF: 		 $189
               $/UNIT: 		 $298,541

MULTI-FAMILY                                     INDUSTRIAL

               56-58 WALNUT STREET                            97 AND 103 WOOD STREET
               56-58 WALNUT STREET, SOMERVILLE                MIDDLEBOROUGH

               BUYER: 		 SAVAGE PROPERTIES                    BUYER: 		 THE SEYON GROUP
               PRICE: 		 $8,750,000                           PRICE: 		 $26,805,000
               PSF: 		 $795,454                               PSF: 		 $125

RETAIL                                           INDUSTRIAL

               BRISTOL SQUARE                                 25 COMPUTER DRIVE
               1428 MAIN STREET, WALPOLE                      HAVERHILL

               BUYER: 		 CROSSPOINT ASSOCIATES                BUYER: 		 EASTERN REAL ESTATE
               PRICE: 		 $9,200,000                           PRICE: 		 $14,000,000
               PSF: 		 $471                                   PSF: 		 $100

RETAIL                                           INDUSTRIAL

               21-29 BEALE STREET                             15 RIVERDALE AVE
               21-29 BEALE STREET, QUINCY                     NEWTON

               BUYER: 		 KWAN HA CHAN                         BUYER: 		 CRITERION DEVELOPMENT
                                                                        PARTNERS
               PRICE: 		 $5,180,000
                                                              PRICE: 		 $13,260,000
               PSF: 		 $441
                                                              PSF: 		 $250
MARKET GREATER BOSTON - Colliers
WE ARE COLLIERS.
        WE ARE: GLOBAL GROUNDED INTEGRATED
        RESOURCEFUL ACCOMPLISHED WE ARE

WE ARE GLOBAL.
With offices in 68 countries, Colliers International is armed with the talent and expertise to meet your needs
and exceed your expectations in virtually every major market worldwide.
The foundation of our service is the strength and depth of our specialists. Our clients depend on our ability to
draw on years of direct experience in their local market. Our professionals know their communities and the
industry inside and out. Whether you are a local firm or a global organization, we provide creative solutions for
all your real estate needs.

WE ARE GROUNDED.
Despite our strong global connections, our local office is deeply rooted in Boston, tracing its history back to
1875 when we were founded as Meredith & Grew. We have been directly involved in several of the major
projects that have shaped Greater Boston as we see it today and are as committed to the future of this City and
market as we are invested in its past.
COLLIERS INTERNATIONAL
WE ARE INTEGRATED.
A full service platform alone is not a differentiator, but cohesive,
multidisciplinary collaboration is. At Colliers, we advocate complete
transparency between our service lines, resulting in the maximum
benefit to you. When we can see the big picture from all service
angles, it uncovers and unlocks opportunities that would otherwise
remain hidden in a silo approach, and enables thoughtful and proactive
decision-making for you.

WE ARE RESOURCEFUL.
A deep bench of industry, geography, and subject matter specialists, combined with an unrivaled set of research and marketing
tools allows Colliers to take a fully client-centric approach. We staff projects with representatives and resources that will add the
most value to an assignment and ultimately accelerate your success.

WE ARE ACCOMPLISHED.
Colliers has been built upon a foundation of success, resulting from habitual good practices, overwhelmingly sound principles,
and a perpetual desire to improve. The launch of new disciplines over the years has purely resulted from our clients’ evolving
needs, and has proven successful as most repeat clients choose to leverage the broader Colliers service lines.

WE AT COLLIERS ARE ALL OF THIS AND MORE.
YOU ARE THE BENEFICIARY.
MARKET SNAPSHOT
            Q3 2020 STATISTICS | OFFICE & LAB / CLASS A & CLASS B

                                                         SQUARE FEET (SF)                DIRECT SF           SUBLEASE SF                                        CURRENT                       YTD
              MARKET                                                                                                                     VACANCY*
                                                                  SUPPLY                 AVAILABLE             AVAILABLE                                     ABSORPTION                ABSORPTION
              BOSTON                                                72,329,609             6,368,610                2,717,846                   12.6%           (1,266,486)               (2,931,430)

                                         BACK BAY                    13,379,652               704,820                 589,562                    9.7%              (435,792)                 (726,134)

                            FINANCIAL DISTRICT                       34,354,264             3,207,439                1,390,515                  13.4%              (627,742)               (1,443,346)

                          ALLSTON / BRIGHTON                            962,443                       0                 19,000                   2.0%                        -                (19,000)

                                  CHARLESTOWN                          2,787,176              279,399                  65,906                   12.4%               (75,291)                 (177,294)

                                     CROSSTOWN                        1,025,000                 52,371                        0                   5.1%              (34,521)                  (49,918)

                            FENWAY / KENMORE                          4,257,995                 71,077                  81,469                   3.6%                    1,931                (79,538)

                                 NORTH STATION                        2,245,004               344,221                  177,410                  23.2%              (121,709)                 (274,014)

                                         SEAPORT                     12,002,934             1,593,003                 345,801                   16.2%                 48,290                  (99,873)

                                 SOUTH STATION                          1,315,141              116,280                  48,183                  12.5%               (21,652)                  (62,313)

              CAMBRIDGE                                              24,721,343               645,962                466,507                     4.5%              (80,345)                   331,785

                 ALEWIFE STATION / ROUTE 2                            3,040,614                221,999                 185,165                  13.4%               (12,883)                  244,273

                               EAST CAMBRIDGE                         19,781,234              346,248                 229,478                    2.9%               (42,399)                    90,779

              HARVARD SQUARE / MASS AVE                                1,899,495                 77,715                 51,864                   6.8%               (25,063)                   (3,267)

              SUBURBS                                              123,665,783            18,278,387               2,996,093                    17.2%           (1,453,506)               (1,099,185)

                                INNER SUBURBS                         6,875,904               883,346                   84,160                   14.1%             (149,723)                 (114,483)

                              ROUTE 128 NORTH                          7,418,401             1,173,509                  16,582                  16.0%              (241,900)                (266,578)

                       ROUTE 128 NORTHWEST                           21,346,456              2,415,798                 381,710                   13.1%             (241,900)                 (331,322)

                         ROUTE 128 MASS PIKE                         22,739,404             2,867,924                  813,837                  16.2%              (348,752)                  132,050

                              ROUTE 128 SOUTH                         16,791,359             1,794,382                480,756                   13.5%                581,236                  732,333

                              ROUTE 495 NORTH                         21,028,418            4,350,533                  551,791                  23.3%             (326,496)                  (414,935)

                               ROUTE 495 WEST                        21,346,820             4,090,360                 488,280                   21.4%             (506,765)                 (538,963)

                              ROUTE 495 SOUTH                         3,227,097                319,753                  78,977                  12.4%              (104,672)                  (88,001)

                                      WORCESTER                        2,891,924              382,782                 100,000                   16.7%              (114,534)                (209,286)

              MARKET TOTALS                                        220,716,735            25,292,959                6,180,446                   14.3%          (2,800,337)               (3,698,830)

            *Including sublease space

CONTACT:
AARON JODKA                                     DION SORRENTINO                                        NICK DESSALINES
Director of Research                            Research Analyst                                       Research Analyst
+1 617 330 8059                                 +1 617 330 8148                                        +1 617 330 8145
                                                                                                                                                                    FOLLOW US:
aaron.jodka@colliers.com                        dion.sorrentino@colliers.com                           nick.dessalines@colliers.com

Colliers International | 160 Federal Street | Boston, MA 02110                                                                                                                             www.colliers.com
In the midst of the COVID-19 outbreak, information and data is emerging at a quick and uneven rate. The information contained herein has been obtained from sources deemed reliable at the time the report was written.
While every reasonable effort has been made to ensure its accuracy, we cannot guarantee it. No responsibility is assumed for any inaccuracies. Readers are encouraged to consult their professional advisors prior to
acting on any of the material contained in this report. ©2020 Colliers International. All rights reserved.
You can also read