MARKET INTELLIGENCE REPORT - SMALL AND MEDIUM-SIZED ENTERPRISES Q1 2022 - ABC Business Sales
←
→
Page content transcription
If your browser does not render page correctly, please read the page content below

Licensed REA 2008

MARKET INTELLIGENCE
REPORT

SMALL AND MEDIUM-SIZED ENTERPRISES
Q1 - 2022

EXECUTIVE SUMMARY
This is our fifth Market Intelligence Report (inaugural report Oct-20) and for
the first time since this report was initiated, we have witnessed new market
trends. The business sales market is no longer continuing to experience a
significant gap between supply and demand which has previously been the
case.

Demand data points, such as signed confidentiality agreements by prospective
buyers, have shown a small decline compared to the same period last year.

Supply data points, such as new businesses listed for sale, have shown a small
increase both at a total market level (1%) and ABC level (7%). This is evidenced
in this report by the following tables and graphs.

The market conditions historically showed excess demand and reduced supply
characteristics. The new data is showing early signs of this trend being reversed
with more businesses coming to market, and demand trends declining year
on year.

The average business prices have continued to increase for the latest data
period, but we expect this to flatten off with supply now starting to match
demand, and external factors - such as increasing interest rates - keeping
asset prices flat for the remainder of 2022.

2022/23 Projections for Business Sales
This report includes data up to March-22 and it has been well-documented (by various
third-party reports) that it has been a record year for M&A activity in New Zealand. ABC
data reflects this statement hence the real question is, will these record levels of business
sales activity continue for 2022/23? We have no early warning signs to suggest we will
experience a material drop-off this year in activity. The current data in regards to supply
and demand drivers confirms we no longer have a mismatch (demand exceeding supply)
and there will be a more evenly balanced marketplace between sellers and buyers i.e. less
of a sellers’ market.

With a high probability of lockdowns no longer being part of New Zealand’s COVID
toolbox response in 2022/23, and overseas travel now possible by the first quarter of 2022,
we believe many business owners will take the opportunity to divest their businesses.
Increased certainty will provide investors more confidence to invest in business ownership
and vendors will have more motivation to sell given the increased travel & leisure options
available to them. This is particularly relevant to the baby boomers who currently own
the majority of NZ’s privately-owned businesses. We believe 2022/23 has the potential to
be another record year for business sales given an element of pent-up supply caused by
business owners who weren’t comfortable selling their business in a COVID environment.
The bounce back to more normal economic settings in 2022/23 will provide more
confidence & certainty to both sellers and purchasers and, in our view, result in more
transactions occurring.
Signed Confidentiality Agreements
              Per Month
                                               DEMAND DATA POINTS
 Month      2020/21   2021/22   % Change

  April      684       1212       77%                 SIGNED CONFIDENTIALITY
  May        1127      1473       31%                           AGREEMENTS
  June       1285      1542       20%
                                           Signed confidentiality agreements completed by potential
  July       1392      1432       3%
                                           purchasers have decreased by 7% when comparing the
 August      1287      1254       -3%
                                           12 months to March-21, we believe this is driven by the
September    1160       1111      -4%
                                           following factors:
 October     1315      1235       -6%

November     1334       918       -31%     •   A highly-employed population with New Zealand
December     1267      800        -37%         experiencing record lows of unemployment.
 January     1653       1116      -32%     •   The Mar-21 period had record levels of expats returning
February     1379      995        -28%         post the initial COVID outbreak and they were actively
  March      1493      1172       -22%         seeking properties, cars, and business purchases. The
  Total     15,376    14,260      -7%          expat returnee levels flattened off for the Mar-22 year.
                                           •   The introduction of higher interest rates to New
                                               Zealand’s economy has reduced the demand for all
                                               investment asset classes across the board.
IS THE
    TIDE
TURNING?
DEMAND DATA POINTS
MONTHLY WEBSITE
TRAFFIC - ABC WEBSITE
This chart shows the monthly website traffic to the ABC website
- a measure of people investigating business ownership.

The 12 months to Mar-22 show a 10% increase in visitor traffic
to our ABC Business Sales website compared to last year.
However, if we break this into six-month increments, the last
six months have experienced a 10% decline in website traffic
vs the first six months which was up 42%.

Key reason for the 10% decline are low unemployment,
increasing interest rates and lower volumes of expats returning
during the Oct-21 to Mar-22 period.

The ABC website had a total of 307,686 visitors for the last
12 months - up from 277,320 for the same period in the last
financial year.
SUPPLY DATA POINTS
BUSINESSES LISTED
FOR SALE - TRADEME
This chart looks at the trend of businesses listed for sale across New
Zealand via TradeMe. As you can see the trend is flat year-on-year
and this has deviated from a negative trend that saw new listings
dropping over the last two years. The latest data indicates we have
hit our lowest point for new business listings and we can expect
increases going forward.

                                                                         For the 12 months to Mar-20, the average listings on the website
                                                                         were 5,105. This declined by 16.5% to Mar-21 as the average listings
                                                                         for this period were 4,275 and they have now flattened off to
                                                                         4,300 for Mar-22.
SUPPLY DATA POINTS
NEW LISTINGS
ABC has experienced a 7% increase in new business listings for the
12 months to Mar-22 when compared to Mar-21. This is the first time
since COVID started we have had an annual increase in new businesses
being listed for sale.
The key reasons provided by business owners wanting to sell their
businesses are as follows:
• The COVID environment has generated (for a number of industries)
above-normal financial returns, and business owners are looking
to cash in on these financial results with a successful business sale.
• COVID has resulted in a higher frequency of difficult situations to
manage in regards to staff and suppliers, which for older business
owners has been a key contributor for wanting to sell the business.
• A number of older business owners held onto their business during
the early stages of COVID to ensure their sustainability but are now
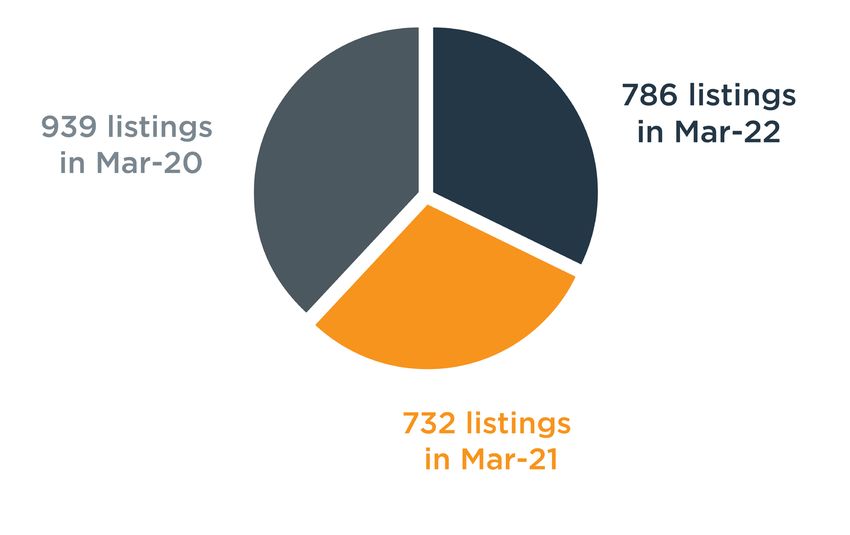
ready to retire and enjoy a post-COVID world.ABC COMPLETED BUSINESS SALES VOLUMES PER LOCATION As per the graph, completed business sales volumes for 12 months to March 2022 are up 7% compared to March-21 and 9% compared to March-20. This is the result of a very strong market where the majority of businesses listed for sale are being sold. A number of businesses are being sold at above asking price and getting multiple offers before the full marketing campaign takes place. There is no doubt we have been in a “Sellers’ Market” given the dynamics at play. For the 12 months to March 2022, ABC sold 405 vs total listings of 786 equating to a conversion rate of 52%. This is a record rate given historically conversion rates have been in the region of 35-40%. What will be interesting to gauge is if these high conversion rates continue for the 2022/23 year with recent data suggesting new businesses listed for sale are increasing and the demand statistics are decreasing. If this scenario continues, we may be in the early stages of moving to a buyers’ market.
BUSINESS                                              Divisions                Mar-20            Mar-21             Mar-22          Mar-22 vs Mar-21   Mar-22 vs Mar-20

PRICE
                                               General Business Avge
                                                                              $652,317          $703,701           $810,255               15%                24%
                                                       Price

TRENDS
                                              Hospitality Business Avge
                                                                              $193,370          $177,255           $304,994               72%                58%
                                                         Price

Here’s what this table tells us:
Overall, the average price for SME businesses ($0-$5m) excluding Hospitality has increased by 15% for the 12 months to March
2022. The 15% price increase has been driven by a buoyant market with demand exceeding supply for quality businesses and
forcing purchasers to pay higher prices. A number of other data sources (Recent PWC M&A Report) endorse this trend of
business assets increasing in value and are all driven by the same factors; increased buyer demand chasing a scarcity in supply of
quality businesses. The increased demand is driven by investors chasing higher yields and an abundance of capital in the hands
of retail and wholesale investors.

The average price for Hospitality businesses ($0-$5m) has seen a 72% increase for the 12 months to March 2022. It has been
well-documented the adverse effects COVID has caused this industry in the initial lockdowns which formed part of the March-21
numbers. The data clearly shows a bounce back in hospitality prices. We believe this is the direct result of hospitality prices
coming off a very low base price that was caused by the initial COVID lockdowns in the period to Mar-21. The Mar-22 average
hospitality price of $304,994 is more reflective of a normal market, and we believe these prices will be sustained going forward.

The data-set used for the average price calculations are all the transactions completed by ABC Group in the $0-$5m price range.
It should be noted that ABC Group has approximately 35%-40% market share of this segment and hence this data is regarded as
accurate and meaningful.

The proportion of NZ businesses in the $0-$5m segment is approximately 89% of all businesses in New Zealand. As per Stats
NZ, 189,384 entities have one employee or more and 167,790 of these entities have between 1 - 19 employees; the majority of the
businesses with 1-19 employees would be valued between $0-$5m.
Bank Term Deposit Rates vs
Privately Owned Business Returns
Segment Mar-22 Avge Return % Return
General Business Avge
$810,255 $234,974 29%
Price (NZ)
Cash invested in
$810,255 $20,256 2.5%
Bank Term Deposits
The average business price is currently $810,255 and based on an EBITDA market average multiplier of 3.5x the pre-tax yield equates to 29%.
The average term deposit rate with one of New Zealand’s major banks for one year is currently 2.5% and if interest rates continue to increase this rate
is forecasted to be at 3.0% by the end of 2022.
Clearly, there is a material difference in the annual yields, with private business ownership returns being 11.6 times higher than current term deposit
rates. This analysis excludes any capital gains for business ownership. The pre-tax profit for business ownership is based on the company being fully
managed with limited input from the investor.
It needs to be acknowledged that private business ownership has a higher risk profile than investing in bank term deposits but we don’t believe
the risk premium for investing in a private business should be 11.6 times higher than term deposits. Business ownership has further upside when
compared to term deposits given the uncapped captial appreciation that can occur for this asset class (term deposits are capped at growth of 2.5%).
Based on this data we expect business values to continue growing and more investors to realise this asset class can be extremely rewarding and
lucrative.Xero Small Business Index
NZ Monthly Update February 2022
The New Zealand Small Business Index, part of Xero Small Business Insights, rose 8 points to Wage growth accelerates sharply
114.5 points in February. Upward revisions to sales and jobs data meant that January’s Index
was also revised up, to 106 points (9 points higher than the initial reading). This combination Wages rose 4.3% y/y in February, after a 3.7% y/y rise in January.
of results means overall performance has been above the long-term average for five
consecutive months. This result is below the most recent peak of 4.9% y/y in August 2021, but that result was in
part due to a weak pandemic affected result in August 2020. These ‘base effects’ have now
The rise in the Index was driven by faster wages growth, accelerating to 4.3% y/y from 3.7% eased and the results for more recent months reflect genuine growing wages pressure as
y/y in January. Strong sales growth also pushed the Index higher, up 13.3% y/y after an 11.9% competition for staff intensifies.
y/y rise in January. These gains were partially offset by a slowdown in jobs growth to a still
healthy 3.3% y/y, after a 6.0% y/y rise in January. The length of time small businesses waited All sectors recorded faster wages growth, led b construction (+5.1% y/y) and hospitality
to be paid was largely unchanged. (+5.0% y/y).
This result is a positive, early sign that small businesses have adapted to the surge in
community COVID cases that began in mid-February and continued to rise over the rest of
the month. This is in contrast to the Australian experience, where the jobs metric in particular
was heavily impacted when cases were historically high over the summer months. Looking
ahead, the challenge will be how long small businesses can continue coping in a high-case
environment where more staff are likely to be unwell than at any other time in the pandemic.
In a positive sign, cases appear to have peaked in the first week of March, although they
remain at elevated levels by New Zealand standards, and workforces are likely to continue to
have been disrupted for at least the remainder of March.
* Data taken from Xero Small Business Index New Zealand Monthly Update February 2022Sales growth powers ahead
Small business sales rose a very strong 13.3% y/y. This comes after a healthy 11.9% y/y rise
in January (revised up from +4.6% y/y). All regions recorded strong sales growth, led by
Auckland (+17.1% y/y). The smallest increase was in Otago, with a still healthy 8.9% y/y.
Construction (+16.8% y/y) and manufacturing (+15.7%) were the strongest industries in
terms of sales. The only sector to record a decline was hospitality, down 3.0% y/y. This
most likely reflects the reluctance of people to holiday or eat out while COVID case
numbers are high.
Time to be paid little
changed
Small businesses waited an average
of 23.7 days to be paid in February -
Jobs growth slows but still solid similar to the 23.8 days in January.
There was, however, a rise in late
Small business jobs grew 3.3% y/y, after a 6.0% rise in January (revised up from 4.1%
payments from 5.9 days to 7.0
y/y). This is an impressive result considering the disruption to workforces that rising
days. The lack of a similar shift in
COVID cases are causing. The result is in contrast to the experience of Australia, which
time to be paid suggests this is
saw a bigger slowdown (and even a decline) in jobs when COVID cases rose over the
likely to be temporary and due to a
summer. The strongest region for jobs growth was Otago (+5.5%). This, in part, is due
compositional shift in the sample’s
to the weak result in February 2021 when jobs rose just 0.5% y/y. Wellington (+4.8% payment terms for this month.
y/y) and Canterbury (+4.7% y/y) both recorded solid results. The jobs gains were led by
professional services (+9.2% y/y) and construction (+5.7% y/y). One of only two sectors to
record a decline in jobs during February was agriculture (-4.0% y/y). This was the fourth
consecutive decline in jobs in the sector, potentially reflecting the ongoing difficulty in
attracting staff while some international border restrictions remain in place. * Data taken from Xero Small Business Index New Zealand Monthly Update February 2022AUTHORS CHRIS SMALL Managing Director • Former Head of ASB Regional Corporate Banking • Completed over 100 M&A deals in the corporate and commercial banking market • Twenty years of experience in the banking sector 021 996 834 chriss@abcbusiness.co.nz STEVE SMITH Chief Executive Officer • Founder and CEO of ABC Business Sales • An associate of the Real Estate Institute of New Zealand 021 940 779 steves@abcbusiness.co.nz
You can also read