Market of legumes in Italy - Results of the EU-project LegValue Forschungsberichte - Fachhochschule Südwestfalen
←
→
Page content transcription
If your browser does not render page correctly, please read the page content below
Forschungsberichte
                          des
           Fachbereichs Agrarwirtschaft Soest
                         Nr. 48

   Market of legumes in Italy

        Results of the EU-project LegValue

Bruno Kezeya Sepngang

Frédéric Muel

Francesco Galioto

Fernando Pellegrini

Daniele Antichi

Marcus Mergenthaler
Project LegValue: Fostering sustainable legume-based farming systems and agri-feed and food chain
in the EU (Juni 2017 - Mai 2021). Website: http://www.legvalue.eu. This project has received funding
from the European Union´s Horizon 2020 research and innovation programme under grant
agreement No 727672.

© 2019

Forschungsschwerpunkt:
Agrarökonomie

Fachhochschule Südwestfalen
Standort Soest
Fachbereich Agrarwirtschaft
Lübecker Ring 2
59494 Soest

Tel.: 02921 / 378-3283
Fax: 02921 / 378-3200
E-Mail: agrar@fh-swf.de
www.fh-swf.de/FB/agrar

ISBN (print): 978-3-940956-83-5

ISBN (elektr): 978-3-940956-82-8

                                                                                                   1
LegValue – H2020 n°727672
Table of contents
Table of figures ........................................................................................................................................ 3
Abbreviations .......................................................................................................................................... 3
1 Introduction.......................................................................................................................................... 4
2 Data sources and methods ................................................................................................................... 4
3 Results and Discussion: Description of legume market heterogeneity................................................ 5
3.1.1 Soya beans.................................................................................................................................. 5
3.1.2 Fresh beans ................................................................................................................................ 6
3.1.3 Faba beans.................................................................................................................................. 7
3.1.4 Fresh peas................................................................................................................................... 8
3.1.5 Other dry grain legumes: Chickpeas, Dry beans and Lentils ...................................................... 9
3.1.6 Legume for whole plant harvesting: Alfalfa (Lucerne) ............................................................. 10
4 Conclusion .......................................................................................................................................... 11
References ............................................................................................................................................. 11
2LegValue – H2020 n°727672
Table of figures
Figure 1: Supply balance of soya beans in Italy from 2013 to 2018. Primary sources: Eurostat and ISTAT
(Soya beans, whether or not broken incl. seed for sowing). *: preliminary. .......................................... 6
Figure 2: Supply balance of fresh beans in Italy from 2013 to 2017. Primary sources: Eurostat and ISTAT
((Vigna spp., Phaseolus spp.) anchesgranati, freschi o refrigerati). *: preliminary. ............................... 7
Figure 3: Supply balance of faba beans in Italy from 2013 to 2018. Primary sources: Eurostat and ISTAT
(Fave (Viciafresh var. major) e favette (Viciafresh var. equina) e (Vicia fresh var. minor) secche,
sgranate, anche decorticate o spezzate). *: preliminary. ....................................................................... 8
Figure 4: Supply balance of fresh peas in Italy from 2013 to 2017. Primary sources: Eurostat and ISTAT
(Piselli (Pisumsativum), anchesgranati, freschi o refrigerati). *: preliminary. ........................................ 9
Figure 5: The main producer of lucerne in Europe (Eurostat, 2016). ................................................... 10
Abbreviations
EFAs: Ecological Focus Areas.
GM: Genetically Modified
ISMEA: Istituto di Servizi per il Mercato Agricolo Alimentare.
ISTAT: Istituto Nazionale di Statistica.
ITC: International Trade Statistic
3LegValue – H2020 n°727672
1 Introduction
Legumes account for 20-25 % of the diet in industrialized countries and 75% for those in the developing
world (MIPAAFT, 2016). In Italy, the demand of legumes has followed the negative trend over the years.
In the post-war period the annual consumption per capita of dried vegetables amounted to about 20
kg while the consumption of cereals was 105 - 115 kg and that of meat was about 15 kg. From 2010 to
2015, the annual average of consumption per capita of cereals and meat was 175 kg and 80 kg
respectively, while the consumption of dried vegetables amounted to 1.5 - 2.0 kg. According to ISTAT
(Istituto Nazionale di Statistica), the production of grain legume in Italy showed a decreasing trend
from 1960 to 2011. CSCONFAGRICOLTURA (2016) proposed three reasons for this decrease during this
period of years: the total reduction of land available for agriculture, the reduction of farmer who
cultivated legumes and the decrease in demand for legumes due to the change in eating habits.
Italy is one of the biggest producer of legumes in Europe due to its highest production of soya beans.
Even though soya bean is worldwide classified as oil crop, botanically it belongs to legume species.
Beside soya, fresh beans, faba beans and fresh peas are the main produced grain legumes in Italy. Italy
is the leader in production of fodder legumes in Europa. According to EUROSTAT, the main legume crop
for whole plant harvesting here is alfalfa (Lucerne) with almost 21 Mio. tones in 2016. While the market
of soya beans is better known and more developed, those for the other legumes remain less known.
Asymmetrical information between the actors in such niche markets is a hurdle that should not be
underestimated.
This report is part of the transdisciplinary EU research project "LegValue". Work package 3, which deals
with the market and economics of legumes, has as an important objective to increase the market
transparency of legumes. The present study describes the markets of the main growth legumes.
Unfortunately, no price quotations were identified to allow a price analysis of grain legumes in Italy.
This market information could be useful for the current and future actors in this sector. A mixed-
method approach based on quantitative and qualitative analyses was used in this study. The
parameters used for the quantitative analyses are production, domestic consumption, imports and
exports.
2 Data sources and methods
Five legumes species are deeply analysed in this report: soya beans (lat. Glycine max (L.) Merr.), fresh
beans (lat. Phaseolus vulgaris), faba beans (also known as broad and field beans, lat. Vicia faba) and
fresh peas (lat. Pisum sativum). The fifth specie is a crop for complete harvesting (fodder legume):
lucerne (lat. Medicago sativa). These crops are selected based on their high total production in Italy. A
mixed methodological investigation was undertaken in this study. To have an idea about the market
situation of other dry grain legumes, dry beans, chickpea and lentils were also analysed. Several
databases (Eurostat, ISTAT, ITC and ISMEA) were explored and used for a basic quantitative and
qualitative description of the Italy grain legume market. The investigated period was from 2013 to
2018, whereby the quantitative data for 2018 are provisional. The analysed data refers to the calendar
years and not to the crop years.
The analysed parameters are the production from Eurostat; the import and export from ISTAT and the
national consumption was calculated based on the production, imports and exports. Due to the lack
of information, the stock variation is not considered in this work.
4LegValue – H2020 n°727672
For the methodology, the collected data was first analysed and partially interpreted. Open questions
were marked directly at the appropriate place in the text and the whole report was forwarded to the
project partners (UNIBO, SSSA and UNIPI) in Italy. They answered the open questions as far as they
could. Additionally, they had the opportunity to contribute to the report through further additions.
One collector of soya has been interviewed (by Francesco Galioto, UNIBO) and the results are included
in this report.
3 Results and Discussion: Description of legume market heterogeneity
This chapter describes the recent supply balances of legumes and identifies their different market in
Italy. The main used parameters are production, import, export and national consumption. In this
study it was investigated that foreign trade of the dry harvested legumes (soya and faba bean) are
more significant than those of freshly harvested legumes (fresh beans and fresh peas).This knowledge
indicates an easy handling of transactions with dry goods while the risk of losses with fresh goods is
higher. Higher water content like in fresh harvested legumes could increase growth of mould or other
bacteria in the good.
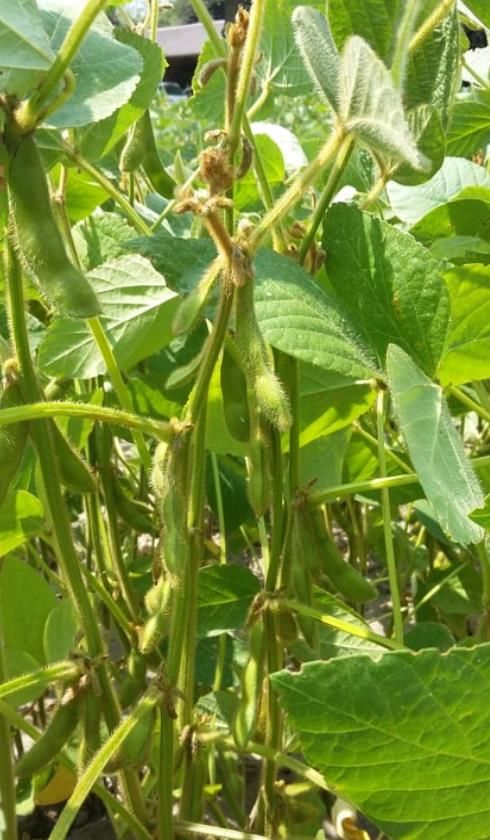
3.1.1 Soya beans
Soya bean is the most produced grain legume in Italy with a production over 1 Mio t in the last years.
Thus, Italy remains at the forefront of soya bean production in Europe, followed by France and
Romania. The geographical location of these countries, with a higher daily average temperature, gives
better conditions for growing soya. In Italy, the main production (96 %) of soya is concentrated in the
North. Soya beans are principally used for biofuel (~78 % of the oil production). It is stated that the
resulting meal after the oil extraction is then supplied by the biofuel industry to feed industry. 20 % of
the soya production ends up in the compound feed industry. Only 2 % of the production are collected
by the food industry, mainly for the production of soya milk.
Figure 1 presents the supply balance of soya beans in Italy from 2013 to 2018, whereas the data for
the year 2018 is not yet stabilized. During this period, the production shows an increasing trend. The
remarkable increase in production between 2013 and 2015 in Italy, from about 600.000 t to
1.100.000 t is mainly due to the trend in prices that increased until nowadays. Related to this reason,
the biofuel industries offer lucrative trade contracts. The second raison of this increase is the new CAP
reform, offering the possibility to cultivate legumes in Ecological Focus Areas (EFAs) and the application
of coupled payments. It is also mentioned that the production in the coming years is likely to be
reduced especially because of the recent ban on pesticide uses for the legumes cultivated in EFAs.
Despite high production of soya beans, the demand in Italy still depends on imports. On average over
the recent years, the imports remain higher than the production. Experts affirm that half of the
national consumption is imported, mainly from the USA, Argentina and Brazil. Meanwhile, statistics
from ITC and ISTAT (2017) show that the main countries from where Italy import soya are Brazil (29 %),
Canada (17 %), Paraguay (15 %), Ukraine (11 %) and USA (10 %). Differences in quality between the
imported soya and the domestic production are mainly due to the fact that the domestic production
is GM free. A lever of this characteristic is an increasing interest in the EU for promoting of the use of
non-GM Soya for feed and food.
5LegValue – H2020 n°727672
The export of Italy´s soya beans is less significant than their import and only a very small amount of
soya beans is exported. The main targeted countries here are Switzerland, Denmark and Hungary (ITC,
2017).
For some cooperatives that collect soya, around 1% of the supply is organic. This market segment is
mainly supplied to food industry (50 % of the production) for the production of soya milk and to feed
industry (50 % of the production) for the production of compoundfeed.
2500
2000
quantity (in 1000t)
1500 03 Production
04 Import
06 Export
1000
08 National consumption
500
0
2013 2014 2015 2016 2017 2018 *
Figure 1: Supply balance of soya beans in Italy from 2013 to 2018. Primary sources: Eurostat and
ISTAT (Soya beans, whether or not broken incl. seed for sowing). *: preliminary.
3.1.2 Fresh beans
Fresh beans is the second most produced grain legume in Italy. They are grown for the human
consumption. The conservation by canned is the principal used method to ensure the long life of fresh
beans in Italy (ISMEA, 2015).
Figure 2 presents the supply balance of fresh beans in Italy from 2013 to 2017. On this graph, it can be
seen that the production remains constant over this period. Despite the new CAP reform, a decrease
in the production is observed from 2014 to 2015. This shows that fresh beans are driven by other
factors than the above mentioned policy measure. Experts stated that the CAP should not have an
impact on the production of this vegetable. Compared to other dry grain legumes like soya and faba
beans, the vegetables legumes (fresh beans and fresh peas) have a totally different value chain with
other rules.
The foreign trade of fresh beans remains constant over the last recent years. According to ITC in 2017,
the imports were principally from France (60 %) with an increasing trend over the last years. The
6LegValue – H2020 n°727672
following countries for the import in 2017 were Egypt (17 %), Germany (13 %) and Spain (7 %).
Whereby the trend (from 2013 to 2017) for fresh beans from France, Germany and Spain shows an
increase and from Egypt, it has decreased. The analysis of the imported unit values of fresh beans in
these four principal countries shows a different ranking for the year 2017: France (1,625 €/t), Spain
(1,584 €/t), Egypt (1,204 €/t) and Germany (925 €/t). It is known that the unit value mostly shows a
negative correlation with the trade quantity (KEZEYA SEPNGANG ET AL., 2018). Thus, it was expected that
the imported unit value would be lowest in France. In relation with this fact, the geographical position
of the different partner countries would have an influence on the quality of the goods at destination.
This in turn may have an impact on the unit value.
The export of this good in Italy is less important than the import. However, France (23 %) and Germany
(14 %) are again the main countries where Italy export its fresh beans (ITC, 2017). The exported unit
value with Germany was 2,000 €/t and with France 1,552 €/t.
180
160
quantity (in 1000t)
140
120
03 Production
100
04 Import
80 06 Export
08 National consumption
60
40
20
0
2013 2014 2015 2016 2017 2018*
Figure 2: Supply balance of fresh beans in Italy from 2013 to 2017. Primary sources: Eurostat and
ISTAT ((Vigna spp., Phaseolus spp.) including fresh and chilled beans). *: preliminary.
3.1.3 Faba beans
Faba bean (lat.: Vicia faba) is the third most produced grain legume in Italy. Vicia faba var. major is
used for human consumption, mostly as a fresh vegetable in certain periods of the year (april-may).
Vicia faba var. minor is processed and used as an animal feed. Official statistics in Italy do not
distinguish between the two varieties (“major” and “minor”), but the dry grains for fodder (usually the
“minor” variety) is estimated by 93 % of the total production. Figure 3 presents the supply balance of
faba bean in Italy from 2013 to 2018, whereby the data for the year 2018 are not yet stabilized. The
production and national consumption show a continuous increase over the last years.
7LegValue – H2020 n°727672
Despite the increasing production, the demand remains higher than the production of faba beans in
Italy. This is a consequence of the higher imports in comparison to the exports. The imports vary from
year to year. The main origins of these imports in 2017 are Lithuania (28 %), France (25 %), UK (20 %)
and Germany (10 %). A part of these imports, surely from France, is used in feed veal (aquaculture) in
Italy. It should be noted that the UK and France were the main suppliers of faba beans in Italy from
2001 to 2011, whereby the imports from the UK were up to 150,000 t in 2003. The export market of
faba beans in Italy is not significant. A remarkable increase was seen in the years 2015 and 2016. The
main destinations of these exports were France and Slovenia.
180
160
quantity (in 1000t)
140
120
03 Production
100
04 Import
80 06 Export
08 National consumption
60
40
20
0
2013 2014 2015 2016 2017 2018*
Figure 3: Supply balance of faba beans in Italy from 2013 to 2018. Primary sources: Eurostat and
ISTAT ((Vicia fresh var. major) (Vicia fresh var. equina) and (Vicia fresh var. minor) incl. dry, shelled,
dehulled and split faba beans). *: preliminary.
3.1.4 Fresh peas
Fresh peas are the fourth most produced grain legume in Italy. Same like fresh beans, they are grown
for the human consumption. The frozen conservation is the most used method to ensure the long
shelf life of this good In Italy (ISMEA, 2015). A small amount of fresh peas is also conserved by canned.
Figure 4 presents the supply balance of fresh peas in Italy from 2013 to 2017. In this figure can be seen
that the production remains constant over this period. Despite the new CAP reform implemented in
2014 a remarkable increase in the production is observed first in 2016. This delay in comparison to the
dry legumes confirm the fact that the CAP Reform (EFA) do not have an influence on the production of
this vegetable legume (fresh peas).
The foreign trade of fresh peas remains constant over the last recent years. According to ITC in 2017,
the imports were principally from France (35 %) and Germany (27 %) both with an increasing trend
8LegValue – H2020 n°727672
over the last years. The analysis of the imported unit values of fresh peas in these two principal
countries shows a reverse ranking for the year 2017: Germany (269 €/t) and France (258 €/t). This
result matches with the knowledge that the unit value mostly shows a negative correlation with the
trade quantity (KEZEYA SEPNGANG ET AL., 2018). In comparison with the imported unit values for fresh
beans that is on average more than 1,300 €/t (see chapter 3.1.2), those for fresh peas are very low.
Consider that fresh peas are frozen after harvest, thus allowing for a longer commercial period. Fresh
beans are commercialized as fresh vegetables. This might explain the discrepancy in unit values
between these two vegetables.
The export of this good in Italy is principally destined to France, Denmark and Slovenia (ITC, 2017),
whereby the exported unit values with Denmark was 2,312 €/t followed by France (1,497 €/t). The
exported unit values for Slovenia in 2017 was only 411 €/t. But for the year before, it was more than
1,700 €/t.
100
90
80
quantity (in 1000t)
70
60 03 Production
50 04 Import
06 Export
40
08 National consumption
30
20
10
0
2013 2014 2015 2016 2017 2018 *
Figure 4: Supply balance of fresh peas in Italy from 2013 to 2017. Primary sources: Eurostat and
ISTAT ((Pisum sativum), incl. shelled, fresh and chilled peas). *: preliminary.
3.1.5 Other dry grain legumes: Chickpeas, Dry beans and Lentils
Chickpeas (lat. Cicer arietinum), dry beans (lat. Phaseolus vulgaris) and lentils (lat. Lens culinaris or Lens
esculenta) have an interesting place in the human consumption and could be used as a meat substitute.
The chickpeas show a continuous increase in production from 2010 to 2018, namely from about 9000 t
to 47,000 t (ISTAT). There is a big leap from 2016 to 2017 (22,000 t to 34,000 t) and the next from 2017
to 2018 (34,000 t to 47,000 t). The Emilia-Romagna region, with 25 % of total chickpeas production,
topped Italy in 2018. According to ITC (2019) Italy imported 35,000 t of chickpeas in 2017. The main
origins of this import are Canada (50 %) and USA (26 %).
9LegValue – H2020 n°727672
Differently to chickpeas and lentils, the production of dry beans, remains almost constant from 2010
to 2018, 13,000 t to 12,000 t. Piemonte with 31 % of the total production is the main region where dry
beans are grown in Italy. According to ITC (2019) Italy imported 114,200 t of dry beans (Phaseolus
vulgaris) in 2017. The main origins of this import are USA (26 %), Canada (22 %), China (20 %) and
Argentina (17 %).
Same like chickpeas, the production of lentils in Italy presents a continuous increase in production
from 2010 to 2018, namely from about 1700 t to 4,600 t. Actually, Toscana, Umbria and Marche are
the main regions where lentils are produced. According to ITC (2019) Italy imported 49,400 t of lentils
in 2017. The main origins of this import are Argentina (40 %) and USA (20 %).
3.1.6 Legume for whole plant harvesting: Alfalfa (Lucerne)
Italy is one of the first producer of legumes for whole plant harvesting. According to EUROSTAT (2016),
almost 27 million tons of these crops were produced in Italy. The most produced fodder legume in this
group is alfalfa, with a production of ~21 million tons in the same year. The market structure for fodder
legumes in general is very simple. The producers mostly use it themselves or the trade takes place
inter-farming-companies. The production of alfalfa in Europe in 2016 was also lead by Spain (10 Mio. t)
and Albania (4 Mio. t), (see Fig. 5). France is also interested in the production of alfalfa. In the year
2012, it was the second producer of dehydrated alfalfa after Spain. Dehydrated alfalfa are dried to
around 10 % moisture content and then crushed. Therefore the dehydrated alfalfa can also be sold to
the compound feed producer. Regarding this market segment, Italy was in the third place in 2012.
Since alfalfa prefers a higher annual average temperature, South European countries like Italy, Spain,
Albania and France would be favourable locations for their growth.
Unfortunately, there are no data about the production of lucerne in Italy for the other years. But the
evolution of the cultivated area over the years 2000 to 2016 shows a constant and slightly decreasing
evolution, namely from 815,000 ha to 681,000 ha. There is a very small amount of the production that
is trade abroad. Less than 1 % of the production was exported in 2016, principally to the UK, Tunisia
and France.
25.000
20.000
Production in 1000 t
15.000
10.000
5.000
0
Italy Turkey Spain Albania Poland Romania
Figure 5: The main producer of lucerne in Europe (Eurostat, 2016).
10LegValue – H2020 n°727672
4 Conclusion
Italy is an important country in terms of legumes production in Europe. Soya and faba beans are the
main produced dried grain legumes in Italy. Hereby, three quarters of the production of soya is for
biofuel. The production of soya in Italy is ultimately conditioned by the combination of energy policies
that through the biofuel industry incentivise for the production, the CAP measures and the agro-
climatic condition of the territory. Although Italy is the first soya producer in Europe, half of its demand
is covered by the import from America. Faba beans are mainly used for feed and a small part of its
demand in Italy is covered by the import from Lithuania, France and UK. Fresh peas and fresh beans
as fresh legumes also belong to the main produced legume in Italy with a principal use in food. Contrary
to the dried harvested grain legumes, the foreign trade of the fresh ones are not interesting in term of
the traded quantity. The high water content of fresh harvested legumes is a factor that limits the
foreign trade of this commodity. A safe way would be the canned or frozen of the goods before the
transaction abroad. Stronger exchanges of legumes between neighbouring countries of Italy is
observed. Due to its pedoclimatic conditions, Italy is the first producer of the fodder legume alfalfa in
Europe. The usual use here takes place internally (by the producer himself). There are other grain
legumes like dry beans, chickpeas and lentils that are not produced in a huge amount, but the demand
is so high so that it is mainly covers by the imports. Canada, USA, Argentina and China are the main
suppliers in this market.
References
CSCONFAGRICOLTURA (2016) Produzione e commercio de i legumi in Italia e nel Mondo. 28 aprile 2016.
INTERNATIONAL TRADE STATISTICITC: http://www.intracen.org/itc/market-info-tools/statistics-import-
product-country/.
ISTITUTO DI SERVIZI PER IL MERCATO AGRICOLO ALIMENTARE, ISMEA (2016) Legumi per L´alimentazione umana:
Aggiornata al 15/04/2016.
ISTITUTO NATIONALE DI STATISTICA, ISTAT (2019) https://www.istat.it/;
http://agri.istat.it/sag_is_pdwout/jsp/dawinci.jsp?q=plC030000010000012000&an=2006&ig=1&ct=6
11&id=18A|15A|26A.
KEZEYA SEPNGANG B., STUTE I., STAUSS W., SCHÄFER B. C., MERGENTHALER M. (2018) Möglichkeiten zur Bildung
von verwertungsorientierten Preisindikatoren für Futtererbsen und Ackerbohnen im Vergleich zur
veröffentlichten Marktpreisberichterstattung. Bül: Band 96 (3).
MINISTERO DELLE POLITICHE AGRICOLE ALIMENTARI E FORESTALI, MIPAAFT (2016) I legumi da granella.
11You can also read