Market Outlook 3Q 2018 - Landmark Wealth Management, LLC
←
→
Page content transcription
If your browser does not render page correctly, please read the page content below
?
Market Outlook
3Q 2018

Morningstar Equity and Credit Research and PitchBook
Report Released 28 June 2018

Contents
  2 Our Outlook for the Stock Market
  3 Credit Market Insights
 11 CMBS
 15 Basic Materials
 20 Communication Services
 24 Consumer Cyclical
 29 Consumer Defensive
 33 Energy
 36 Financial Services
 47 Healthcare
 50 Industrials
 55 Real Estate
 61 Technology
 64 Utilities
 67 PitchBook Venture Capital Outlook
 70 PitchBook Private Equity Outlook
Page 2 of 73                   Morningstar Market Outlook 3Q 2018 | 28 June 2018 | See Important Disclosures at the end of this report.

                                 Stock Market Outlook: Some Values to Be Found in
                                 Defensive Sectors
                                 Healthcare, breakfast, and gassing up the car are always necessary, even
                                 during downturns.

By Daniel Rohr, CFA            × The Morningstar Global Markets Index has edged up 1% year to date.
Director of Equity Research,
                               × Weighted by market capitalization, our coverage universe looks fairly valued.
North America
                               × We see proportionately more opportunities in less-cyclically sensitive sectors such as consumer
                                 defensive and healthcare.

                                 Our global equity coverage universe appears fairly valued, in aggregate. The market-cap-weighted
                                 price/fair value ratio across our coverage of roughly 1,600 stocks is 1.00. Generally speaking, we're more
                                 positive on sectors that are less sensitive to the economic cycle, which might not be too surprising given
                                 the global economy is now in its ninth consecutive year of expansion. Consumer defensive ranks among
                                 the more undervalued sectors, trading at a price/fair value of 0.94 on a cap-weighted basis.

                                 One of our top picks here is General Mills GIS, shares of which have suffered amid volume softness
                                 across the packaged food space as well as skepticism related to the acquisition of natural pet food
                                 company Blue Buffalo. We're more optimistic about the firm's ability to reinvigorate growth through
                                 reinvestment in its brands, and to integrate and grow Blue Buffalo by following the same playbook it did
                                 with Annie's, which it acquired in 2014.

                                 Healthcare, another sector that tends to hold up well when the economy heads south, trades at 0.98
                                 price/fair value. One of the names we like here is Allergan AGN. In contrast to most of its peers in
                                 specialty pharma, the firm boasts an attractive product portfolio and innovative pipeline thanks to a
                                 successful mix of internal research and M&A. At the other end of the spectrum, the basic materials,
                                 energy, and industrials sectors all trade above to our estimates of intrinsic value on a cap-weighted
                                 basis. In energy, we believe the market continues to underestimate the shale industry's capacity to
                                 throw oil markets back into oversupply. Crude prices have largely held above $65 per barrel for West
                                 Texas Intermediate, or WTI, in 2018, which provides attractive economics for many U.S. producers. But
                                 the reckoning may not happen as quickly as we previously thought amid supply disruptions. Eventually,
                                 we expect pain for oil prices as growing U.S. production serves as the primary weight to tip oil markets
                                 back into oversupply. Our midcycle forecast for WTI is still $55/bbl.

                                 Canadian midstream company Enbridge is one of our top picks in this generally overbought space. We
                                 see nearly 50% upside in the stock, as we believe the market doesn't realize the potential of the
                                 company's growth portfolio. K

                                 Daniel Rohr, CFA, does not own shares in any of the securities mentioned above.
Page 3 of 73 Morningstar Market Outlook 3Q 2018 | 28 June 2018 | See Important Disclosures at the end of this report.
Credit Market Insights: Investment Grade Struggles While
High Yield Strengthens
Most Fixed-Income Indexes Decline in Second Quarter as Rising Interest
Rates Take Their Toll
By Dave Sekera, CFA × The yield curve continues to flatten.
Managing Director, Credit Ratings
× Outflows among high-yield open-end funds overwhelm ETF inflows
× Downgrades edge out upgrades during the second quarter
Summary
Most fixed indexes continued their declines over the course of the second quarter as interest rates rose
and investment-grade corporate credit spreads widened out. However, with its shorter duration and
higher correlation to economic growth, the high-yield sector was one of the few standouts that
registered gains this quarter.
Morningstar's Core Bond Index, our broadest measure of the fixed-income universe, declined 0.42% in
the second quarter through June 25 and has fallen a total of 1.94% year to date. The decline was mainly
driven by the increase in interest rates across the entire yield curve but was also under pressure from
widening investment-grade corporate credit spreads. Underlying the Core Bond Index, Morningstar's
Short-Term Core Bond Index was able to post a small gain of 0.15% even as short-term rates rose to their
highest levels in over a decade. This gain in the second quarter helped to offset earlier losses and this
index is now down only 0.24% for the year. The Intermediate Core Bond Index declined 0.11% during the
quarter and has dropped 1.39% year to date. With its longer duration and greater price sensitivity to
interest rates, the Long-Term Core Bond Index fell by 1.63% this quarter and had registered a 4.75% loss
this year as falling bond prices from rising rates more than offset the yield carry from the underlying
bonds in this index.
In the Treasury market, the Morningstar U.S. Government Bond index fell by 0.14% and has declined
1.34% thus far this year. Similarly, the Morningstar Agency Bond Index declined 0.16% in the quarter
and 0.70% year to date. One of the bright spots this quarter was in the Treasury Inflation Protected
Securities market. As inflation measures edge up, investors looked to TIPS, which led the Morningstar
TIPS Index to a gain of 0.42%; however, that gain was not enough to offset the losses incurred in the
first quarter and the index remains in the red to the tune of 0.35% for the year.
During the second quarter, through June 25, the yield on the 2-year Treasury bond rose another 26 basis
points on top of the 38 basis points it rose in the first quarter. At its current yield of 2.53%, the 2-year is
trading at its highest yield since August 2008. The yield on the 5-year Treasury bond rose 19 basis points
to 2.75%, which rivals its highest yield since 2010. Along the long end of the curve, the yield in the 10-
year Treasury rose 14 basis points to 2.88%. The yield on the 10-year briefly broke through the
psychological ceiling at 3% but was quickly driven back down as concerns that a global trade war wouldPage 4 of 73 Morningstar Market Outlook 3Q 2018 | 28 June 2018 | See Important Disclosures at the end of this report.
emerge drove a flight to safety. At the longest end of the curve, the 30-year rose only 5 basis points to
3.02%. As short-term rates have continued to rise faster than long-term rates, the spread between the 2-
year Treasury and the 10-year Treasury has since compressed to 35 basis points, representing the
flattest the yield curve has registered since fall 2007.
In the corporate bond market, the Morningstar Corporate Bond Index (our proxy for the investment-
grade bond market) declined 1.25% this quarter as the combination of higher interest rates and wider
credit spreads pushed bond prices down. Year to date, our corporate bond index has lost 3.46%. In
contrast, in the high-yield market, the Bank of America Merrill Lynch High Yield Master Index rose 0.48%
in the second quarter as credit spreads tightened and the higher yield carry of the index more than
offset the impact of higher interest rates. Year to date, the high-yield market has risen 1.43%. Among
European fixed-income markets, the Morningstar Euro Corporate Bond Index rose 0.11% as the benefit
from the decline in underlying interest rates on benchmark German bonds offset the amount that
corporate credit spreads widened. Year to date, the European Corporate Bond Index has registered a
loss of 0.19%.
Once again, the emerging-markets fixed-income indexes were among the worst-performing fixed-income
asset classes following significant losses in the first quarter. Quarter to date, the Morningstar Emerging
Market Composite Index fell 2.60%, as the underlying Morningstar Emerging Market Sovereign Index
declined 4.03% and the Morningstar Emerging Market Corporate Index fell 1.79%. Morningstar's
Emerging Market High Yield Index dropped by 4.68%. Year to date, the composite index has fallen
4.23%, the sovereign index has dropped 5.96%, the corporate index has declined 3.24%, and the high-
yield index has plunged by 5.88%.
Exhibit 1 Fixed-Income Index Returns
Broad Market Index QTD YTD 2017 2016 2015 2014 2013 2012
Core Bond -0.42 -1.94 3.64 2.64 0.98 6.07 -1.89 4.41
Short-Term Core 0.15 -0.24 1.12 1.46 0.79 1.04 0.57 1.75
Intermediate Core -0.11 -1.39 2.63 2.22 1.96 5.56 -1.07 4.25
Long-Term Core -1.63 -4.75 8.39 5.10 -1.55 15.10 -6.88 8.32
Sector Indexes
US Gov't Bond -0.14 -1.34 2.41 0.97 0.91 5.08 -2.74 1.98
Agency -0.16 -0.70 2.10 1.67 0.72 3.01 -1.03 1.96
Corporate Bond -1.25 -3.46 6.40 5.81 -0.46 7.20 -1.50 10.54
BofAML High Yield Master II 0.48 1.43 7.48 17.49 -4.64 2.50 7.42 15.58
Eurobond Corp 0.11 -0.19 1.81 4.66 -0.59 8.35 1.94 12.67
TIPS 0.42 -0.35 3.10 4.68 -1.60 3.95 -8.53 6.93
Emerging Markets Indexes
Emerging Mkt Composite -2.60 -4.23 8.24 9.94 0.62 5.06 -4.39 16.25
Emerging Mkt Sovereign -4.03 -5.96 9.31 9.25 1.15 7.69 -3.40 13.75
Emerging Mkt Corporate -1.79 -3.24 7.85 11.30 0.08 3.47 -2.81 15.32
Emerging Mkt High Yield -4.68 -5.88 9.34 15.17 1.42 2.63 -4.99 24.07
Source: Morningstar, Inc., Bank of America Merrill Lynch Global Indexes. Data as of June 25, 2018.Page 5 of 73 Morningstar Market Outlook 3Q 2018 | 28 June 2018 | See Important Disclosures at the end of this report.
A Tale of Two Bond Markets: Investment Grade Struggles While High Yield Strengthens
It's been a tale of two cities across the corporate bond markets thus far this year. Since the end of last
quarter, through June 25, the average credit spread of the Morningstar Corporate Bond Index, our proxy
for the investment-grade bond market, widened 13 basis points to +128; however, in the high-yield
market, over the same time period, the Bank of America Merrill Lynch High Yield Master Index has
tightened 32 basis points to +347. Year to date, the investment-grade index has widened 32 basis
points, whereas the high-yield index has tightened 16 basis points.
At its current level, the average credit spread in the investment-grade market is at its widest level this
year and is at its highest level since the beginning of 2017. At that time, the corporate bond markets
were still recovering from an earlier plunge in oil prices which bottomed out in 2016. In contrast, the
average credit spread of the high-yield index is not that far off of its tightest levels since prior to the
2008−09 credit crisis. Since the beginning of 2000, the high-yield index has only ever traded below the
current level approximately 12% of the time.
Exhibit 2 Corporate Bond Credit Spreads
Morningstar Co rporate Bond Inde x
BofA ML HY Master II Ind ex (RHS)
Morningstar Co rporate Bond Inde x
Investment Grade - High Yield -
Avg Spread (Bps) Avg Spread (Bps)
240.0 900
200.0 700
+695
12/30/15
+421
160.0 12/30/16 500
+168
+363
12/30/15
12/30/17 +347
+128
120.0 +128 300
+97
12/30/16 12/31/17
80.0 100
Dec-15 Jun-16 Dec-16 Jun-17 Dec-17
Source: Morningstar, Inc., Bank of America Merrill Lynch Global Indexes. Data as of June 25, 2018.
There are several factors in play that have led to this divergence. Investment-grade credit spreads are
more susceptible to sell-offs in relation to debt-leveraged mergers and acquisitions than are high-yield
spreads. Following a recent court ruling in which the Justice Department lost its attempt to block the
proposed merger between AT&T T and Time Warner, investment-grade portfolio managers have become
increasingly concerned that the potential for mega-mergers and acquisitions that may not have passed
antitrust regulators in the past, may now be possible. For example, as soon as the Department of Justice
announcement was made, Comcast CMCSA commenced a bidding war by making a counter offer toPage 6 of 73 Morningstar Market Outlook 3Q 2018 | 28 June 2018 | See Important Disclosures at the end of this report.
acquire certain assets from Twenty-First Century Fox FOX, for which Disney DIS had made a prior offer.
Typically, mergers and acquisitions are funded with significant amounts of newly issued debt, which
heighten default risk and often lead to rating downgrades. However, more often than not, high-yield
companies are purchased by larger, investment-grade companies and the outstanding debt of those
acquired high-yield companies are upgraded to the same rating as the acquirer.
While investment-grade has struggled, the high-yield market has outperformed thus far this year as the
performance of the underlying companies in the high-yield universe are more affected by changes in
economic activity, which has been robust this quarter. Whether it has been driven by the
implementation of the tax cuts earlier this year, or some other reason, economic activity has been on a
tear recently and is much stronger than was expected at the beginning of the quarter. In its most recent
GDPNow estimate based on current economic metrics, the Federal Reserve Bank of Atlanta is projecting
that second-quarter GDP growth will be 4.7%. This rate of growth would represent the second strongest
quarterly growth rate over the past four years, surpassed only in third-quarter 2014.
Rising interest rates have also played a significant part in the divergence between the performance of
the investment-grade and high-yield markets. With their lower credit spread and longer average
duration, investment-grade bond performance is more closely correlated to movements in interest rates
than high-yield bonds. High-yield bonds typically have shorter durations and wider credit spreads, which
are more closely tied to the performance of the underlying companies. Similar to the credit spread
widening that occurred during the "taper tantrum" in mid-2013, investors are requiring additional credit
spread to compensate for the risk that interest rates rise further.
The impact to corporate credit spreads on the investment-grade market from issuers that engage in
large, debt-funded M&A can be seen in the performance of Disney and Comcast notes. As the bidding
war for the Fox assets between the two rages on, the credit spreads for those company's bonds have
widened out as investors price in a higher probability that debt leverage will increase significantly for
whichever firm emerges as the winner. With its higher credit rating, Disney's notes had been
outperforming the market earlier this year, but this month Disney's 2027 notes widened 18 basis points
and are 33 basis points wider than at the end of 2017. While the credit spread on Comcast's 2028 notes
was unchanged in June, the notes have widened 48 basis points since the end of last year. This
compares to the index which widened 8 basis points in June and 32 basis points year to date.
Among the winners and losers this quarter, those companies with a significant amount of cash that had
previously been held overseas to avoid tax payments upon repatriation, performed well as the new tax
laws took effect. Both the healthcare and technology sectors outperformed the overall investment-grade
index thus far this year as both sectors have a high percentage of issuers that fit this description. To the
downside, the media sector has far underperformed the overall market as debt-financed M&A ravages
the credit quality for many of the issuers within that sector.Page 7 of 73 Morningstar Market Outlook 3Q 2018 | 28 June 2018 | See Important Disclosures at the end of this report.
Exhibit 3 Morningstar Corporate Credit Index YTD Spread Change
0 5 10 15 20 25 30 35 40 45
Healthcare 25
Technology 25
Manufacturing 25
REITs 26
Gas Pipelines 31
TOTAL 32
Electric Utilities 32
Energy 33
Insurance 33
Finance 33
Transportation 34
Telecom 35
Bank 35
Retail 36
Consumer Products 36
Basic Industries 37
Media 42
Source: Morningstar, Inc. Data as of June 25, 2018.
Yield Curve Continues to Flatten as Rates Rise
In conjunction with the hikes in the federal funds rate, short term rates have continued their march
higher. However, the rise in long term rates has lagged the rise in short-term rates, which has led to
further flattening of the yield curve. On the shorter end of the curve, the yield on the 2-year Treasury
bond rose 26 basis points this quarter to 2.53%, rivaling the highest yield it has traded at this year and
the highest yield the 2-year has registered since mid-2008. Along the longer end of the curve, after
breaking above the 3% psychological barrier a few weeks ago, the 10-year has rallied once again and
sunk below that threshold to 2.88%. The bid for longer-term U.S. Treasuries coincided with the
increasing rhetoric surrounding global trade re-negotiations and the rising risk that new tariffs will be
imposed and the responding retaliatory tariffs will impede global economic growth. This drove the
spread between the 2-year and 10-year Treasury to 35 basis points, representing the flattest the yield
curve has been since fall 2007.Page 8 of 73 Morningstar Market Outlook 3Q 2018 | 28 June 2018 | See Important Disclosures at the end of this report.
Exhibit 4 10-Year Treasury Constant Maturity Minus 2-Year Treasury Constant Maturity
T10 minus T2 constant maturity
Percent
3.00
2.50
2.00
1.50
1.00
0.50
0.00
-0.50
Jan-07 Jul-07 Jan-08 Jul-08 Jan-09 Jul-09 Jan-10 Jul-10 Jan-11 Jul-11 Jan-12 Jul-12 Jan-13 Jul-13 Jan-14 Jul-14 Jan-15 Jul-15 Jan-16 Jul-16 Jan-17 Jul-17 Jan-18
Source: Morningstar, Inc. Data as of June 25, 2018
The yield curve has been on a multiyear flattening trend since the Fed began to raise short-term rates in
its pursuit to normalize monetary policy and this trend may not yet have fully run its course. According to
the CME FedWatch Tool, the market is pricing in additional hikes to the federal funds rate (currently
1.75%−2.00%) over the course of the year. The probability that the federal funds rate at the end of 2018
will be greater than 2.00% is 91% and the probability that the federal funds will be 2.25% or higher is
50%. At the beginning of the year those probabilities were 44% and 13%, respectively.
In the past, it has often been an indicator of a weakening economy and in many cases portended an
impending recession when the yield curve has been flattening and then inverting. This time around, this
signal may not be foreshadowing a near-term recession risk, as it is being heavily influenced by global
central bank actions and current economic activity hasn't shown any indications of slowing down. In
fact, as an indication of the current economic strength, the Atlanta Fed's GDPNow model forecast for
second-quarter 2018 real GDP growth has risen throughout the second quarter to 4.7%, which would be
a strong acceleration from the 2.3% GDP growth rate in the first quarter and would be the strongest
quarterly growth rate since the third quarter of 2014.Page 9 of 73 Morningstar Market Outlook 3Q 2018 | 28 June 2018 | See Important Disclosures at the end of this report.
Exhibit 5 GDPNow—Federal Reserve Bank of Atlanta
Source: Federal Reserve Bank of Atlanta as of June 19, 2018.
While the Fed's monetary policy actions have been directly impacting short-term rates in the U.S., rates
in other developed markets continue to be influenced by their central bank interventions. For example, at
its most recent news conference, the ECB disclosed its plans to keep its deposit rate at a negative yield
of (0.40)% through summer 2019. Furthermore, although the ECB announced that it will begin to taper
its asset purchases this fall, it will continue to purchase EUR 30 billion of debt securities per month
through September and then reduce the purchases to EUR 15 billion per month until the end of the year.
Even though the 10-year U.S. Treasury is yielding only 2.88%, that yield has been attractive to global
bond investors as the yield on Germany's 10-year bond is only 0.33% and the yield on Japan's 10-year
bond is only barely positive at 0.04%.
Supporting the Atlanta Fed's GDP forecast, the level of the National Financial Conditions Index remains
near the strongest readings it has ever registered and is currently indicating that financial conditions
remain near their loosest since October 1994. This index is published by the Federal Reserve Bank of
Chicago and measures more than 105 variables to gauge how "loose" or "tight" financial conditions are
among U.S. capital markets, as well as the traditional and shadow banking systems. These variables
include credit availability and cost, leverage, risk, interest rates, and credit spreads. Index levels above
zero indicate tighter than average conditions, whereas levels below zero represent looser-than-average
conditions.Page 10 of 73 Morningstar Market Outlook 3Q 2018 | 28 June 2018 | See Important Disclosures at the end of this report.
Exhibit 6 Chicago Fed National Financial Conditions Index
5.0
4.0
3.0
2.0
1.0
0.0
-1.0
1973 1976 1979 1982 1985 1988 1991 1994 1997 2000 2003 2006 2009 2012 2015 2018
Source: Federal Reserve Bank of Chicago. Data as of June 25, 2018.
KPage 11 of 73 Morningstar Market Outlook 3Q 2018 | 28 June 2018 | See Important Disclosures at the end of this report.
CMBS: Could Macro Speed Bumps Slow Market's Roll?
Delinquency rates remain low, but rising interest rates could put the
brakes on new issuance.
By Steve Jellinek × The CMBS delinquency rate has remained low, as liquidations and originations outnumber new problem
Vice President, CMBS Research loans. As servicers wind down their legacy (pre-2010) portfolios throughout the year, we expect the
delinquency rate to stay low.
× Retail consolidation will continue to make headlines in 2018; however, in contrast to 2017, we do not
expect a wave of regional mall defaults.
× The multifamily sector, which has been the star performer of this real estate cycle, could experience
slower growth, especially in markets that have had sharp increases in supply, but we expect secondary
markets with weaker supply growth to outperform.
Despite concerns about rising interest rates and the Federal Reserve's self-imposed downsizing of its
balance sheet, fewer maturities in need of refinancing, and signs of overbuilding in certain commercial
real estate sectors, commercial mortgage-backed securities issuance started 2018 strong, and
Morningstar Credit Ratings, LLC expects it to continue to be robust through the third quarter. By the end
of June, new issuance will total $44.30 billion, according to Trepp, LLC, a healthy increase over the
$34.45 billion issued in the first half of 2017. Issuance volume for single-asset, single-borrower CMBS
deals will remain strong in 2018, as most of the year-to-date gains came from the continuing surge of
SASB transactions. Trepp expects SASB issuance will total $18.06 billion by the end of the second
quarter, versus $11.88 billion from the same period a year ago. Some of the factors behind the market's
growing appetite are the ease of re-underwriting the collateral, better credit enhancement, and the
higher-quality assets backing the deals. Fueled primarily by heavy deal flow on trophy skyscrapers in
major metropolitan areas, office loans made up the largest portion of total issuance with $4.48 billion, or
29.1% of 2018 volume.
Exhibit 1 Issuance Volume Comparison ($ Bil)
Single-Asset Floating
Conduit Single-Borrower Rate Total
Expected Through June 2018 16.44 18.06 9.80 44.30
First Half 2017 19.57 11.88 3.00 34.45
Source: Trepp LLC
After contracting during the first quarter of 2018 spreads on new issuance CMBS bonds began to widen
during the second quarter, according to Commercial Mortgage Alert. Spreads on 10-year AAA ratedPage 12 of 73 Morningstar Market Outlook 3Q 2018 | 28 June 2018 | See Important Disclosures at the end of this report.
conduit bonds, which averaged 80 basis points over swaps for the previous 52 weeks, were at 83 basis
points over swaps as of June 6, an increase of 4 basis points from a week earlier. The widening at the
BBB- level was similar; having averaged 356 basis points over swaps for the past 52 weeks, they were
337 basis points over swaps on June 6, 12 basis points wider than a week earlier. Regardless, we don't
see a clear commercial real estate-specific catalyst that would send spreads wider.
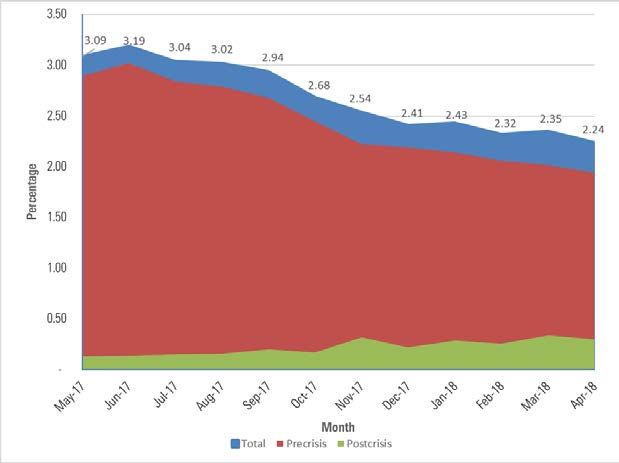
Fewer Delinquencies
Driven by the liquidation activity of specially serviced legacy loans, delinquency rates should remain low.
The delinquency rate hit a postcrisis low of 2.24% in April and is down 90 basis points from a year ago.
With steady new issuance volume pushing the outstanding balance of CMBS loans higher and special
servicers actively resolving or liquidating assets, we believe the delinquency rate will hold below 2.5%
for the rest of the year. Delinquencies from deals issued from 2010 through 2018 represent just 0.3% of
the CMBS universe, while delinquent precrisis loans account for 1.9%.
Exhibit 2 Monthly Delinquency Rate
Source: Morningstar Credit Ratings, LLC
However, driven in part by continuing retail weakness, especially in shopping centers with exposure to
troubled tenants, the volume of watchlist loans should continue its gradual upswing in the coming
month. The wave of retail bankruptcies that began in 2017 and has continued into 2018 could lead to
higher vacancy rates over the next year. In addition, consolidation in the grocery and apparel sectors
could result in further store closures, especially at Class B and C assets.Page 13 of 73 Morningstar Market Outlook 3Q 2018 | 28 June 2018 | See Important Disclosures at the end of this report.
Exhibit 3 Monthly Watchlist Volume ($)
Source: Morningstar Credit Ratings, LLC
The wave of mall defaults should subside in 2018. We have discovered that mall loans tend to default
more often at maturity, rather than during the loan term, and fewer mall loans are scheduled to mature
over the next few years. As long as cash flow remains above break-even on these assets, mall owners
have little incentive to hand properties back to their respective trusts prior to loan maturity and will
collect cash flow until then. However, as valuations on Class B and C malls adjust to lower levels of
revenue, borrowers are often unable or unwilling to invest additional capital to refinance.
Retail and Office Concerns Remain, Multifamily Secondary Markets to Outperform
Morningstar expects property fundamentals will remain stable in the coming year. While there may be
some pockets of risk, continued economic growth should buoy demand across most sectors. The
industrial sector may be the prime beneficiary, and the multifamily, hospitality, and office sectors may
slow after several years of gains and more new construction. Retail could be at higher risk, as the
industry consolidates and attempts to cope with the increased competition from online retailers.
While talk of a retail apocalypse is likely overblown, we have concerns for the sector in 2018. The wave
of bankruptcies in 2017 has increased vacancy rates. In addition, consolidation in the grocery and
apparel sectors could result in further store closures, especially at Class B and C assets. Grocery-
anchored properties could be of particular concern as Amazon AMZN, via its Whole Foods acquisition,
competes more heavily against the traditional players, and discounters, like Aldi and Lidl, expand their
presence in the United States. Lenders have traditionally held the view that grocery-anchored centers
are less risky assets, allowing for smaller risk premiums in capitalization rates and higher leverage. This
paradigm may shift as margins in the industry are further compressed and the Amazon effect could
shrink size needs over time.Page 14 of 73 Morningstar Market Outlook 3Q 2018 | 28 June 2018 | See Important Disclosures at the end of this report.
Other anchors that affect CMBS loans include Bon-Ton, which began liquidation sales in April, and Toys
'R' Us, which started closing down its U.S. operations in March. Our ongoing concerns include office
supply chains—Staples and Office Depot—Macy's M, JCPenney, Sears/Kmart, and PetSmart. Although
high-quality assets will likely have little difficulty in backfilling the spaces left vacant as these chains
shutter stores, Class B and C assets may have more persistent vacancy.
Meanwhile, we are most cautious on the office sector given a combination of the late stage corporate
credit cycle, less demand as companies become more efficient, and potential disruption from
technology, reducing space requirements. Further, new construction in the office market may weigh on
occupancy in the coming year. CBRE projected 73 million square feet in new office space in 2018, the
highest level since 2008. While economic growth should help maintain strong absorption, this likely
signals a turn in the market. Through 2021, CBRE forecasts the national vacancy rate will rise to 14.8%
from 13.0% as of 2017. The increased availability may slow rent growth, particularly in markets that are
seeing the greatest increase in supply. The four most active construction markets are New York,
Washington, D.C., San Francisco, and Seattle.
On the other hand, the multifamily sector has been a star performer in this economic cycle but may take
a breather after several years of strong growth. Apartment owners had reasons to cheer as millennials
eschewed homeownership in favor of rentals and improved multifamily fundamentals across the
country. According to the Federal Reserve Bank of St. Louis, the U.S. homeownership rate bottomed out
at 62.9% in second-quarter 2016 from about 69% before the crisis. In addition, between 2010 and 2017,
the national vacancy rate dropped to 5% from over 7% according to CBRE Econometric Advisors, while
asking rents soared. However, the average asking rent growth has since stabilized to a more sustainable
2.0% after topping out 4.6% in 2015, and CBRE projects a more moderate annual rent growth of 0.4%
over the next two years as demand in gateway markets slows. Secondary markets with weaker supply
growth and stronger growth in professional services employment are expected to outperform gateway
markets in demand growth. Among markets topping the rent growth forecast are Orlando, Florida;
Oakland, California; Colorado Springs, Colorado; and Sacramento, California, while CBRE forecasts
lower-than-average rent growth for gateway cities such as New York, San Francisco, Washington, D.C.,
and Chicago. Primary coastal markets such as Miami, San Diego, and Seattle will lag, according to
CBRE.
Guarded Optimism
Despite macro catalysts that could tap the brakes on the CMBS market, borrowers seeking to lock in low
rates should help maintain the robust volume of CMBS issuance. Meanwhile, a growing number of
yield-hungry investors tied to large projects too capital intensive to finance via other lending vehicles
will likely turn to CMBS. The lower tax rate stemming from the recently passed GOP tax legislation will
provide additional incentives to partake in acquisition and development activity, while Morningstar
expects spreads and the delinquency rate to hold steady. KPage 15 of 73 Morningstar Market Outlook 3Q 2018 | 28 June 2018 | See Important Disclosures at the end of this report.
Basic Materials: Overpriced, With Significant Downside
Ahead for Commodities
Few basic materials stocks currently offer risk-adjusted return potential
amid our negative outlook for commodity prices.
By Andrew Lane × On a market-capitalization-weighted basis, our basic materials coverage trades at a 25% premium to our
Director of Basic Materials,
estimate of intrinsic value, remaining the most overvalued sector. Our bearish perspectives on most
Equity Research
mining and metals companies are the primary drivers of this.
× Miners and industrial metals companies we cover remain substantially overvalued, reflecting our
expectation of a structural change in demand growth from China as its economy matures and makes the
transition toward less commodity-intensive and more consumption-driven growth.
× Gold is among the few mined commodities that isn't directly tied to the fortunes of Chinese fixed-asset
investment, but as the U.S. Federal Reserve continues to pursue rate increases, prices look primed to
fall. Higher inflation has buoyed gold prices but should only strengthen the central bank's resolve.
× Unfavorable weather conditions weighed on first-quarter results for many of the agriculture companies
we cover, as a delayed start to the U.S. planting season reduced sales across every crop input category.
While seed sales should bounce back in the second quarter, we expect planters to use less total
nitrogen and crop chemicals in 2018 as the late start reduces midseason application volumes. However,
stronger potash demand outside of North America should more than offset stagnant or slightly reduced
demand in North America.
× The Bayer BAYRY acquisition of Monsanto closed in June after receiving all regulatory approvals. All
major agriculture deals from companies under our coverage have now closed.
× U.S. construction activity has continued to gain momentum during the first quarter, with housing starts
following builder confidence higher. However, lumber companies look expensive following short-term
supply disruptions. We remain optimistic on long-term infrastructure spending, leading to positive
outlooks for aggregate and cement companies.
The Trump administration's imposition of steel and aluminum tariffs made waves early in 2018, driving
share prices for steel and aluminum producers sharply higher. Although we've increased our forecasts
for near-term U.S. steel prices and the U.S. Midwest aluminum premium, we maintain a negative long-
term outlook for both industries. We expect substantial global overcapacity will cause most industrial
metals companies to fall short of earning their cost of capital over the decade to come. Additionally, with
the tariff program now in place, we contend that all near-term positive catalysts have now been
exhausted and we see asymmetrical downside risk due to our outlook that both steel and aluminum
prices will decline materially in the years to come.
On the demand side, the key factors underpinning our bearish outlook are our below-consensus forecast
for Chinese fixed-asset investment and fading benefits from the Chinese stimulus. While some may look
hopefully upon India to pick up the slack, we believe India remains several years away from being the
next major driver of global metals consumption. On the supply side, we expect Chinese structuralPage 16 of 73 Morningstar Market Outlook 3Q 2018 | 28 June 2018 | See Important Disclosures at the end of this report.
overcapacity to remain in place for both steel and aluminum, as elevated metals prices have created
incentive for the addition of new supply.
With few exceptions, we still see mined commodity and miner share prices as overvalued, propped up
by the sustained Chinese stimulus. Iron ore's relative buoyancy since early 2016 is emblematic of most
industrial commodities. Recent conditions have been highly favorable for miners, particularly the bulk
miners, as exemplified by 2017 adjusted earnings for Rio Tinto RIO, which were up nearly ninefold from
2015 levels.
We do not expect this to last. With China's credit growth slowing, we still expect mined commodity
prices for products such as copper, iron ore, and alumina to fall materially and for share prices to follow.
Accordingly, the miners we cover are substantially overvalued. We expect a structural change in
demand growth from China as its economy matures and makes the transition toward less commodity-
intensive and more consumption-driven growth. High-cost miners and those with outsize exposure to
iron ore and coking coal tend to look the most overvalued.
Gold is among the few mined commodities that isn't directly tied to the fortunes of Chinese fixed-asset
investment. Despite the Fed's ongoing rate hikes and balance sheet reduction, gold investment in
exchange-traded fund holdings remains as high as it did when rates were meaningfully lower. As real
yields on U.S. Treasuries and other safe-haven asset prices rise, the opportunity cost of holding gold will
rise. Through the second quarter, however, prices have hovered around $1,300 per ounce.
On the back of weak investment demand, we forecast that gold prices will fall to $1,225 per ounce by
the end of 2018. Nevertheless, we still believe gold has a promising future, and we forecast the nominal
gold price to recover to $1,300 per ounce by 2020. We expect that in the long term, Chinese and Indian
jewelry demand will fill the gap left by waning investor demand. However, the rise of consumer demand
will take time, which points to downside risk in the near term. Although we see limited opportunities in
gold miners, we consider Goldcorp GG undervalued, as we believe execution risk surrounding its
20/20/20 growth plan is overstated. This plan aims to boost production and reserves while cutting costs
by 2021.
Strong global demand for potash should support prices throughout 2018. So far this year, reduced
supply has boosted potash prices. In potash, new delays via lower-than-expected potash production
from both Sociedad Quimica Y Minera De Chile SQM and K+S have led to a tighter market. We expect
this dynamic to continue throughout the year, and we've raised our 2018 potash price forecast to $270
per metric ton. Our long-term price forecast for potash is unchanged at $270 per metric ton.
From a valuation standpoint, potash producers are trading at a larger discount to fair value than the rest
of our ag coverage. This is primarily because of our long-term outlook that potash prices will remain flat,
in real terms, while we forecast real price declines in nitrogen and phosphate. Nutrien NTR and Mosaic
MOS currently offer the most upside based on current prices.Page 17 of 73 Morningstar Market Outlook 3Q 2018 | 28 June 2018 | See Important Disclosures at the end of this report.
The acquisition of Monsanto by Bayer closed in June after receiving all necessary regulatory approvals.
In order to gain regulatory clearance, Bayer had to divest a portfolio of agriculture assets that generated
around $2.2 billion in sales in 2017 primarily to Basf BASFY.
The seasonally slower first quarter yielded considerable catch-up building activity. Single-family
construction has gradually gained momentum, while multifamily activity has strongly rebounded in
recent months. We expect total starts to climb nearly 8% in 2018 to 1.3 million units as homebuilders
capitalize on buoyant confidence and higher prices.
Over the past year, lumber and panel prices have surged because of short-term supply disruptions.
Hurricanes in the Southeast, wildfires in the Northwest, and considerable rail congestion throughout
Canada have reduced the amount of product coming to market. This has launched prices beyond what
we believe will be sustainable for at least another two years, despite industry operating rates falling
thus far in 2018. We believe valuations for wood product companies are currently stretched, despite our
bullish long-term outlook. As these disruptions ease later in the year, we expect pricing to fall by
20%−30%.
However, our long-term outlook for housing is bright. In the wake of the Great Recession, adults in their
20s and 30s are living with family to record-setting ages. We expect them to eventually break out on
their own as they begin to form families, driving greater demand for homebuilding. A combination of
restrictive trade policies implemented by the Trump administration, an already-stretched North American
lumber market, and constrained panel capacity will lead product pricing higher in the coming decade, as
supply struggles to keep up with rising demand. This will lift cash flows for lumber companies Canfor
CFP and West Fraser Timber WFT and panel companies Norbord OSB and Louisiana-Pacific LPX.
Although U.S. nonresidential construction activity has remained strong, U.S.-focused aggregates and
concrete share prices declined by more than 10% through the end of April. Since then, shares have
started to recover and we still see some upside in the sector. We expect strong underlying demand will
continue to drive volume gains, price increases, and margin expansion. We see value in Martin Marietta
Materials MLM and U.S. Concrete USCR, as current share prices underestimate the significant profit
growth to come.
Top Picks
Cameco CCJ
Star Rating: QQQQ
Economic Moat: Narrow
Fair Value Estimate: $17
Fair Value Uncertainty: High
5-Star Price: $10.20
We think the market is mispricing narrow-moat uranium miner Cameco. Uranium offers a rare growth
opportunity in metals and mining. China's structural slowdown portends the end of a decade-long boom
for most commodities, but not for uranium. China's modest nuclear reactor fleet uses little uraniumPage 18 of 73 Morningstar Market Outlook 3Q 2018 | 28 June 2018 | See Important Disclosures at the end of this report.
today, but that's set to change in a major way. Beijing is pivoting to nuclear to reduce the country's
heavy reliance on coal.
We believe the market overemphasizes the current supply glut caused by delayed Japanese reactor
restarts, and this situation is easing with production cuts announced by Cameco and NAC
KazAtomProm. We expect global uranium demand to grow 40% by 2025, a staggering amount for a
commodity that saw near-zero demand growth in the past 10 years. Supply will struggle to keep pace.
We believe long-term uranium prices will rise from about $30 a pound in May to $65 a pound (constant
dollars) by 2021, as higher prices are required to spur new mine investment. As one of the largest and
lowest-cost producers globally with expansion potential, Cameco should benefit meaningfully from
higher uranium prices.
Compass Minerals CMP
Star Rating: QQQQ
Economic Moat: Wide
Fair Value Estimate: $83
Fair Value Uncertainty: High
5-Star Price: $49.80
Compass Minerals produces two primary products: deicing salt and sulfate of potash, a specialty
fertilizer. The company has carved out a wide economic moat based on cost advantage, thanks to its
massive rock salt mine in Goderich, Ontario, which benefits from geological and geographical
advantages. The company also sits toward the low end of the cost curve in specialty potash. While the
Goderich mine has experienced some near-term operational challenges, we ultimately expect a rebound
in Compass' profits as the mine is fully restored and the company's cost-reduction plan comes to fruition.
We see multiple near-term catalysts that should boost Compass' salt profits and drive share prices
higher. Based on our analysis of more than 120 years of weather history, winter weather exhibits mean
reversion tendencies over a multiyear period. After a couple of mild winters in Compass' important U.S.
Midwest markets, the 2017−18 winter bounced back with above average snowfall and higher salt
demand. Historically, harsher winters have led to increased deicing salt prices as local governments
need to replenish inventories. This should provide a much-needed profit boost for Compass. Further, we
think the market may be underappreciating the company's ability to control unit costs, as recent capital
improvements at Goderich are set to reduce Compass' future salt expenses on a unit production basis.Page 19 of 73 Morningstar Market Outlook 3Q 2018 | 28 June 2018 | See Important Disclosures at the end of this report.
Martin Marietta Materials MLM
Star Rating: QQQQ
Economic Moat: Narrow
Fair Value Estimate: $265
Fair Value Uncertainty: High
5-Star Price: $159
Martin Marietta's share price declined through the first few months of 2017 because of an
underwhelming Trump infrastructure plan that lacked specifics. However, we believe this created an
attractive entry point. Despite near-term challenges, the outlook for construction activity for residential,
nonresidential, and road projects remains strong. As a result, we expect Martin Marietta's EBITDA to
surge 140% by 2022, as strong demand drives higher volume and supports robust price increases.
A recovery in construction activity is still in the early stages, as U.S. aggregates consumption remains
below prerecession levels. Moreover, current demand doesn't include the backlog of projects created
from the recession and years of underspending on infrastructure. Historically, limited funding has
prevented this demand from being unleashed, but we think the money will be there because of medium-
term funding through the FAST Act and bipartisan support for infrastructure that should deliver longer-
term funding. K
Andrew Lane does not own shares in any of the securities mentioned above.Page 20 of 73 Morningstar Market Outlook 3Q 2018 | 28 June 2018 | See Important Disclosures at the end of this report.
Communication Services: Undervalued With a Case of
Merger Fever
U.S. telecom consolidation is in the works with a T-Mobile-Sprint merger.
By Brian Colello, CPA × Overall, we view the communications services sector as undervalued at a market-cap-weighted
Director of Technology, Media, and
price/fair value of 0.82.
Telecom Equity Research
× U.S. telecom consolidation is in the works with a T-Mobile-Sprint merger.
× In Europe, telecom is focused on convergence and increased build-outs of fiber and 4G.
× In telecom and cable, we continue to see migration from traditional pay-TV providers to over-the-top, or
OTT, offerings.
In the U.S., after two prior failed attempts, T-Mobile TMUS and Sprint S have reached a long-anticipated
agreement to merge the two firms, with T-Mobile retaining its brand and management team as part of
the planned merger. The deal will likely face hefty regulatory scrutiny, as it shrinks the number of
nationwide wireless telecom providers from four to three. Yet both T-Mobile and Sprint are behind the
industry leaders, AT&T T and Verizon VZ, and a deal would be a panacea for Sprint in particular as the
business strives to keep pace. We currently believe the deal has a 50/50 chance of passing through the
current regulatory environment, as the loss of a fourth player may lead to higher wireless data prices for
consumers in the United States. T-Mobile and Sprint touted the number of U.S. jobs that would be
added by a merger, perhaps in an attempt to pre-emptively alleviate any regulatory concerns, yet job
additions would likely reduce the combined firm's ability to extract cost savings, and we're not yet
convinced that the comments made by both T-Mobile and Sprint will be enough to sway regulators. We
don't expect a regulatory decision on this deal until 2019, but it would obviously shift the U.S. telecom
landscape if consummated.
Elsewhere in telecom-related mergers and acquisitions, we have seen competing bids from Twenty-First
Century Fox FOXA and Comcast CMCSA in attempts to acquire U.K. satellite TV provider Sky SKY.
Although we were previously skeptical of a bidding war between the two firms for Sky, recent regulatory
announcements suggest that Fox's prior advantages when it comes to buying Sky (such as being the
first bidder and already owning 39% of Sky shares) have been essentially nullified. Complicating the
matters further is Walt Disney's DIS bid to acquire assets from Fox, although the U.K. recently
announced that if Fox were to gather enough support from shareholders to buy Sky, and Fox were then
able to sell Sky News to Disney, the Fox-Sky merger might be more likely to receive regulatory approval.
Nonetheless, we note that the latest price to acquire Sky is at our stand-alone fair value estimate for
Sky, so any higher bids from here may result in a "winner's curse" for either Fox or Comcast.
In Europe, the main telecom themes still remain the move to convergence, along with increased build-
outs of fiber and 4G. Spain has long been the leader in convergence, with around 80% of broadband
customers subscribing to a wireless service from the same company. France has also been pushing
convergence but isn't as far along. Germany was slower at pushing convergence but is pushing itPage 21 of 73 Morningstar Market Outlook 3Q 2018 | 28 June 2018 | See Important Disclosures at the end of this report.
increasingly. Now even the U.K. and Italy, which have been big laggards, are starting to offer converged
services. The movement toward convergence is enhanced by the faster broadband speeds being offered
by fiber. Historically, cable-TV operators have enjoyed an advantage with broadband speeds, owing to
networks that were designed for video and include more fiber and coax rather than copper. However, in
order to better compete, telecom operators are increasingly laying fiber that provides equivalent speeds
to the cable operators. Europe has been much slower at moving to 4G than the U.S. or Asia, but 4G has
really taken off in the past year. However, penetration rates are still behind the U.S. and parts of Asia.
Thus, we expect the transition to 4G to continue as operators extend their 4G networks further. While
the transition to 4G continues in Europe, the U.S., Japan, and South Korea are preparing for the jump to
5G. Several companies in these countries have discussed initial offerings by the end of this year.
For pay-TV distributors, we continue to see migration from traditional providers, such as Comcast and
Dish DISH, to the newer OTT providers, such as Sling TV, DirecTV Now, and YouTube TV. We believe that
the more concentrated bundle and the lower price point will continue to attract cord-shavers and
possibly even some cord-cutters. The major OTT providers now have over 4.5 million subscribers in the
U.S., and we project that this number will continue to increase. For traditional video providers with a
broadband offering, we expect these providers like Comcast to shift margin from the video piece of the
bundle to the broadband side. While Dish is benefiting from this transition because of its Sling TV
product, the margins on OTT pay TV are considerably lower and the firm lacks a competitive broadband
offering. Among media companies, wide-moat firms such as Disney and Fox have placed their most
important channels across all major OTT TV platforms, while smaller firms like Discovery DISCA and
Viacom VIAB have struggled to gain carriage. We believe that these smaller firms will remain locked out,
particularly if the new OTT platforms continue to add new subscribers.
Top Picks
Telefonica TEF
Star Rating: QQQQQ
Economic Moat: Narrow
Fair Value Estimate: $15
Fair Value Uncertainty: High
5-Star Price: $9
Telefonica is leading the European communications market into converged services. Additionally, it is
laying extensive amounts of fiber to better compete with cable operators in providing fixed broadband
services. It acquired E-Plus in Germany and GVT in Brazil, which strengthens its position in both
countries and provides lots of opportunities for cost savings. We don't believe the market appreciates
how well the firm is positioned and its margin expansion opportunities, which has caused its stock to
trade at a wide discount to our fair value estimate.Page 22 of 73 Morningstar Market Outlook 3Q 2018 | 28 June 2018 | See Important Disclosures at the end of this report.
BT Group BT
Star Rating: QQQQQ
Economic Moat: Narrow
Fair Value Estimate: $24
Fair Value Uncertainty: High
5-Star Price: $14.40
While narrow-moat BT Group has had some issues in the past two years that caused its stock to decline,
we believe the sell-off is overdone. BT is the incumbent telecom operator in the United Kingdom. In
2016, it acquired EE, the largest wireless telecom operator in the country. The company now has the
largest fixed-line telephone, broadband, and wireless telephone subscriber bases in the country.
Additionally, it is the only operator in the U.K. that owns both a retail fixed-line and wireless network.
We believe this provides BT with an advantage in selling a converged package of these services plus pay
TV. The company has been slow to market its converged services, but now that it has reached an
agreement with telecom regulator Ofcom regarding Openreach, its U.K. business that owns its fixed-line
network and wholesales access to it to other operators, we expect a more aggressive marketing push
into converged services during calendar 2018.
BT has been hurt by the widening underfunding of its pension plan as interest rates have declined in the
U.K. We think interest rates have bottomed and they are more likely to increase from here. We believe
the benefit on the pension will be greater than the hit on higher interest on its bonds, the reverse of
what happened as interest rates declined. We also think the company has dealt with its problems in
Italy and will be able to improve its revenue in its global services division. The market appears to believe
the problems BT has seen will continue and potentially get worse, whereas we believe business can
improve over the next few years. In the meantime, the stock yields 6.3% and the company has increased
its dividend for each of the past seven years. Additionally, as it is a U.K.-domiciled company, there is no
foreign tax withholding on the dividend.
Comcast CMCSA
Star Rating: QQQQ
Economic Moat: Wide
Fair Value Estimate: $42
Fair Value Uncertainty: Medium
5-Star Price: $29.40
Like its traditional pay-TV distributor peers, Comcast has suffered from the growth in cord-nevers and
cord-shavers, particularly as OTT offerings like Sling TV, DirecTV Now, and YouTube TV gain traction.
This ongoing deterioration in pay-TV economics has negatively affected the share price of Comcast and
its peers. However, the combination of the hostile bid for Sky and the potential bid for the Fox assets has
had a larger impact, as shares are down over 18% since the Feb. 27 announcement of the Sky offer. We
believe that a shift in focus toward M&A from returning capital to shareholders has spooked some
investors. While management appears ready to ramp up leverage at the firm to acquire both of itsPage 23 of 73 Morningstar Market Outlook 3Q 2018 | 28 June 2018 | See Important Disclosures at the end of this report.
targets, we currently project that the original bidders (Fox/Disney in the case of Sky, and Disney for the
Fox assets) will prevail over Comcast.
After the M&A headlines disappear, we believe Comcast is the best-positioned U.S. communications
firm. Irrespective of the challenges faced by traditional pay TV, broadband demand continues to
accelerate. We believe Comcast is better situated to benefit from this trend, owing to its faster Internet
speeds, than many of its telco peers. The current regulatory environment is favorable because of the
reversal of Title II and net-neutrality rules. With the threat of pricing regulation diminished, Comcast can
potentially offset deteriorating pay-TV economics with higher broadband prices. K
Brian Colello, CPA does not own shares in any of the securities mentioned above.Page 24 of 73 Morningstar Market Outlook 3Q 2018 | 28 June 2018 | See Important Disclosures at the end of this report.
Consumer Cyclical: The Themes Driving Retail's Rebound
Amazon continues to linger as a disruptive threat, but the market is
coming around to those retailers offering specialization, convenience, and
experience.
By R.J. Hottovy, CFA × Consumer cyclical sector valuations remain slightly elevated with a weighted average price/fair value
Senior Equity Analyst
ratio of 1.05, edging higher from last quarter's 1.04. We attribute this to healthy consumer sentiment,
low unemployment rates, and stable asset market valuations.
× We've long held the belief that those physical retailers that offer a combination of specialization,
convenience, and experience were best positioned to compete in an Amazon world. While concerns
about potential disruption from Amazon linger, we've seen a rebound among several traditional retailers
that have embraced these qualities in 2018.
× We continue to have a favorable view of the specialized auto part retail industry's trajectory. Although
growth in miles driven has slowed and fuel prices are rising, we believe that low unemployment and
fleet characteristics should propel industry results.
× Retailers that have shown a willingness to invest in convenience and in-store experience—Williams-
Sonoma and Nordstrom come to mind—continue to outperform peers across multiple channels.
The market continues to favor consumer cyclical names, with the group continuing to trade at a
weighted average price/fair value of 1.05 (roughly in line with the 1.04 ration the group traded at last
quarter). We continue to attribute the bullish market sentiment on a number of factors, including healthy
consumer sentiment in the U.S. and many other developed nations, low unemployment rates and wage
rate increases that are helping to drive middle class consumption globally, and equity and housing
market conditions that have been conducive to wealth effect spending.
However, we believe market valuations also reflect the fact that consumer cyclical companies are
starting to reap the benefits of recent omnichannel investments. We've long held the belief that those
physical retailers that offer a combination of specialization, convenience, and experience were best
positioned to compete in an Amazon AMZN world. While it's not easy for a retailer to successfully blend
each of these qualities, we still believe those players that can combine a specialized product assortment
(including retailers that offer unique, often hard-to-ship products and in-store personnel that would be
hard to replicate); an integrated, convenient approach to ordering, fulfillment, and logistics across all
channels (in-store, mobile, and online); and experiential retail environments are the best positioned to at
least keep Amazon at bay, at least over the immediate future. For this reason, we believe the market had
previously overreacted on several names across the retail sector, and not giving credit to those operators
who understand how the retail space continues to evolve and will use the potential of competing with
Amazon as a way to evolve their businesses. However, we're seeing a rebound in many of the names
that have embraced specialization, convenience, and experience.
We believe the auto parts category is a perfect example of how specialized retailers can stay ahead of
Amazon. Retailers like Advance Auto Parts AAP have prioritized improving part availability and serviceYou can also read