GLOBAL WETLAND OUTLOOK - human flourishing - Ramsar
←
→
Page content transcription
If your browser does not render page correctly, please read the page content below
GLOBAL
                      WETLAND
              cover
              natural OUTLOOK
                    pic to show
                      wetland with
              human flourishing
                   State of the world’s
                   wetlands and their
                   services to people 2018

Convention
on Wetlands
© Ramsar Convention Secretariat 2018                       Project coordination, support and production assistance
                                                           provided by the Secretariat of the Ramsar Convention on
Citation: Ramsar Convention on Wetlands. (2018).
                                                           Wetlands under the leadership of the Secretary General,
Global Wetland Outlook: State of the World’s Wetlands
                                                           Martha Rojas Urrego.
and their Services to People. Gland, Switzerland: Ramsar
Convention Secretariat.                                    Disclaimer: The views expressed in this information product
                                                           are those of the authors or contributors and do not necessarily
Coordinating Lead Authors: Royal C. Gardner and
                                                           reflect the views or policies of the Ramsar Convention and do
C. Max Finlayson
                                                           not imply the expression of any opinion whatsoever on the
Section 1: Lead Authors: Royal C. Gardner and C. Max       part of the Convention on Wetlands (the Ramsar Convention)
Finlayson                                                  concerning the legal or development status of any country,
Section 2: Lead Authors: C. Max Finlayson, Nick            territory, city or area or of its authorities, or concerning the
Davidson, Siobhan Fennessy, David Coates, and Royal C.     delimitation of its frontiers or boundaries.
Gardner. Contributing Authors: Will Darwall, Michael       Acknowledgements: The authors would like to express
Dema, Mark Everard, Louise McRae, Christian Perennou       sincere thanks to the many wetland experts who contributed
and David Stroud                                           to the Global Wetland Outlook, including the participants
Section 3: Lead Author: Anne van Damm. Contributing        in a writing workshop held on the margins of INTECOL in
Authors: Channa Bambaradeniya, Peter Davies, Wei-          Changshu, China, in September 2016; the participants in the
Ta Fang, Vincent Hilomen, Kassim Kulindwa, Laura           20th and 21st meetings of the Ramsar Scientific and Technical
Martinez, Christian Perennou, Luisa Ricaurte, Michael      Review Panel (STRP) held in Gland, Switzerland, in February
Scoullos, Sanjiv de Silva, and Gert Michael Steiner        2017 and January 2018; STRP National Focal Points who
                                                           reviewed and provided comments on the first order draft;
Section 4: Lead Authors: Royal C. Gardner, Chris
                                                           and six anonymous reviewers with a wide range of wetland
Baker, Nick Davidson, Ritesh Kumar and David Stroud.
                                                           experience and regional diversity who provided comments on
Contributing Authors: Stefano Barchiesi, C. Max
                                                           the second order draft. The authors are also deeply grateful
Finlayson, Erin Okuno, Christian Perennou
                                                           for the support of the Ramsar Secretariat led by Martha Rojas
Editor: Nigel Dudley                                       Urrego and especially for the outstanding contributions of the
                                                           editor, Nigel Dudley.
Design and layout: Miller Design
Front cover photograph:
San Miguel National Park, Uruguay © Charlie Waite
Paper: Cocoon Silk 100% Recycled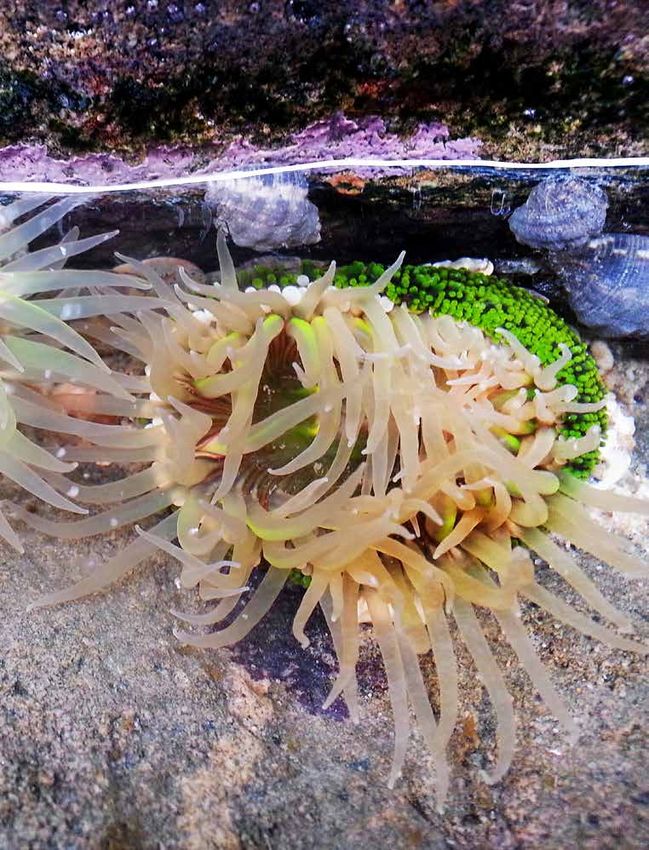
CONTENTS
EXECUTIVE SUMMARY                              3     3.DRIVERS OF CHANGE                              44
                                                      Drivers in wetlands can be direct or indirect      45
1.INTRODUCTION                                 10    Direct drivers include physical regime change      46
                                                      Extraction from wetlands includes removal
Wetlands are globally important for
                                                      of water, species and soil                         47
sustainable development                         11
                                                      Pollutants and alien species degrade
The Ramsar Convention’s role                   12
                                                      many wetlands                                     48
The Ramsar Convention works nationally
                                                      Direct drivers also include structural
and internationally                            13
                                                      changes to habitat                                 49
Wetlands in global policy and targets          14
                                                      Direct drivers of wetland change                  50
Wetlands in international agreements           15
                                                      Indirect drivers influence wetlands through
                                                      their effects on direct drivers                    51
2.STATUS AND TRENDS                            16    Global megatrends impact both direct and
                                                      indirect drivers of change                         53
Ramsar tracks global status and trends                Assessing the drivers of wetland
in wetlands                                    17    degradation and loss                               55
Accuracy of global wetland area data is
increasing18
Natural wetlands have declined and artificial         4.RESPONSES56
wetlands increased                             19
                                                      Responding to multiple challenges                  57
Wetland change in Europe illustrates
                                                      Enhance the network of Ramsar Sites                58
global trends                                  20
                                                      Enhance wetland coverage in conservation
Area of natural inland wetland is changing
                                                      areas59
and generally declining                        21
                                                      Integrate wetlands into planning and
Area of natural coastal/marine wetland
                                                      implementation of post-2015 development agenda 60
types is also declining over time              23
                                                      Ramsar has a key role in supporting the
Human-made wetland types have
                                                      Sustainable Development Goals                      61
increased in area                              24
                                                      Strengthen legal and policy arrangements
Populations of many wetland-dependent
                                                      to safeguard wetlands                              62
species are declining                          25
                                                      Aim for no net loss                                63
Regional trends of wetland-dependent
species show highest risks in the tropics      26    Implement Ramsar Guidance to achieve
                                                      wise use                                           64
Trends in wetland-dependent species            27
                                                      Use Ramsar mechanisms to identify
Status of wetland-dependent species —
                                                      and address challenges                             66
taxonomic groups                               28
                                                      Apply economic and financial incentives            67
Water quality trends are mainly negative       31
                                                      Maintain and increase government investment
A wide range of pollutants are impacting
                                                      in wetland restoration                            68
water quality                                  32
                                                      Promote sustainable production and
Wetlands maintain the global water cycle —
                                                      consumption practices                              69
hydrological processes                         34
                                                      Incorporate wise use and public participation
Complex biogeochemical processes maintain
                                                      into wider-scale development planning              70
functional wetland ecosystems                  35
                                                      Integrate diverse perspectives into wetland
Wetlands are the world’s largest carbon
                                                      management71
stores, but also release methane               36
                                                      Update and improve national wetland
Wetlands are one of the most biologically
                                                      inventories to support wise use                    72
productive ecosystems                          37
                                                      Make best use of citizen science                   73
Wetlands play a critical role in providing
ecosystem services                             38
Types of ecosystem services provided                  5.CONCLUSIONS74
by wetlands                                    40
Wetland ecosystem services exceed terrestrial         Into the future                                    75
services in value                              42
                                                      6.REFERENCES76

                                                                         Ramsar | Global Wetland Outlook | 2018   1
PREFACE
                      We all interact with and depend on wetlands for our
                      livelihoods, sustenance and well-being.
                                                  Wetlands, such as         In the context of climate change, increasing
                                                  lakes, rivers, swamps,    water demands and increased risks of floods
                                                  marshes, peatlands,       and droughts, wetlands are more critical than
                                                  mangroves and coral       ever to achieve sustainable development. In fact,
                                                  reefs provide essential   wetlands contribute directly or indirectly to 75
                                                  ecosystem services        Sustainable Development Goal (SDG) indicators.
                                                  and contributions to      Of critical importance is the Convention’s
                                                  people’s livelihoods.     leadership role in reporting on wetland extent
                                                  Wetlands act as a         as a co-custodian with the United Nations
                                                  source and purifier of    Environment Programme of SDG indicator
                                                  water, they protect us    6.6.1. The Convention provides a platform like
                                                  from floods, droughts     no other to foster collaboration and partnership
                       and other disasters, they provide food and           to achieve other international policy objectives
                       livelihoods to millions of people, they support      including the Aichi Biodiversity Targets, the
                       rich biodiversity, and they store more carbon        Paris Agreement on Climate Change and the
                       than any other ecosystem. Yet, the value of          Sendai Framework on Disaster Risk Reduction
                       wetlands remains largely unrecognized by policy      to promote co-benefits and scale up the needed
                       and decision-makers. The result is that 35% of       action to conserve and wisely use wetlands.
                       wetlands, where data is available, have been lost
                       since 1970, at a rate three times greater than       These ambitious plans assume that we have a
                       that of forests.                                     baseline against which to measure successes and
                                                                            failures in wetland management. The Global
                       This is not good news. The loss of wetlands          Wetland Outlook provides a snapshot of wetland
                       continues today, with direct and measurable          status, trends and pressures, along with an
                       negative impacts on nature and people. The           overview of ways in which countries are working
                       purpose of the Global Wetland Outlook is to          to reverse the historical decline in wetland area
                       increase understanding of the value of wetlands      and quality. I am pleased to introduce this first
                       and provide recommendations to ensure that           edition and hope that you find it both useful
                       wetlands are conserved, wisely used and their        and stimulating, and that it will empower you to
                       benefits recognized and valued by all.               take action in implementing the recommended
                       The Ramsar Convention plays a unique role            responses.
                       in championing this change. As the only
                       international treaty focused on wetlands, it         Martha Rojas Urrego, Secretary General
                       provides a platform of 170 Contracting Parties
                       working together for wetland conservation and
                       wise use, and to develop the best available data,
                       advice and policy recommendations to realize
                       the benefits of fully functional wetlands to
                       nature and society.

2   Ramsar | Global Wetland Outlook | 2018
KEY MESSAGES

• Healthy, functioning natural wetlands are critical to
  human livelihoods and sustainable development.
• Although still covering a global area almost as large as
  Greenland, wetlands are declining fast, with 35% losses
  since 1970, where data are available.
• Wetland plants and animals are therefore in crisis, with
  a quarter of species at risk of extinction.
• Quality of remaining wetlands is also suffering, due to
  drainage, pollution, invasive species, unsustainable use,
  disrupted flow regimes and climate change.
• Yet wetland ecosystem services, ranging from food
  security to climate change mitigation, are enormous,
  far outweighing those of terrestrial ecosystems.
• The Ramsar Convention promotes wetland conservation
  and wise use and is at the centre of efforts to halt and
  reverse wetland loss.
• Key steps in conserving and regaining healthy wetlands
  include:
    • enhancing the network of Ramsar Sites and other
      wetland protected areas
    • integrating wetlands into planning and the
      implementation of the post-2015 development agenda
    • strengthening legal and policy arrangements to
      conserve all wetlands
    • implementing Ramsar guidance to achieve wise use
    • applying economic and financial incentives for
      communities and businesses
    • ensuring participation of all stakeholders in wetland
      management
    • improving national wetland inventories and tracking
      wetland extent.

                                            Ramsar | Global Wetland Outlook | 2018   3
EXECUTIVE SUMMARY
                               Conservation and wise use of wetlands are vital for
                               human livelihoods. The wide range of ecosystem
                               services wetlands provide means that they lie at the
                               heart of sustainable development. Yet policy and
                               decision-makers often underestimate the value of
                               their benefits to nature and humankind.

                               Understanding these values and what is happening
                               to wetlands is critical to ensuring their conservation
                               and wise use. The Global Wetland Outlook
                               summarizes wetland extent, trends, drivers of
                               change and the steps needed to maintain or restore
                               their ecological character.
© Ramsar Convention

4                     Ramsar | Global Wetland Outlook | 2018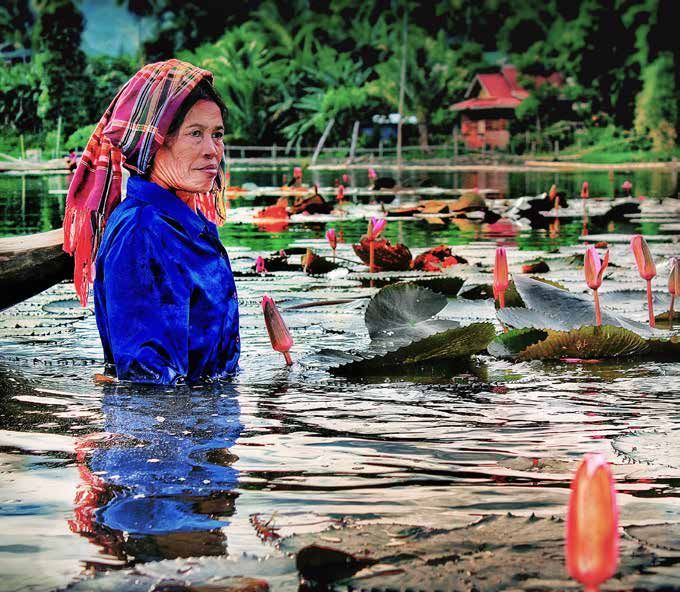
EXECUTIVE
Status         SUMMARY
       and Trends

Extent                                               third of the global population will likely be
Accuracy of global wetland area data is              exposed to water with excessive nitrogen and
increasing. Global inland and coastal wetlands       phosphorous, leading to rapid algal growth and
cover over 12.1 million km2, an area almost          decay that can kill fish and other species. Severe
as large as Greenland, with 54% permanently          pathogen pollution affects one-third of rivers
inundated and 46% seasonally inundated.              in Latin America, Africa and Asia, with faecal
However, natural wetlands are in long-term           coliform bacteria increasing over the last two
decline around the world; between 1970 and           decades. Salinity has built up in many wetlands,
2015, inland and marine/coastal wetlands both        including in groundwater, damaging agriculture.
declined by approximately 35%, where data are        Nitrogen oxides from fossil fuels and ammonia
available, three times the rate of forest loss. In   from agriculture cause acid deposition. Acid
contrast, human-made wetlands, largely rice          mine drainage is a major pollutant. Thermal
paddy and reservoirs, almost doubled over this       pollution from power plants and industry
period, now forming 12% of wetlands. These           decreases oxygen, alters food chains and
increases have not compensated for natural           reduces biodiversity. At least 5.25 trillion
wetland loss.                                        persistent plastic particles are afloat in the
                                                     world’s oceans and have huge impacts in coastal
Biodiversity                                         waters. In nearly half OECD countries, water
Overall available data suggest that wetland-         in agricultural areas contains pesticides above
dependent species such as fish, waterbirds and       national recommended limits. These impacts
turtles are in serious decline, with one-quarter     harm our health, undermine ecosystem services
threatened with extinction particularly in the       and further damage biodiversity.
tropics. Since 1970, 81% of inland wetland
species populations and 36% of coastal and           Ecosystem processes
marine species have declined.                        Wetlands are one of the most biologically
                                                     productive ecosystems. They play a major role
Global threat levels are high (over 10% of           in the water cycle by receiving, storing and
species globally threatened) for almost all          releasing water, regulating flows and supporting
inland and coastal wetland-dependent taxa            life. River channels, floodplains and connected
assessed. Highest levels of extinction threat        wetlands play significant roles in hydrology, but
(over 30% of species globally threatened) are for    many “geographically isolated” wetlands are
marine turtles, wetland-dependent megafauna,         also important. However, land use change and
freshwater reptiles, amphibians, non-marine          water regulation infrastructure have reduced
molluscs, corals, crabs and crayfish. Extinction     connectivity in many river systems and with
risk appears to be increasing. Although              floodplain wetlands. Wetlands regulate nutrient
waterbird species have a relatively low global       and trace metal cycles and can filter these and
threat level, most populations are in long-term      other pollutants. They store the majority of
decline. Only coral reef-dependent parrotfish        global soil carbon, but in the future climate
and surgeonfish, and dragonflies have a low          change may cause them to become carbon
threat status.                                       sources, particularly in permafrost regions.

Water quality                                        Ecosystem services
Water quality trends are mostly negative. Since      Wetland ecosystem services far exceed those
the 1990s, water pollution has worsened in           of terrestrial ecosystems. They provide critical
almost all rivers in Latin America, Africa and       food supplies including rice and freshwater
Asia. Deterioration is projected to escalate.        and coastal fish, and fresh water, fibre and
                                                     fuel. Regulating services influence climate and
Major threats include untreated wastewater,          hydrological regimes, and reduce both pollution
industrial waste, agricultural runoff, erosion       and disaster risk. Natural features of wetlands
and changes in sediment. By 2050, one-               often have cultural and spiritual importance.

                                                                  Ramsar | Global Wetland Outlook | 2018   5
Drivers

                      Wetlands offer recreational possibilities and     Wise use of wetlands requires a thorough
                      tourism benefits. While some global data on       understanding of the drivers of change so that
                      ecosystem services are available, more targeted   the root causes of wetland loss and degradation
                      information is urgently required for national     can be addressed. Wetlands continue to be lost
                      and local decision-makers.                        and degraded through drainage and conversion,
                                                                        introduction of pollution and invasive species,
                      Storage and sequestration of carbon by            extraction activities, and other actions affecting
                      wetlands play an important role in regulating     the water quantity and frequency of flooding
                      the global climate. Peatlands and vegetated       and drying.
                      coastal wetlands are large carbon sinks. Salt
                      marshes sequester millions of tonnes of carbon    These immediate drivers are in turn affected
                      annually. Despite occupying only 3% of the land   by indirect drivers, relating to supply of
                      surface, peatlands store twice as much carbon     energy, food, fibre, infrastructure, tourism
                      as the world’s forests. However, freshwater       and recreation. Climate change is a direct
                      wetlands are also the largest natural source of   and indirect driver of change. Therefore,
                      methane, a greenhouse gas, especially when not    adaptation and mitigation measures can have
                      well managed. Tropical reservoirs also release    multiplier effects in addressing other drivers
                      methane, sometimes offsetting the reported        of wetland change. Global megatrends are also
                      low-carbon benefits of hydropower.                important, including demography, globalization,
                                                                        consumption and urbanization, with climate
                                                                        change creating uncertainty at every level.

6   Ramsar | Global Wetland Outlook | 2018
The Ramsar Convention

The purpose of the Ramsar Convention is to         The Ramsar Convention is uniquely positioned
promote wetland conservation and wise use.         to reverse the loss of global wetlands. As
This ensures that the benefits of wetlands         the only international treaty focused on
contribute towards meeting the UN Sustainable      wetlands, it provides a platform to deliver
Development Goals (SDGs), Aichi Biodiversity       many global wetland-related targets. In fact,
Targets, Paris Agreement on Climate Change,        wetlands contribute directly or indirectly to
and other related international commitments.       75 SDG indicators. Of critical importance is
The fourth Ramsar Strategic Plan guides            the Convention’s role in reporting on wetland
the work of the Convention in addressing the       extent drawing on information from national
drivers of loss, fostering wise use of wetlands,   reports as a co-custodian with UN Environment
enhancing implementation of the Convention         of SDG indicator 6.6.1. The Convention
and effectively conserving and managing the        provides a platform like no other to foster
Ramsar Site network. Parties to the Convention     collaboration and partnership in support of
have already committed to maintaining the          other international policy mechanisms through
ecological character of over 2,300 Wetlands of     providing the best available data, advice and
International Importance covering nearly 250       policy recommendations to enable national
million hectares, 13-18% of global wetlands.       governments to realize the benefits of fully
                                                   functional wetlands to nature and society.

                                                                                                   © Gabriel Mejia

                                                               Ramsar | Global Wetland Outlook | 2018                7
© Vicente Weippert

                     8   Ramsar | Global Wetland Outlook | 2018
Responses
Urgent action is needed at the international and national level to
raise awareness of the benefits of wetlands, put in place greater
safeguards for their survival and ensure their inclusion in national
development plans. In particular:
• Enhance the network of Ramsar Sites • Apply economic and financial
and other wetland protected areas: incentives for communities and
designation of over 2,300 internationally businesses: funding for wetland
important wetlands as Ramsar Sites is conservation is available through multiple
encouraging. However, designation is mechanisms, including climate change
not enough. Management plans must be response strategies and payment for
developed and implemented to ensure their ecosystem services schemes. Eliminating
effectiveness. Less than half Ramsar Sites perverse incentives has positive benefits.
have done this as yet. Businesses can be helped to conserve
wetlands through tax, certification and
• Integrate wetlands into planning and corporate social responsibility programmes.
the implementation of the post-2015 Government investment is also critically
development agenda: include wetlands in important.
wider scale development planning and action
including the Sustainable Development • Integrate diverse perspectives into
Goals, the Paris Agreement on Climate wetland management: multiple wetland
Change and the Sendai Framework on values must be taken into account. To ensure
Disaster Risk Reduction. sound decision-making, stakeholders need an
understanding of wetland ecosystem services
• Strengthen legal and policy and their importance for livelihoods and
arrangements to protect all wetlands: human well-being.
wetland laws and policies should apply cross-
sectorally at every level. National Wetland • Improve national wetland inventories
Policies are needed by all countries. An and track wetland extent: knowledge
important tool here is the avoid–mitigate– supports innovative approaches to wetland
compensate sequence recommended by conservation and wise use. Examples include
Ramsar and reflected in many national laws. remote sensing and field assessments,
It is easier to avoid wetland impacts than to citizen science and incorporating indigenous
restore wetlands. and local knowledge. Identification and
measurement of indicators of wetland
• Implement Ramsar guidance to benefits and drivers of change are key to
achieve wise use: Ramsar has a wide supporting wise use policy and adaptive
range of relevant guidance. Ramsar management.
mechanisms – such as reports on changes
in ecological character, the Montreux
Record of Ramsar Sites at risk and Ramsar A broad range of effective wetland conservation
Advisory Missions – help to identify and options is available at the international,
address challenges to the conservation and national, catchment and site level. Good
management of Ramsar Sites. governance and public participation are
critical throughout, management is required,
investment essential and knowledge critical.
Ramsar | Global Wetland Outlook | 2018 91. INTRODUCTION
Healthy, natural wetlands are critical for human
survival. Yet they face many challenges. The
Convention on Wetlands (the Ramsar Convention)
is the only international legal treaty primarily
focused on wetlands. It works globally to promote
their conservation and wise use, ensuring that
wetlands play a key role in delivering the Sustainable
Development Goals, Aichi Biodiversity Targets, the
Paris Agreement on Climate Change and other related
commitments. The Global Wetland Outlook outlines
the status and trends in wetlands worldwide, along
with the challenges and responses.
© Charlie Waite
10 Ramsar | Global Wetland Outlook | 2018Wetlands are globally important
for sustainable development
Wetlands are vital for human survival. They policy makers across all sectors to recognize and
include some of the world’s most productive take account of multiple wetland values, and
ecosystems and provide ecosystem services their interdependencies, is essential if wetland
leading to countless benefits (MEA 2005; Russi wise use and sustainable development are to
et al. 2013). Wetlands include permanently or be achieved. Effective management of wetlands
seasonally inundated freshwater habitats requires collaboration from many sectors of
ranging from lakes and rivers to marshes, along society, in particular those who make use of the
with coastal and marine areas such as estuaries, many benefits provided by wetlands, or who can
lagoons, mangroves and reefs. The global water influence their management and conservation.
cycle underpins primary production and
nutrient recycling and provides fresh water and This report outlines the state of the world’s
food for people. Wetlands are used for transport wetlands and their associated benefits. It will
and hydropower. They provide raw materials set a baseline to assess progress on the Ramsar
and genetic resources, including medicines. Convention’s Strategic Plan, 2016-2024, and
They also help to mitigate floods, protect strengthen the attention given to wetlands
coastlines and store and sequester carbon. in the Sustainable Development Goals, Aichi
Many are important for culture, spiritual values, Biodiversity Targets, Sendai Framework for
recreation and inspiration. Some of these Disaster Risk Reduction and the Paris Climate
benefits are summarized in Figure 1.1 below. Agreement. It examines the state and trends of
wetlands, identifies knowledge gaps and looks
The contributions that wetlands make to to potential changes in the future. The Global
human well-being have often been overlooked Wetland Outlook identifies many negative
or underappreciated. Consequently, wetland trends, but also highlights successes and best
management has been underplayed in practices. It reviews the drivers of wetland loss
development planning. Stakeholders in one and degradation and outlines responses for the
sector make decisions based on narrow and wetland community and other sectors.
short-term interests, losing opportunities to
achieve multiple benefits, and causing further
wetland loss and degradation. Encouraging
Box 1.1
CONTEXT FOR THE GLOBAL WETLAND OUTLOOK
The Global Wetland Outlook builds Biodiversity (Russi et al. 2013), which all
on analyses such as the Millennium noted the loss and degradation of wetlands
Ecosystem Assessment (MEA 2005), the and the importance of wetlands for ecosystem
Global Biodiversity Outlook (Convention services and supporting local communities.
on Biological Diversity 2014), Global Land It draws on a large body of published literature,
Outlook (UNCCD 2017), Land Degradation including that developed and compiled by
and Restoration Assessment (IPBES 2018), the Convention’s Scientific and Technical
and The Economics of Ecosystems and Review Panel since its inception in 1993.
Ramsar | Global Wetland Outlook | 2018 11The Ramsar Convention’s role
The Convention on Wetlands is the only Another key Ramsar concept is the ecological
international legal treaty with a primary focus on character of wetlands: “the combination of the
wetlands, signed in 1971 in the Iranian city of ecosystem components, processes and benefits/
Ramsar and known as the Ramsar Convention. It services that characterize a wetland at a given point
came into force in 1975 and to date 170 countries in time” (Ramsar Convention 2005). Countries are
have joined as Contracting Parties. The wise use encouraged to maintain the ecological character
framework developed by the Convention (see of all wetlands, and are required to report any
Box 1.2) provides a mechanism for ensuring adverse human-induced changes in a Ramsar
that wetlands are incorporated into the global Site to the Secretariat and take necessary actions
agenda for sustainable development, supporting to restore these sites to their former state.
initiatives relating to biodiversity, climate change,
disaster risk reduction and land degradation.
The Convention defines wetlands rather broadly WISE USE OF WETLANDS
as “areas of marsh, fen, peatland or water, “Wise use” is at the heart of the
whether natural or artificial, permanent or Convention and applies to all wetlands.
temporary, with water that is static or flowing, It is defined as “the maintenance of [a
fresh, brackish or salt, including areas of marine wetland’s] ecological character, achieved
water the depth of which at low tide does not through the implementation of ecosystem
exceed six metres”. Ramsar recognizes 42 wetland approaches, within the context of
types in three categories: marine and coastal sustainable development” (Ramsar
wetlands, inland wetlands and human-made Convention 2005). Human well-being
wetlands (Ramsar Convention Secretariat 2010a). depends on wetland ecosystem services.
Wise use focuses on managing wetlands
Contracting Parties have three primary and human needs across landscapes
obligations, the “pillars” of Ramsar: in collaboration with local communities,
1. Conserving and using wisely all wetlands underpinned by good governance. While
(see Box 1.2); some wetland development is inevitable,
2. Designating and conserving at least one it is not suitable for every wetland.
Wetland of International Importance, or Contracting Parties promote wise use
Ramsar Site (Figure 1.2); and through national policies and legislation;
3. Cooperating across national boundaries on inventory, monitoring and research;
transboundary wetlands, shared wetland training, education and public awareness;
systems and shared species (see Box 1.3, and integrated site management plans.
Gardner & Davidson 2011).
Box 1.2
Figure 1.1
Ecosystem services
cultural provisioning regulating
from wetlands services services services
Sacred natural sites and Fish and other food Carbon sequestration (e.g. blue carbon)
other faith sites Raw materials – timber, fodder, skins Water purification
Recreation Genetic resources Flow rate regulation
Tourism and ecotourism Water supply Flood mitigation
Cultural monuments Medical resources Coastal protection
Hydropower Waste decomposition
supporting services
Primary production Nutrient recycling Global water cycle
12 Ramsar | Global Wetland Outlook | 2018The Ramsar Convention works
nationally and internationally
There are currently over 2,300 Ramsar Sites, international importance. Ramsar Sites likely
covering almost 250 million hectares, an area cover 13-18% of the global area of terrestrial and
almost as large as Greenland. Each site meets coastal wetlands, demonstrating considerable
at least one of nine criteria—related to wetland commitment from Contracting Parties
types, ecological communities and support for (Davidson & Finlayson 2018).
waterbirds, fish and other taxa—that signify
Box 1.3
INTERNATIONAL COOPERATION
The Ramsar Convention calls for international Authority with Benin, Burkina Faso,
cooperation in wetland management Cameroon, Chad, Côte d’Ivoire, Guinea,
(Ramsar Convention Secretariat 2010b). Mali, Niger and Nigeria. Management of
One response is cooperation across shared species is also important, including
national boundaries, either informally or migratory, non-migratory and invasive alien
through the designation of Transboundary species. Examples include the East Asian–
Ramsar Sites. Twenty such sites exist, Australasian Flyway Partnership, a Ramsar
including two trilateral sites: the Wadden Regional Initiative, and through less formal
Sea (Denmark, Germany and The cooperation with the Western Hemisphere
Netherlands) and the Floodplains of the Shorebird Reserve Network.
Morava-Dyje-Danube Confluence (Austria,
Czechia and Slovakia). Collaboration covers Ramsar additionally has 15 networks for
river basins through multi-state management regional cooperation and four Ramsar Regional
commissions, such as the Niger Basin Centres for training and capacity building.
Figure 1.2:
Wetlands of
International
Importance
throughout the
world. Source: RSIS
Ramsar | Global Wetland Outlook | 2018 13Wetlands in global
policy and targets
Healthy, ecologically functioning wetlands are Aichi Targets
a key delivery mechanism for several other The “Aichi Biodiversity Targets” are part of the
global commitments, including those relating Strategic Plan for Biodiversity 2011-2020, from
to biodiversity, sustainable development, the Convention on Biological Diversity; virtually
land degradation, climate change and disaster all are relevant to wetlands (Juffe-Bignoli et
risk reduction. al. 2016). Several seek to halt ecosystem loss,
including Target 5 that aims to at least halve,
2030 Sustainable Development and ideally eliminate, loss of natural habitats
Agenda and Sustainable by 2020, and Target 11 that aims to conserve at
Development Goals least 17% of terrestrial and inland water, and
Wetlands are central to meeting many of the 10% of coastal and marine areas by 2020 in
United Nation’s 17 Sustainable Development “effectively and equitably managed, ecological
Goals (SDGs) and 169 associated targets, representative and well connected systems of
focusing on poverty, hunger, health, energy, protected areas and other effective area-based
consumption and climate change. These will conservation measures”. Target 10 focuses
set the agenda for global development efforts on conservation of coral reefs, Target 6 on
in the next decade. SDG 15 specifically calls for sustainable use of aquatic species and Target 7
conservation and sustainable use of “inland on management of aquaculture (CBD 2010).
freshwater ecosystems and their services”. SDG
14 encourages protection of coastal and marine Land degradation neutrality
areas. SDG 6 focuses on water and sanitation The UN Convention to Combat Desertification
with a target relating to trends in water-related set a target for land degradation neutrality
ecosystems, which will draw on data from to halt the slide towards further degradation.
Ramsar. Several SDGs are modelled on Aichi Many forms of land degradation are linked
targets (see below) and like them will be revised to water management, and land degradation
after 2020. directly impacts wetlands such as peatlands,
estuaries and rivers; these include some of the
degradation hotspots around the world.
14 Ramsar | Global Wetland Outlook | 2018Wetlands in international
agreements
The Paris Agreement Biodiversity-related
In December 2015, 196 governments agreed multilateral agreements
to an ambitious programme of climate change Wetlands and wetland-dependent species are
mitigation and adaptation under the UN protected under other biodiversity-related
Framework Convention on Climate Change. Multilateral Environmental Agreements
This calls on States to develop Nationally (MEAs), such as the Convention on Biological
Determined Contributions (NDCs) to address Diversity, the Convention on Migratory
climate change, with nature-based solutions Species (and its African-Eurasian Migratory
as a key component, including from wetlands. Waterbird Agreement), the Convention on
These have a critical role in both adaptation International Trade in Endangered Species of
and mitigation; in the latter through carbon Wild Fauna and Flora, and the World Heritage
storage and sequestration, particularly in peat Convention. Secretariat-level collaboration
soils and blue carbon in coastal waters (Ramsar occurs through the Biodiversity Liaison Group
Convention 2015). Encouraging countries to and engagement in MEA processes. Scientific
include wetland conservation and management and technical cooperation takes place through
in NDCs is a major priority. joint missions and coordinated guidance,
including on emerging issues such as responses
The Sendai Framework for to highly pathogenic avian influenza (Gardner
Disaster Risk Reduction & Grobicki 2016), guidance on rapid ecological
In March 2015, the UN Office for Disaster Risk assessment of biodiversity in inland, coastal
Reduction agreed on a 15-year voluntary strategy and marine waters (Convention on Biological
on disaster risk reduction. The non-binding Diversity & Ramsar Convention 2006), and
agreement recognizes the need to “implement joint commitments to Land Degradation
integrated environmental and natural resource Neutrality with the UN Convention to Combat
management approaches that incorporate Desertification (Ramsar Convention and
disaster risk reduction”. The importance of UNCCD 2014).
wetlands in building resilient communities is
emphasized, noting their role in reducing flood
risks and attenuating storm damage.
© Vicente Weippert
Ramsar | Global Wetland Outlook | 2018 152. STATUS AND TRENDS
Ramsar tracks global wetland status and trends,
which helps measure progress in Sustainable
Development Goal 6. Natural wetlands have declined
in inland, coastal and marine habitats; a small growth
in artificial wetlands fails to compensate. Populations
of wetland-dependent species are declining and many
are threatened. Global water quality is still getting
worse. Yet wetlands are critically important for their
ecosystem services: food and water security, disaster
risk reduction and carbon sequestration amongst
others. Their economic and biodiversity value far
outweighs many terrestrial ecosystems.
© Adobe Stock/Baronb
16 Ramsar | Global Wetland Outlook | 2018Ramsar tracks global status
and trends in wetlands
Given the specific requirement for Ramsar 2018 countries include such data in National
Contracting Parties to maintain the “ecological Reports to the Convention. As the Convention
character” of all wetlands through “wise use”, is co-custodian with UN Environment of the
the analysis of status and trends is structured UN Sustainable Development Goal indicator
around the Convention’s definition of ecological 6.6.1 (Change in the extent of water-related
character (Box 2.1). It therefore addresses ecosystems over time) these data will be used
the ecosystem components, processes and as a formal mechanism for reporting.
services that comprise the ecological character
of wetlands, to the extent that information
is available. Data on the ecological character The Ramsar obligation to maintain the
of wetlands such as wetland extent are now ecological character of wetlands includes
being collected from Contracting Parties the Convention on Biological Diversity’s
through wetland inventories, and from January ecosystem approach.
BOX 2.1
ECOLOGICAL CHARACTER OF WETLANDS
(RAMSAR CONVENTION 2005)
In 2005 the Convention redefined wetland Wetlands of International Importance
“ecological character” as “the combination (“Ramsar Sites”) as was previously the case,
of the ecosystem components, processes following changes in 2005 to the definition
and benefits/services that characterize the of “wise use” (Finlayson et al. 2011). The
wetland at a given point in time” as shown Convention further requires Contracting
in Figure 2.1. Parties to report if the ecological character
of a Ramsar Site “has changed, is changing
Contracting Parties are now required to or is likely to change as the result of
maintain the ecological character of all technological developments, pollution or
wetlands, not just those designated as other human interference”.
Figure 2.1
Conceptualization of
ecological character
as the components,
processes and Components Ecosystem
ecosystem services • Biological services
that characterize - Genetic • Provisioning
- Species
a wetland (from
- Ecosystem Processes •
•
Regulating
Supporting
Finlayson et al. 2016) • Hydrological cycling
• Chemical • Cultural
• Physical • Nutrient cycling
• Energy cycling
• Soil formation
• Primary production
• Species interactions
• Dispersal & migration
Ramsar | Global Wetland Outlook | 2018 17Accuracy of global wetland
area data is increasing
The most recent estimate of global inland and Estimates of global wetland extent have
coastal wetland area is in excess of 12.1 million increased considerably since the 1980s, due
km2, an area almost as large as Greenland. Of largely to recent improvements in remote
this, 54% is permanently inundated and 46% sensing and mapping methods; this is not a
seasonally inundated. An estimated further 5.2 reflection of any real increase in the area of
million km2 are intermittently or occasionally wetlands (Davidson et al. 2018).
inundated, but this is believed to include areas
of former converted wetlands affected by The largest areas of wetlands (Figure 2.2) are
extreme storm events. Around 93% of wetlands in Asia (32% of the global area), North America
are inland systems, with 7% being marine and (27%) and Latin America and the Caribbean
coastal – although this coastal estimate does (16%). Wetland areas in Europe (13%), Africa
not include several wetland classes such as (10%) and Oceania (3%) are smaller (Davidson
nearshore subtidal wetlands, which also fall et al. 2018).
into the Ramsar definition. Global areas of
human-made wetlands are small in comparison:
reservoirs cover an estimated 0.3 million km2
and rice paddy 1.3 million km2 (Davidson et al.
2018; Davidson & Finlayson 2018).
bbe a
an
ari eric
& Cn Am
ia
ca
ope
ean
ica
eri
Am th
a
r
Eur
i
Asi
Afr
No
Oc
Lat
Figure 2.2
Regional distribution
(%) of wetland area
(from Davidson et al.
2018) 31.8% 27.1% 15.8% 12.5% 9.9% 2.9%
INSERT PIC - problem
© Equilibrium Research
18 Ramsar | Global Wetland Outlook | 2018Natural wetlands have
declined and artificial
wetlands increased
Figure 2.3 Remaining natural wetlands cover only a 1.2
WET Index global fraction of their original area and have been
1
and regional trends in progressively declining for centuries in most
natural wetland area of the world, through drainage and conversion 0.8
since 1970. Source:
UN WCMC (2017)
(see Box 2.2). Up to 87% of the global wetland
Note that the WET resource has been lost since 1700 CE in places 0.6
Index analyses trends where data exist (this may not represent the 0.4
only in reported global total), with rates of loss increasing in the
cases, and should late 20th century (Davidson 2014). However, 0.2
not be taken as an
indication of total
recent assessments of trends in global water
0
wetland area change inundation area and global open water area
1970 1975 1980 1985 1990 1995 2000 2005 2010 2015
on a continental scale. (both natural and human-made wetlands) report
both losses (Prigent et al. 2012; Schroeder et al.
Natural WET Index
2015) and gains (Pekel et al. 2016; Box 2.4) in
by Region (top)
net area over different time periods.
Africa 1.2
Asia
Europe
Since 2014, the Ramsar Convention has 1
Latin America & commissioned the UN Environment World
0.8
Caribbean Conservation Monitoring Centre to develop a
North America Wetland Extent Trends (WET) Index (Dixon 0.6
Oceania et al. 2016), based on a sample of wetlands.
0.4
The WET Index collates over 2,000 time-series
Inland and Marine/ data from 1970 to 2015, subdivided by region 0.2
Coastal WET Index
and wetland classification. Average trends are
weighted by region 0
(bottom) aggregated and analysed.
1970 1975 1980 1985 1990 1995 2000 2005 2010 2015
Global marine/
coastal weighted In 2017, the analysis extended to all Ramsar
Global inland regions and shows a continuing progressive
weighted decline (UN WCMC 2017). It suggests (Figure
2.3) a decline of about 35% in both marine/ The average annual rate of natural wetland loss
coastal and inland natural wetland areas studied estimated by the WET Index is -0.78% a year;
between 1970 and 2015, with a decline in average over three times faster than the average annual
wetland extent in all regions, which varies from rate of loss of natural forests (-0.24% a year)
12% (Oceania) to 59% (Latin America, mainly between 1990 and 2015 (FAO 2016a). Rates of
data on the Caribbean excluding Orinoco and natural wetland loss have accelerated from -0.68
Amazon for the wetlands sampled). to -0.69% a year between 1970 and 1980 to
-0.85 to -1.60% a year since 2000.
In contrast, human-made wetlands have
Figure 2.4 3
increased since the 1970s (and earlier),
WET Index global
trend in human- 2.5 sometimes from conversion of natural wetlands.
made wetland area Reservoirs’ extent has increased by about 30%
2
since 1970. Source: and rice culture by about 20% (Davidson et al.
UNEP-WCMC (2017) 2018); see also below (page 24). The WET Index
1.5
suggests a two-fold increase in human-made
Human-made
WET Index with 1 wetland area since 1970 for the areas studied
upper and lower (Figure 2.4), although areas are relatively small
0.5
confidence limits compared to natural wetlands (Davidson et
0
al. 2018). Limited data availability means that
1970 1974 1978 1982 1986 1990 1994 1998 2002 2006 2010 2014 regional trends could not be calculated.
Ramsar | Global Wetland Outlook | 2018 19Wetland change in Europe
illustrates global trends
Land-use change in Europe over two thousand & Beck, 2007). In the 1960s, Project Mar
years has resulted in wide-scale wetland collated national inventories of Wetlands of
drainage, mainly for agriculture and urban International Importance (IUCN 1965) and
development. Change has been acute in found accelerated wetland loss since the 1940s:
estuaries, claimed for agriculture, port and “Every day between 1960 and 1965 a kilometre
industrial development (Davidson et al. 1991), of European coast was developed” (Airoldi &
and in river valleys and floodplains. The Beck 2007). Davidson (2014) reported major
ecological character of many wetlands has losses in coastal and inland European wetlands
changed, including creation of reservoirs and during the 20th and early 21st centuries.
other water storage: in Iberia dams have been Conversely, new wetlands have been created by
constructed on all major rivers (Nicola et al. the filling of reservoirs, flooding quarries and
1996). Habitat loss has damaged ecosystem gravel pits and restoration of drained wetlands
functions and services, especially in shallow- (e.g., Hertzman & Larsson 1999). The WET
water fisheries (Lotze et al. 2005; Lotze 2007), Index suggests an overall loss of about 35% of
e.g., in the Wadden Sea (Eriksson et al. 2010), European inland and coastal wetlands since
and the loss of most native oyster reefs (Airoldi 1970 (UN WCMC 2017).
Box 2.2
© Michelle Guamanzara Medina
WETLAND AREA TRENDS IN MEDITERRANEAN WETLANDS
The Wetland Extent Trends (WET) Index was is in part due to only including sites which
calculated for c. 400 Mediterranean wetland still had a good extent of wetland habitats,
sites and indicates a loss of 48% of natural thus excluding those totally or largely lost by
wetlands from 1970-2013. This suggests 2005. Conversely, literature reports for the
that the region’s wetlands have fared other sites are likely to lead to overestimated
worse than those of the three surrounding loss, since sites with large wetland losses
continents (Africa 42% loss, Asia 32% and are more likely to be reported. These two
Europe 35%) (UN WCMC 2017). This is opposite biases illustrate the influence of
in contrast to previous calculations, which sampling on calculated regional wetland
used only a subset of three-quarters of the losses. Source: Mediterranean Wetland
400 sites and found a loss of 9% of natural Observatory (2018)
wetlands from 1975-2005. This smaller loss
20 Ramsar | Global Wetland Outlook | 2018Area of natural inland wetlands is
changing and generally declining
Data on the extent, distribution and trends of Inland natural (surface) wetlands are dominated
wetland types are still incomplete, although by three broad classes: peatlands, marshes
national reporting on extent by Ramsar and swamps on alluvial soils, and natural
Contracting Parties to the thirteenth Ramsar lakes. Together these form about 80% of
Conference of Parties provides preliminary the global area of surface inland wetlands
national data. Further reporting will soon (Figure 2.5). Peatlands overall form over
provide national data that can be aggregated at 30% of inland wetlands. Areas of rivers and
regional and global levels as well as on Ramsar streams, forested peatlands and swamp and
Classification of Wetlands, Inland, Marine and flooded forests on alluvial soils are smaller. No
Coastal and Human Made Wetlands. Through information is available on areas of different
this mechanism, national validated data on an types of groundwater-dependent wetlands,
accepted international definition of wetlands but underground wetlands may underlie much
will be provided to measure SDG indicator of the c. 19 million km2 of carbonate rocks on
6.6.1 on extent of water related ecosystems. the global land surface (Williams 2008) – a
Multiple sources of information about different larger area than that of inland and coastal
wetland types are presented from Davidson and surface wetlands.
Finlayson (2018); however separate information
is not available for all 42 wetland types in the Most inland wetland classes for which there are
Ramsar classification. Generalized wetland data are declining in global area, with major
classes are therefore used in the descriptions declines in forested and tropical peatlands,
below (see Tables 2.1-2.3). although there was little overall change in global
peatland area between 1990 and 2008, and
a reported small increase in the area of non-
forested peatlands (data from Joosten 2010)
– possibly partly through conversion of forested
peatlands (Table 2.1).
s
am
es
tlan sted
e
str
lak
am &
ds
ds
pea-fore
ps
ds
we ested
sw shes
pea sted
&
tlan
ral
tlan
ers
tu
e
n
r
Figure 2.5
For
Ma
For
Riv
Na
No
Relative areas (%)
of natural inland
wetland classes
(from Table 2.1).
6% 29% 27% 6% 22% 10%
Box 2.3
TRENDS IN GLOBAL SURFACE WATER AREA
Between 1984 and 2015 there was an permanent water formed in areas previously
estimated loss of almost 0.09 million km2 of devoid of surface water. All continental
permanent surface water (fresh and saline) regions show a net increase in permanent
(2% of global water area measured). This water, except Oceania, which had a fractional
loss was offset by 0.21 million km2 of new (1%) net loss (Pekel et al. 2016). These data
permanent water bodies, of which 0.03 need to be interpreted in relation to the
million km2 changed from seasonally to time period assessed, taking into account
permanently flooded and 0.18 million km2 of extreme events such as drought and floods.
Ramsar | Global Wetland Outlook | 2018 21Change in inland wetlands
Inland natural wetlands Global area (million km2)
Global area Global area
Wetland Wetland
change change
classes sub‑classesa
(% change)b (qualitative)c
Table 2.1 Rivers & streams 0.624-0.662 ê
Extent and area Natural lakes 3.232-4.200 ê
change of natural
inland wetland Natural lakes (>10 ha) 2.670 ê
classes (Source:
Davidson & Finlayson Natural pools (1-10 ha) 0.562
2018). Light blue
shading indicates no Peatlands 4.232 -0.97
information available. Non-forested peatlands (bogs, mires &
3.118 +6.80
fens)
Qualitative area
changes: Forested peatlands 0.696 -25.32 ê
è No change: Tropical peatlands 1.505 -28 ê
(±5%)
ê Decrease Temperate & boreal peatlands 3.380
(-5-50%)
Marshes and swamps (on alluvial soils),
é Increase 2.530 ê
including floodplains
(+5-50%)
Tropical freshwater swamps (alluvial soils) 1.460 ê
Forested wetlands (on alluvial soils) 1.170
Groundwater-dependent wetlands
Karst & cave systems
Springs & oases
Other groundwater-dependent wetlands
a
Different wetland sub-classes are defined according to different criteria and do not necessarily add up to the
total figure for the wetland class. The areas provided for temperate/boreal and tropical peatlands are not additive
to those for non-forested and forested peatlands; rather, these are two different spatial dis-aggregations of all
peatlands.
b
Year-ranges for % area change vary between sources and wetland classes: peatlands, non‑forested peatlands,
forested peatlands 1990-2008, tropical peatlands 2007-2015.
c
If no quantitative trend was available, a qualitative trend was interpreted from a range of published trends for
smaller areas of the wetland category (from Davidson & Finlayson 2018).
22 Ramsar | Global Wetland Outlook | 2018Area of natural coastal/
marine wetland types is
also declining over time
The largest areas of natural marine/ will be a large area, but shellfish reefs and kelp
coastal wetlands are unvegetated tidal forests smaller.
flats, saltmarshes and coral reefs, together
Figure 2.6 forming almost 80% of the global total, with Almost all coastal natural wetland classes have
Relative areas (%) mangroves and seagrass beds having smaller declined in global area (Table 2.2), many with
of natural marine/ areas (Figure 2.6). These figures do not considerable losses (coastal deltas, seagrass
coastal wetlands include sand dunes, beaches and rocky shores, beds and shellfish reefs). The exception is kelp
(from Table 2.2) shellfish reefs, kelp forests and shallow forests for which trends are highly variable, with
Unvegetated subtidal systems, for which area information declines in some parts of the world but increases
tidal flats is lacking. Of these, shallow subtidal systems in others.
Saltmarshes
Coastal deltas
Mangroves
Seagrass beds
Coral reefs
(warm water
systems)
28% 34% 2% 8% 11% 17%
Global area (million km2)
Wetland Wetland sub- Global area Global area change
classes classesa change (%)b (qualitative)c
Table 2.2
Estuaries 0.660 ê-êê
Extent and area
change of marine/ Unvegetated tidal flats 0.458 ê-êê
coastal natural
wetlands (Sources: Saltmarshes 0.550 ê
Davidson &
Coastal deltas >0.030 -52.4 êê
Finlayson 2018;
Global Mangrove Mangroves 0.143 -4.3%
Watch). Light
blue shading Seagrass beds 0.177 -29 ê
indicates no data Coral reefs
or information 0.284 -19 ê
(warm water systems)
available.
Shellfish reefs -85 êê
Qualitative area Coastal lagoons ê
changes:
è No change: Kelp forests −0.018
(±5%) Shallow subtidal marine
systems
ê
ê Decrease
(-5-50%) Sand dunes/beaches/rocky
êêDecrease shores
(>-50%) Coastal karst & caves
é Increase
(+5-50%) a
Different wetland sub-classes are defined according to different criteria and do not necessarily add up to the
total figure for the wetland category.
b
Year-ranges for % area change vary between sources and wetland classes: coastal deltas 1986-2000;
mangroves 1996-2016; seagrass beds 1879-2005; coral reefs historical to 2008; shellfish reefs historical to 2010;
kelp forests 1952-2015.
c
If no quantitative trend was available, a qualitative trend was interpreted from a range of published trends
for smaller areas of the wetland class (from Davidson & Finlayson 2018).
Ramsar | Global Wetland Outlook | 2018 23Human-made wetland types
have increased in area
As natural wetlands decline, those made by soils. Global areas of wet grasslands, saltpans,
human agency continue to increase, often but aquaculture ponds and wastewater treatment
not always replacing natural wetlands. Major ponds are not available. Most classes of human-
areas of human-made wetlands are rice paddy made wetlands have increased considerably in
and water storage bodies such as reservoirs, with global area since the 1960s (Table 2.3) and may
much smaller areas of small ponds and tropical now form about 12% of the world’s wetlands.
palm oil and pulpwood plantations on peat
Table 2.3
Extent and area Human-made wetlands Global area Global area change Global area change
change of human- (million km2) (% change)a (qualitative)b
made wetlands Water storage bodies
(Source: Davidson &
Finlayson 2018). Light Reservoirs 0.443 +31.6 é
blue shading indicates
no data or information Small (e.g., farm) ponds 0.077 é-éé
available.
Agricultural wetlands
a
Year-ranges for Rice paddy 1.290 +30.2 é
% area change vary
between sources Palm oil plantations 0.002 +39 é
and wetland classes:
reservoirs 1970-2012; Wet grasslands ê
rice production area
Wastewater treatment/constructed
1965-2014; palm oil
wetlands é
plantations 1990-
2015. Saltpans (salines/salinas)
b
If no quantitative Aquaculture ponds
trend was available,
a qualitative trend Human-made karst & caves
was interpreted from
a range of published
trends for smaller
areas of the wetland
class (from Davidson
& Finlayson 2018).
è No change:
(±5%)
ê Decreases
(-5-50%)
é Increases
(+5-50%)
ééIncreases
(>+50%)
24 Ramsar | Global Wetland Outlook | 2018Populations of many wetland-
dependent species are declining
Recent assessments support earlier analyses The Red List Index (RLI), derived from IUCN
suggesting that many populations of wetland- Red List data, assesses trends in the survival
dependent species are in long-term decline and probability of groups of species (Butchart et al.
threatened with extinction. 2007):
The IUCN Red List assesses the level of threat • RLI trends are negative for all four wetland-
of extinction of plant and animal species, and dependent taxonomic groups with available
shows that: data (mammals, birds, amphibians and
• Of over 19,500 wetland-dependent species corals) (Figure 2.8), indicating that species
assessed globally, one-quarter (25%) are are increasingly moving towards extinction;
threatened with extinction; • Declines have been fastest for corals (driven
• 25% of inland wetland-dependent species especially by bleaching events linked to ocean
(of over 18,000 species surveyed) are acidification and warming);
globally threatened, with 6% being Critically • RLI index values are lowest for amphibians,
Endangered; indicating that they are under greatest threat
- Inland species dependent on rivers and (in particular due to the chytrid fungus);
streams are more globally threatened • Waterbirds have been in continuous decline
(34%) than those of marshes and lakes since the late 1980s.
Figure 2.7
Living Planet Index
(20%);
2016 for freshwater, - Inland wetland-dependent species have
marine and terrestrial a higher risk of extinction than their 2
biomes. Terrestrial terrestrial counterparts (Collen et al.
biomes include 2014);
tropical and temperate
forests, grasslands,
• There is a similar level of global threat (23%)
Index value (1970 = 1)
shrublands and for the much smaller number (less than
deserts. Source: 1,500) of coastal and near-shore marine 1
adapted from WWF species assessed, with only 1% being
(2016). Critically Endangered.
Living Planet Index
Terrestrial The Living Planet Index (LPI) calculates an
Marine average change in population abundance over 0
Freshwater time of populations of vertebrate species – the 1970 1980 1990 2000 2010
rate of change rather than absolute change in
population size. It shows that:
• Since 1970, 81% of populations of freshwater
species have declined globally (Figure 2.7):
a much greater decline than those of species
depending on any other ecosystem 1
Figure 2.8 (WWF 2016);
0.95
Trends in the Red • Between 1979 and 2008 there was an index
List Index of species increase for freshwater species of 36% in 0.9
Red List Index of species survival
survival of different
temperate regions – but an index decrease of 0.85
wetland-dependent
species taxonomic 70% in tropical regions (WWF 2012);
0.8
groups. Source: • In contrast to the freshwater LPI, much of the
BirdLife International 36% decline in the 2016 marine LPI occurred 0.75
(2015). between 1970 and the late 1980s, after 0.7
Birds which the trend has stabilized (Figure 2.7), 0.65
Mammals reflecting the global trend in fish catch which
Amphibians stabilized, but at much lower population 0.6
1980 1985 1990 1995 2000 2005 2010 2015
Corals levels, after 1988 (WWF 2016). Year
Ramsar | Global Wetland Outlook | 2018 25You can also read