Investing in indonesia - 2015 KPMG indonesia kpmg.com/id
←
→
Page content transcription
If your browser does not render page correctly, please read the page content below
KPMG indonesia

Investing in
 Indonesia
             2015

     kpmg.com/id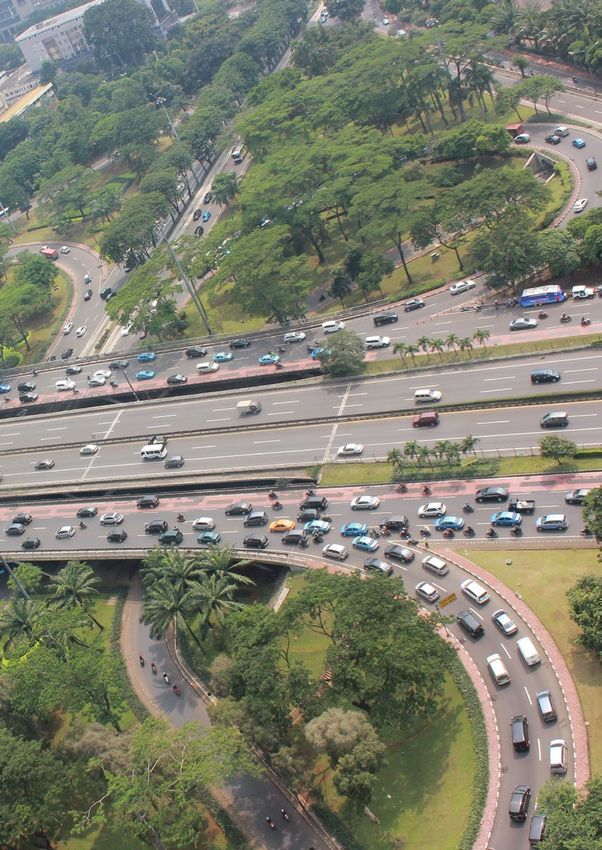
b | Investing in Indonesia - 2015

                                           1. Introduction                                              1

                                         2. Country Facts and Overview                              2

                                       3. Economic Environment                                  6

                                     4. Infrastructure                                     12

                                    5. Investment                                         16

                                6. Business Structures and Establishment              40

                            7. Foreign Exchange                                      46

                         8. Domestic and Foreign Trade - ASEAN                   48

                      9. Labor and Employment                                   54

                   10. Taxation                                             60

                11. Glossary                                               71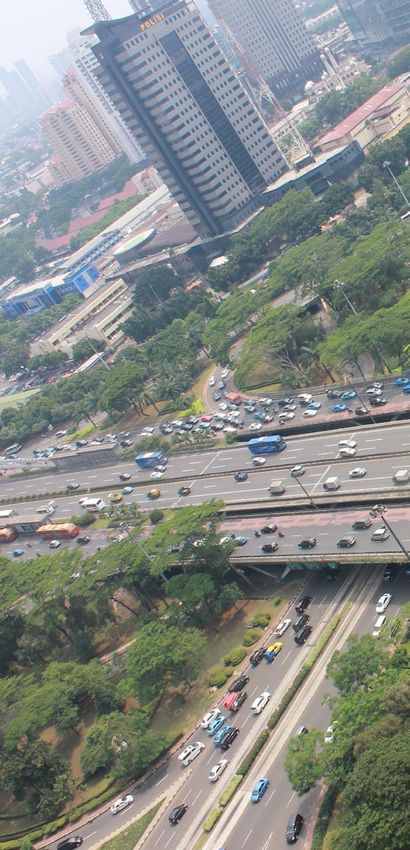
Investing in Indonesia - 2015 | 1

1. Introduction
2013 and 2014 were eventful years       Indonesia has an abundance of
for Indonesia’s economic, investment    foreign capital lining up to invest,
and political landscapes. In 2013       but until now has generally failed
the country’s strong economic           to covert this to levels of foreign
fundamentals enabled it to ride         investment other large developing
out a temporary economic “blip”         markets like China have been able
considered by many to be a              to attract. “Big deals”, too, are
necessary correction to cool a          less common than in other Asian
rapidly growing economy. In 2014        countries. While deal origination,
we saw economic growth slip to          execution and completion present
the lowest levels since 2009 in a       challenges and risks, a well planned
year characterized by a continuation    and executed investment in the
of falling global commodity             country can be very rewarding.
prices, lifting of fuel subsidiaries,   Having a degree of appetite for
a strengthening US dollar and           risk is fundamental to successfully
depreciating Indonesian rupiah. This    investing in an emerging economy
resulted in a decline in domestic       like Indonesia and reaping the
consumption, the main driver of         benefits and opportunities from a
Indonesia’s economic growth.            large, rapidly expanding population
                                        and all the upside of a quite
A new Investment Negative
                                        remarkable economic growth story.
List with a general tightening of
                                        Foreign and local recognition of
foreign investment restrictions was
                                        Indonesia’s enormous potential is
finally released ahead of the 2014
                                        not a topic of debate.
Parliamentary and Presidential
elections which heralded a new          This publication is intended as a
government taking office, and a         general guide to investing and doing
President’s public recognition of the   business in Indonesia primarily
importance of foreign investment to     for new foreign investors looking
ensure future sustained economic        to enter the Indonesian market,
growth. The tightening of foreign       but should also serve as a useful
investment restrictions in the          reference document for established
previously released Negative List       foreign and domestic Indonesian
seeming to many to be at odds with      investors. Practical insights and
the importance of foreign investment.   other intelligence from KPMG’s
                                        experience at the transaction
What is the outlook for Indonesia in
                                        “coalface” and through providing
2015 and beyond at a time when the
                                        transaction, M&A and tax advisory
economy is growing at its slowest
                                        services to foreign and local
pace in 5 years, and needs a boost
                                        investors and lenders can also be
from investment in infrastructure,
                                        found at appropriate junctures in this
education and other key sectors?
                                        publication.
Whilst the immediate view on 2015
could be considered challenging
or “mixed”, it is reasonable to
take a more positive longer term
outlook for a country located in        Note :
the world’s fastest growing region;     This publication is not intended to be a
                                        substitute for formal legal, tax or other
underpinned by the power of
                                        professional advice. To the best of our
optimism and positive sentiment but     knowledge, laws and regulations referred to
notwithstanding the likelihood of       throughout the document reflect the position
economic and other policy “hiccups”     as at 1 January 2015, or later where specifically
along the way.                          referenced.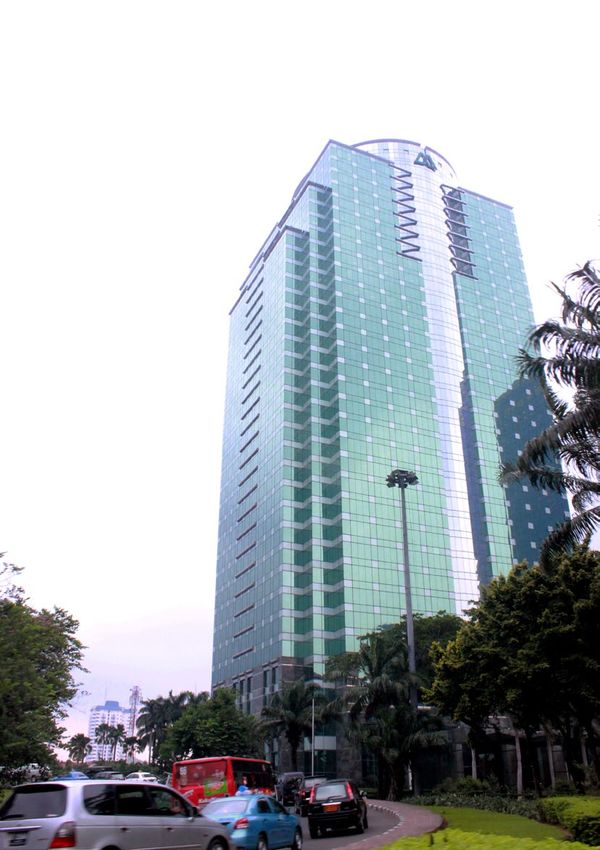
2 | Investing in Indonesia - 2015
2. Country Facts and Overview
Official Name Republic of Indonesia
Capital city Jakarta: which is the business and governmental centre
Other major cities Surabaya, Medan, Bandung. Surabaya is the second largest city and a major
and provinces industrial centre and port. There are 34 provinces comprising 508 Regencies, 6,694
Districts and 77,465 villages
Government Type: Independent Republic
Independence: 17 August 1945
Highest Authority: People’s Consultative Assembly (MPR)
Geography Location : Southeastern Asia, archipelago between Indian Ocean and Pacific Ocean
Largest Islands : Sumatra, Java, Kalimantan (Borneo), Sulawesi and Papua account for over 90%
of total land area. There are also two large groupings of smaller islands, Maluku
and Nusa Tenggara
Area : 1,904,569 sq km ( 736,600 sq mi). Land: 1,811,569 sq km; water: 93,000 sq km
Terrain : More than 17,508 islands; 6,000 are inhabited; 1,000 of which are permanently
settled
Coastline : 54,716 km
Climate Tropical, hot, humid, cooler in the highlands
People Nationality : Indonesian
Population : 252 million: >51% under age of 29 (2010-15E annual average growth: 1.4%)
Ethnic Groups: 42% Javanese, 15% Sundanese and 43% other ethnic groups
Religions : Islam 87%, Protestant 7%, Catholic 3%, Hindu 2%, Others 1%
Language Bahasa Indonesia (akin to Malay)
English is widely spoken by business people in major cities
Currency Indonesian Rupiah (IDR)
Inflation Average of 5.1% in 2010; 5.4% in 2011; 4.3% in 2012; 8.38% in 2013 and 8.36% in 2014
Central Bank estimates 4 – 5% in 2015
Forecast between 5.0% - 6.1% over 2011-15
Natural resources Oil, tin, natural gas, coal, gold, copper, silver, nickel, bauxite, timber, fertile soils
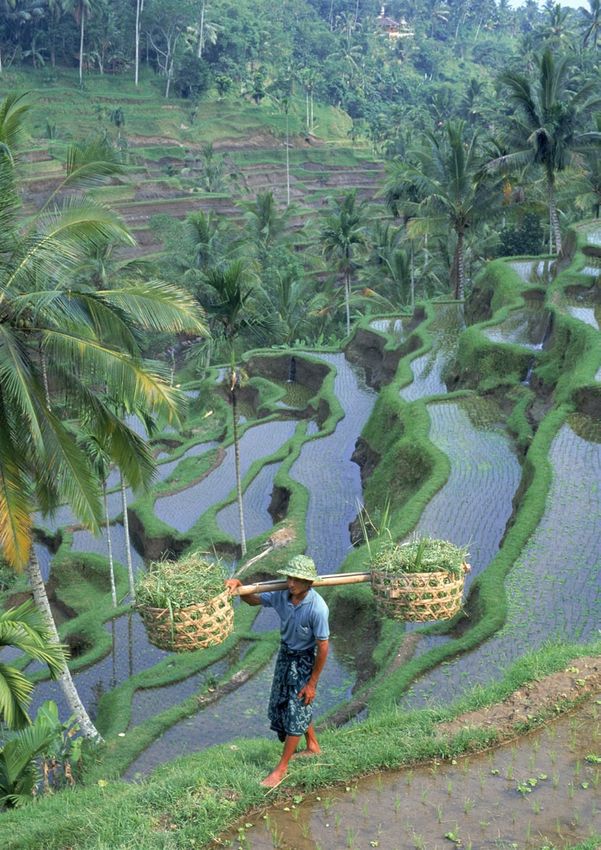
Agricultural products Rice, cassava (tapioca), peanuts, palm oil, rubber, cocoa, coffee, copra, poultry, beef, eggs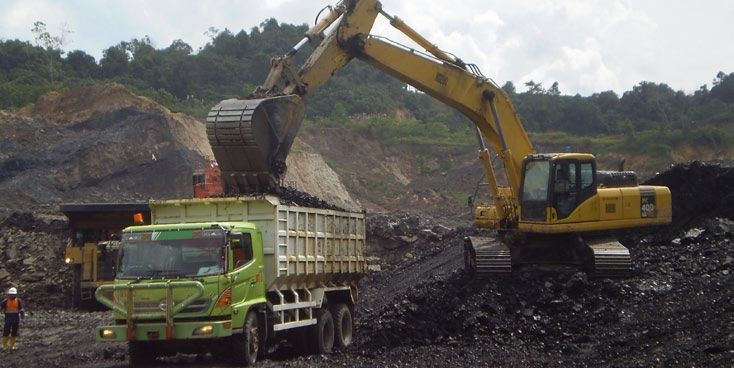
Investing in Indonesia - 2015 | 3

The Country
Indonesia is located in South-east Asia between the Indian
and Pacific Oceans and is bordered by Malaysia, Singapore,
East Timor and PNG. The main islands of Java, Sumatra,
Kalimantan, Sulawesi and Papua feature spectacular
mountain ranges flanked by rich coastal plains, fertile valleys
and large areas of lowlands. The smaller islands, many of
which are uninhabited, are often fringed by brilliant beaches
and coral reefs and bedecked with tropical palm trees.
A large percentage of world trade transits the strategically
important Straits of Malacca that link the Indonesian ocean
littoral to the South China Sea and the larger Pacific Ocean
basin.
Indonesia is rich in natural resources, coal, minerals like tin,
gold, copper, nickel and bauxite, oil & gas and fertile land
to support agricultural products. The archipelago’s tropical
weather and huge landbank makes it ideal for producing
palm oil, rubber, coffee, cocoa and rice, the staple of most
of the population. It is these resources, together with the
islands’ central location between India and the Orient, that
have made Indonesia so attractive to foreign traders, rulers
and investors both historically and as of today.

The capital city: Jakarta
Jakarta is the hub of the Indonesian economy where almost
all local and multinational corporate head offices are located
and business conducted. Mass commuting creates chronic
daily traffic congestion in many parts of the city. In addition
to the 10 million registered Jakarta residents, another
approximately 20 million people enter the sprawling city
every day from outlaying areas in Greater Jakarta. Traffic
jams are unavoidable during peak hours and not uncommon
at many other times of the day and early evening.

4 | Investing in Indonesia - 2015

The Economist Intelligence Unit has released “The Safe             The official language of the country is Bahasa Indonesia,
Cities Index 2015: assessing urban security in the digital         which is similar to Malay. This is the second language of
age” report covering 50 cities based on an Index comprising        many rural Indonesians after their local dialect or tongue,
digital and health security, infrastructure and personal safety.   of which there are almost 300. English language skills are
Jakarta ranks 50th and is in the bottom 6 places for all 4         actively encouraged in recognition of the opportunities
indicators. Cities in developing markets typically fall in the     English affords to Indonesians in education, commerce and
bottom half, with the top half of the index generally occupied     international relations. English is understood by business
by rich cities from Europe, East Asia and North America.           people in the cities. The country has a 93% literacy rate.
To put things in perspective, it is relevant that Jakarta is
                                                                   Over 87% of the population follow the Moslem faith, but
in a “bottom eleven” with Ho Chi Minh City, Bangkok and
                                                                   there are significant minorities of Hindus (centered in Bali),
cities of the BRIC economies. Selected sub-indicators
                                                                   and Christians.
that surface for Jakarta are number of doctors per 1,000
people, incidence of petty crime, population size, poverty
(or GDP per head), poor sanitation systems and pollution.
                                                                   The climate
Other indicators likely to be relevant indirectly drawn from
a comparison to 1st ranked Japan include lack of privacy           Straddling the equator from latitude 60°N to 110°S,
policies or enforcement, low viligance of disease outbreaks        Indonesia has a typically tropical climate marked by heavy
and natural disasters as well as transport system design and       rainfall as well as high humidity and temperatures. Rainfall
construction. Whilst needs for improvements and remedial           increases during the monsoon season which typically runs
action is recognized and are underway to varying degrees,          from October to April. The tropical climate is moderated
long lead times are involved.                                      by mountains in large parts of the country. Temperatures
                                                                   generally range from 23° to 33°C.
The city’s vibrance is not captured in reports like these, nor
the friendliness of the Indonesian people.
                                                                   The type of government
The people                                                         The 1945 Constitution of the Republic of Indonesia provides
                                                                   for independent executive, legislative and judicial functions.
The people of Indonesia are culturally diverse reflecting their
                                                                   The highest authority is the People’s Consultative Assembly
differing ethnic origins, religions and histories.
                                                                   (MPR), which meets annually to hear accountability
With an estimated population of 252 million, Indonesia is the      reports from the President and government agencies and
fourth most populous nation in the world after China, India        provide policy guidance. The MPR includes the House of
and the USA, as well as the world’s most populous Muslim           Representatives (DPR), which has 560 members, and the
nation. 51% of the population is below 29 years of age, while      Council of Regional Representatives (DPD) which has 132
about 67% is below 39 years of age. The most populated             members. Members are elected to five year terms.
islands are Java, Sumatra, Sulawesi and Kalimantan. Java,
                                                                   The President and Vice-president are elected by direct
Bali and Madura are the most densely populated with Papua,
                                                                   popular vote. The president is the Chief Executive, the Head
Kalimantan and many of the smaller islands having low
                                                                   of State and Commander-in-Chief of the Armed Forces, and
population densities. The most populous cities are Jakarta,
                                                                   also appoints Cabinet Ministers who are responsible only to
Surabaya and Bandung in Java, and Medan in Sumatra.
                                                                   him/her.
About 53% of the population resides in urban areas, with the
annual rate of urbanization estimated at 1.4% over 2010-15.        The country is divided administratively into 34 provinces
                                                                   headed by a Governor and elected provincial assemblies, and
Most Indonesians are of Malay descent and the largest
                                                                   hundreds of districts and municipalities headed by a Regent,
ethnic group, the Javanese, make up 42% of the total
                                                                   each with its own elected council assemblies. Governors and
population. The Javanese are pre-eminent in the social
                                                                   Regents are appointed by, and report to, the local assembly
elite, bureaucracy and the armed forces. There is also an
                                                                   or council. These regional governments have responsibility
ethnic Chinese minority whose influence in business is
                                                                   to administer a wide range of matters, including health,
proportionately greater than their numbers. Papua, the
                                                                   education and investment.
eastern half of the island of New Guinea, is peopled by
Melanesians.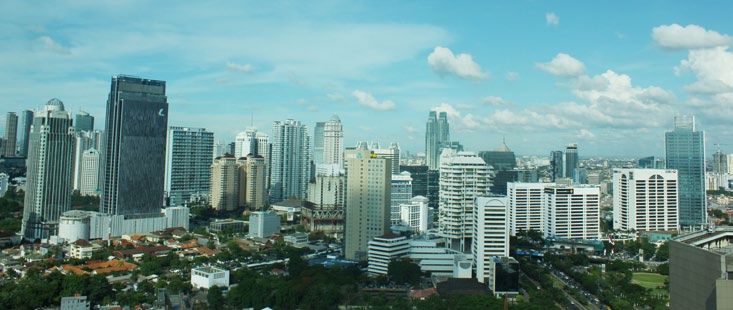
Investing in Indonesia - 2015 | 5

In October 2013 the House of Representatives approved                    Professional advice should always be obtained with regard
the creation of 8 new provinces involving formation of 65                to contracts and agreements made in Indonesia. One reason
new regions. The mindset at the time was based around                    is that the civil law provides for certain clauses to apply to
bringing government closer to the people, making land                    all agreements unless specifically excluded. Litigation can
ownership processing more accessible and improving                       be unpredictable in terms of outcomes, protracted and time
prosperity, particularly in under developed border areas. The            consuming, and as a result is not commonly an effective
House’s proposal was rejected or set aside, with criticism               route to resolve disputes. The protection provided by
sighting opening up of regional bureaucracies bringing fresh             agreements of themselves can be limited, and commercial
opportunity for corruption, and costs of financing elections             arrangements should be designed, where possible,
better applied in building infrastructure, education and health          with safeguards which can operate in the event of later
facilities: Infrastructure is discussed in Chapter 4. Statistics         disagreements. Contracts commonly include Indonesian
presented by APINDO (Indonesian Employers Association)                   or international arbitration for resolution of disputes. A
showed that 85% of new regions failed to develop due                     popular choice is Singapore in accordance with the rules and
to reluctance of investors to do business in new and                     regulations of the Singapore International Arbitration Centre,
geographically remote areas due to legal uncertainty, unclear            where the final, binding arbitral award is automatically ratified
and conflicting regional regulations as well as hidden fees:             in the Indonesian Courts.
regional autonomy is a country investment risk referred to in
                                                                         Indonesian laws become operative following issuance
Chapter 5: Investment.
                                                                         of implementing regulations, and can be subsequently
                                                                         stipulated in Ministerial and Presidential regulations and
                                                                         decrees. A significant period of time can elapse between
The type of legal system
                                                                         new laws being announced, drafted, passed by Parliament
The judiciary is based on the Supreme Court and separate                 and final regulations or decrees being rolled out.
courts for public administration and military, religious and civil
matters. A comprehensive system of civil laws has replaced
most of the statutes established by the Dutch. In addition,
there is an extensive range of decrees and regulations
developed and applied by government departments. For
foreign investors, the most relevant areas are laws regarding:
• foreign investment
• company law
• business licensing and trade
• taxation and customs
• labor
• land and buildings
• regional regulations.

Certain industries are subject to specific regulations and
requirements, including oil & gas, financial services and
mining which are covered in Chapter 5: Investment.

Sources:
(1) KPMG Research and Intelligence
(2) Central Statistic Agency (BPS) website: www.bps.go.id, February 2015
(3) Central Bank (BI) website: www.bi.go.id, January 2015
(4) Economist Intelligence Unit (EIU), “The Safe City Index 2015”, January 2015
(5) Jones Lang LaSalle, “Economic Insight Jakarta City Living – Need or Choice”, September 2011
(6) Jones Lang LaSalle, “Investment Case for Indonesia”, September 2012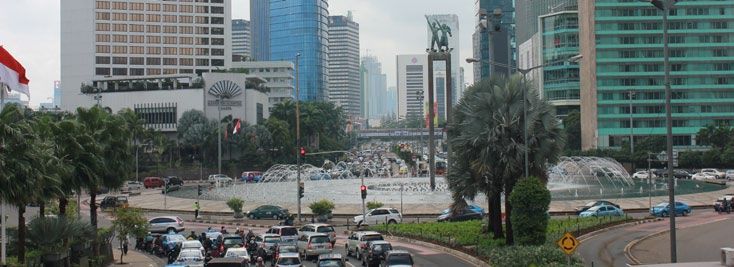
6 | Investing in Indonesia - 2015

3. Economic Environment

Size and state of the Indonesian economy                         most populous nation and is also the largest market in South-
                                                                 east Asia. Indonesia’s 250 million people make up 40% of
Indonesia has a large domestic consumption base, and the
                                                                 the 625 million of combined ASEAN countries.
country’s middle class with increasing levels of disposable
income and purchasing power has grown substantially from         Indonesia was ranked the world’s 16th largest economy with
38% of the population or 81 million in 2003 to 56.6% or 131      GDP of USD978 billion in 2014 or IDR10,542.7 trillion with
million in 2010. A World Bank report indicated that the middle   GDP per capital IDR41.8 million (USD3,532). Predictions are
class grew by 61.73% over this 7 year period, with over 7        for Indonesia to be the 7th largest economy in the world by
million people being elevated to the middle class segment.       2030 provided economic growth rates can be achieved by
Quite rightly, the definition of “middle class” is now being     fully taking advantage of the rapidly expanding consumer
re-evaluated and debated, with numbers arrived at by market      class, which includes maximizing the country’s attractiveness
analysts and the World Bank ranging at various estimates         for foreign investment. An April 2014 World Bank report
between 44 million (18% of the population) to 146 million        rated Indonesia as already having the 10th largest economy
(59%). The World Bank’s 44 million (18%) middle class “who       in the world, contributing 2.3% of global economic output.
no longer have to worry about their vulnerability” live on       The report assessed economies based on purchasing power
USD4.50 to USD22.50 a day and have consumption patterns          parity (PPP) with Indonesia moving up 6 places and passing
starting to resemble those of a typical “middle class”.          more developed countries such as Canada, South Korea and
                                                                 Spain. The report found that middle income economies of
Controlled wage growth, provided accompanied by a
                                                                 Indonesia, China, India, Russia, Brazil and Mexico accounted
sustained improving employment outlook, should support
                                                                 for 32.3% of world GDP compared to a 32.9% contribution
“the Indonesian consumer story”. The large population
                                                                 of the six largest high income economies: USA, Japan,
and consumption base is a fundamental reason why many
                                                                 Germany, France, the UK and Italy. However based on Real
multinationals rank the country as the foreign investment
                                                                 GDP, the country ranks 16th with output of USD795 billion
destination of choice in South-east Asia. Comparisons of
                                                                 in 2014. Other observations referred to an uneven growth
Indonesia having the same economic growth and investment
                                                                 rate and widening gap between rich and poor, with real
potential as the “BRIC” countries are now not so relevant
                                                                 consumption rates in a selected 7 year period for the poorest
given the major economic downturns in Brazil and Russia and
                                                                 40% of households being just over 1% compared to nearly
slow down in China. India is the only remaining BRIC country
                                                                 6% for the richest 20%.
worthy of direct comparison. Indonesia is now being grouped
with Mexico, Nigeria and Turkey as one of the MINT countries. In terms of the financial sector, bank loans were the
                                                                equivalent of 26% of Indonesia’s GDP as at 3Q2013. This
Indonesia’s population grew at a rate of 15.8% from 2000
                                                                is similar to the Philippines, but low compared to China,
to reach 240 million in 2010 and was 250 million in 2014. It
                                                                Singapore, South Korea, Malaysia and Thailand where
is forecast to be 263 million by 2020. The Central Statistics
                                                                average debt to GDP in 2012 ran at 99% to 127%. India is
Agency (BPS) has estimated that between 2010 to 2035 the
                                                                51%. As at 3Q2014, Indonesia’s national debt was 34.8% of
country’s population will grow to over 305 million at 3 million
                                                                GDP.
per year. Another report refers to estimates of Indonesia’s
population exceeding the USA by 2043. The country is the
Investing in Indonesia - 2015 | 7

                                           2010      2013    2018E
Income and market size
Population (mn)                             243      251     263
GDP (Nominal, USD bn)                       709      868     1,657    World's largest economies
                                                                                                                                    In percent

GDP per head (USD)                          2,919    3,460   6,300     United States
                                                                               China
                                                                                                                                           17.1
                                                                                                                                           14.9

                                            401      485     964
                                                                                India                                                      6.4
Private consumption (USD bn)                                                   Japan                                                       4.8
                                                                            Germany                                                        3.7
Private consumption per head (USD)          1,650    1,930   3,660            Russia                                                       3.5
                                                                               Brazil                                                      3.1

GDP (International $ bn at PPP)             1,026    1,293   1,931            France
                                                                     United Kingdom
                                                                                                                                           2.6
                                                                                                                                           2.4
                                                                           Indonesia                                                       2.3
GDP per head (International $ at PPP)       4,220    5,160   7,340               Italy                                                     2.3
                                                                              Mexico                                                       2.1
Export of goods & services (USD bn)         175      206     371             Canada                                                        1.6
                                                                        South Korea                                                        1.6

Imports of goods & service (USD bn)         154      212     345               Spain
                                                                        Saudi Arabia
                                                                                                                                           1.6
                                                                                                                                           1.5
                                                                              Turkey                                                       1.5
Memorandum items                                                                 Iran                                                      1.4
                                                                            Australia                                                      1.1

Share of world populations (%)             4.15      4.16    4.18             Taiwan                                                       1

Share of world GDP (Nominal, %)            1.13      1.19    1.72
Share of world GDP (PPP, %)                1.35      1.46    1.63
Share of world exports of goods &          0.96      0.92    1.20
services (%)                                                          What happened in 2013?
                                                                      In 2013 the country’s strong key economic fundamentals
Source: The Economist Intelligence Unit, June 2014
                                                                      enabled it to ride out a temporary economic “blip” caused
                                                                      by a combination of declines in demand and pricing of key
 A historical perspective: 1997 - 2014                                commodity exports and further pressures on economic
                                                                      growth from a series of economic events and outcomes
 1997 Asian Economic Crisis and 2008 GFC                              that “collided”: lifting fuel subsidies and electricity tariffs,
 Following the 1997 Asian Economic Crisis, Indonesia                  resulting inflation and interest rate increases, weakening
 experienced a period of severe economic and political                of the IDR and pressures on unemployment. Bankers and
 instability that was compounded by the collapse of the               economists referred to this as a necessary correction to
 banking system, a function of unrestrained lending and               stabilize or “cool” what had been record economic growth
 other practices. Ten years later however, following a period         levels and a rapidly growing economy, the condition being a
 of political stability as well as sound economic and financial       temporary one supported by the country’s key, unchanged
 policy which lowered the national debt from 89% of GDP in            economic fundamentals. In November 2013 the World
 2000 to less than 30% in 2011, Indonesia was less affected           Bank gave Indonesia a “vote of confidence” on the basis
 by the GFC compared to many neighboring economies, its               the country “has what it takes to rise above the current
 resilience underpinned by strong domestic spending and               economic uncertainty”.
 relatively low dependence on exports which made up a small           A key outcome of 2013 was that the growing middle class,
 1.7% proportion of the country’s GDP.                                whose domestic consumption had been driving the greater
 An important factor underpinning the above is that the               part of economic growth, started to look a bit “fragile”. The
 Indonesian banking industry had become one of the most               Government sent clear messages that consumer spending
 open and tightly regulated in the world, having undergone            could no longer be relied on to achieve forecast economic
 dramatic transformation and consolidation. Following the             growth and GDP levels, with increases in FDI inflows
 Asian economic crisis, Indonesia liberated its banking system        needed. Industry commentators called for significant efforts
 as part of an IMF mandated structural adjustment reform,             to improve the investment climate if sustained economic
 where USD 39 billion was spent to bail out lenders.                  growth is to be achieved.
8 | Investing in Indonesia - 2015

2014 year in review: a snapshot

                           Inflation and exchange rate (2008 - 2015F)
                                       20                                                                                                   14,000
                                              18.2                                                                                    12,189
                                       18
                                                                                                                                            12,000
                                       16                            10,950
                            Percent

                                       14                                                        8,991                                          10,000
                                                             9,419                                                               9,670

                                                                                                                                                               IDR/USD
                                       12     9,020                                  9,400                       9,068                          8,000
                                       10
                                        8                                                 8.1                                                   6,000
                                                       8.3           8.3
                                        6                                                                                                       4,000
                                        4                                                                                                 5.4
                                                                                                4.4            4.3                              2,000
                                        2                                                                                      3.7
                                        0                                                                                                       -
                                         2008         2009       2010              2011     2012               2013       2014F          2015F
                                                          Inflation                   Exchange rate

                           Source : The Economist Intelligence Unit, June 2014

In 2014 we saw GDP growth slip to 5.1%, at its lowest                                      •    Administered price inflation increased in line with
levels since 2009, and a year characterized by continued                                        the lifting of fuel price subsidies, higher land freight
falling global commodity prices including oil, lifting of fuel                                  costs and increases in electricity tariffs to more
subsidies and electricity tariff increases, inflationary and                                    economic rates. Government structural reform policy
other upwards pressures on corporate cost structures, a                                         to reallocate the fuel subsidy to productive sectors
depreciating IDR and increasing costs of imported goods.                                        including infrastructure was designed to promote more
Despite further statutory increases in minimum wages,                                           sustainable economic growth. International oil prices
household consumption declined. Indonesia had entered a                                         dropping significantly (with the trend expected to
period through 2017 where economic growth was forecast                                          continue in 2015) favoured the Indonesian economy in
by the World Bank to be lower than in recent prior years. It                                    terms of balance of payments with the country a net
is relevant however that many of the world’s other emerging                                     importer of oil. International oil prices have fallen around
economies were also growing slower. In Indonesia:                                               50% since mid-June 2014.
•      An economic downswing in China and the resulting                                    •    Typically to keep inflationary pressures under control,
       trend in declining global commodity prices continued                                     interest rates rose. The BI (% period average) for 2015
       to adversely impact Indonesian exports: coal and palm                                    was forecast to be 7.22% at 31 March 2015, about the
       oil account for 60% of these. Declining international                                    same as the average rate of 7.54% in 2014.
       commodity prices in recent years is considered to be
                                                                                           •    Intense depreciation pressures on the IDR against the
       solid evidence of a break in the cycle of rising prices. A
                                                                                                USD occurred but relative to currencies in many other
       mineral export ban from January 2014 compounded the
                                                                                                South-east Asian countries, the rate of depreciation in
       problem.
                                                                                                2014 was low or otherwise in line.
                                                                                           •    Optimism around the new Government translated
                                                                                                to positive sentiment towards improving economic
                                                                                                fundamentals in 2015.

    Fuel Price

                                            2005                           2008                 2013                   2014                             2015

        IDR/litre         March                    October                 May                  June                 November            1 January                  19 January

    Gasoline                          2,400              4,500                    6,000                6,500                  8,500                 7,600                  6,600

    Diesel                            2,100              4,300                    5,500                5,500                  7,500                 7,250                  6,400

Source : Media reports
Investing in Indonesia - 2015 | 9
Average selling price of electricity by type of customers
IDR/kWh 2009 2010 2011 2012 2013
Residential 589 616 618 632 692
Industrial 644 661 695 710 796
Business 891 934 951 965 1,117
Social 578 624 646 678 757
Government office building 870 953 940 969 1,092
Public street lighting 663 746 792 803 911
Source : PLN Statistics 2013
Provincial minimum wages
in IDR ‘000 2010 2011 2012 2013 2014 2015
DKI Jakarta 1,118 1,290 1,529 2,200 2,441 2,700
Source : Directorate General of Industrial Relations and Social
In November 2014, 29 of the 34 provinces published new • BI has projected economic growth in a range of 5.4 –
regional minimum wages for 2015. The overall average 5.8% in 2015 and higher in the medium to longer term
Indonesian minimum wage increased 12.8% in 2015, a provided macroeconomic and financial system stability
lower rate of increase than 2014 of 19.10%. Each province is maintained.
sets a minimum wage taking into account assumed needs
• The Ministry of Finance expects inflation to be between
based on a Decent Living Index: see also Chapter 9 on
4.5 – 5% in 2015, compared to an annual inflation rate
Labor and Employment.
of 7.9% estimated by BI for 2014, and that Indonesia
Note that the minimum wages and Decent Living Indices can lift economic growth to 7% in 2016 providing no
were set prior to a 30% plus increase in fuel price on 18 unforeseen “turbulence” occurs for 2015.
November 2014 when the new government removed
The economic outlook as a whole is subject to potential
subsidies for petrol, allowing “prices at the pump” to follow
impacts of a number of factors referred to in this Chapter,
market crude oil price fluctuations. Whether wage levels
including an IDR that has weakened more rapidly relative
are actually in line with the real “cost of living” has been at
to most global currencies. A reasonable conclusion is
times hotly contested.
that the current outlook for 2015 could be considered as
challenging or “mixed”, with a longer term outlook more
positive underpinned by the power of optimism and positive
Outlook: 2015 and beyond
sentiment, notwithstanding the likehood of economic policy
Indonesia is not totally immune from spillovers from quirks and political “hiccups” along the way. Indonesia is
international developments through both financial and located in South-east Asia and the fastest growing of the
trade channels. Downside risks remain due to ongoing world’s three main regions, something that should hold it in
external uncertainties, including the extent and impact of good stead going forward.
the slowdowns in China’s and Japan’s economies and, to
a lesser degree, the ongoing recession in the Euro Area.
The “flip side” of the Euro recession is investors switching
attention from affected European countries to Indonesia.
Much of Indonesia’s historical growth has been built on
rising commodity prices and strong domestic consumption.
Whilst the manufacturing sector is growing, it still lags
behind Thailand, Malaysia, Brazil and Turkey in terms of size
and sophistication. Labor laws complicate doing business
and discourage value added, labor intensive manufacturing
and diversified industrials investments. Infrastructure is
inadequate:
• The World Bank has cut its projection for economic
growth in 2015 from 5.6 to 5.2%, has made reference
to 5.6% GDP growth in 2016.10 | Investing in Indonesia - 2015
Ease of doing business indicators Investment Rating
Indonesia ranked 100th out of 183 in a 2011 Transparency In 2012 Global rating agency Fitch Ratings upgraded the
International’s Corruption Perception Index. Excessive country’s sovereign debt to BBB- Investment Grade, an
bureaucracy and a lack of coordination at the ministerial achievement considered to augment Indonesia’s ability to
level was considered to be undermining the country’s attract foreign capital and also stabilize its debt market.
business environment. Also in 2011 World Bank and IFC
“Ease of doing business” and “Ease of starting a business”
measurements, Indonesia ranked 128th (behind Ethiopia) Investment Rating
and 155th out of 185 countries, well below East Asia &
Fitch Moody’s S&P
Pacific regional averages. On contract enforcement, the
country ranked 144th, tied with Malawi. AAA Aaa AAA
In the World Bank’s “Doing Business 2014” report Indonesia AA+ Aa1 AA+
ranked 120th out of 189 countries, up from 128th. The AA Aa2 AA
country continued to lag behind nearby developing AA- Aa3 AA-
countries PNG (113th), Pakistan (110th), Sri Lanka (85th)
and China (96th). Malaysia ranked 6th on the back of A+ A1 A+
ease of procedures for company registration and permits. A A2 A
Singapore ranked first, other South-east Asian countries A- A3 A-
included Thailand (18th), Vietnam (99th) and the Philippines
108th up from 138th. BBB+ Baa1 BBB+
BBB Baa2 BBB
According to the World Bank’s “Doing Business 2015”,
Indonesia is now ranked 114th out of 189 countries. BBB- Baa3 BBB-
Indonesia is ahead of only India, Brazil and Argentina of BB+ Ba1 BB+
the G20 nations, and in South-east Asia is behind Malaysia
BB Ba2 BB
(18th), Brunei Darussalam (101st), Vietnam (78th), the
Philippines (95th) as well as PNG. Again, a primary factor BB- Ba3 BB-
for Indonesia’s low ranking is difficulty in establishing and B+ B1 B+
starting a business against a backdrop of inefficiency and a
B B2 B
complicated and frustrating bureaucracy.
B- B3 B-
Investors establishing a company and business in Indonesia
need to undertake an average of 10 processes taking on
average around two months (52.5 days). The Asia Pacific Note : Indonesia current investment rating, June 2014
average is 34.4 days, countries like Singapore and Malaysia
running at less than 6 days. In Indonesia there is a need to Source: Fitch Ratings, Moody’s, Standard & Poors
have dealings with four different ministries and a range of
different business licenses, permits and certifications from:
1) Ministry of Law & Human Rights; 2) State Treasury; 3) In November 2014 Fitch Ratings confirmed Indonesia’s
Ministry of Trade; and 4) Ministry of Manpower. The long Sovereign Credit Rating at Investment Grade (BBB-/stable
awaited implementation of an on-line data base system and outlook) in recognition of Indonesia’s economic stability
“one-stop shop” at BKPM appears to have partly come to amid globally uncertain times: underpinning this was the
fruition, with the Indonesia Investment Coordinating Board government’s decision for macroeconomic stability over
(BKPM) announcing that effective 26 January 2015, it had higher economic growth. Further improved credit ratings
sealed arrangements with 22 Government ministers for are contingent on strengthening of the investment climate
all Foreign Investment or “PMA” Company licensing and which requires reducing dependency on commodity exports,
establishment to be made entirely by BKPM. increase FDI inflows and implementation of structural
reforms to promote infrastructure development, eradicating
The above and other similar indicators however do not or reducing bureaucratic red tape and aligning minimum
measure all aspects of a business environment that matter wage and productivity growth.
to companies and investors. Related discussion is in Chapter
6 on Business Structures and Establishment and Chapter
5 on Investment, as well as other chapters throughout this
publication.Investing in Indonesia - 2015 | 11
Population growth, mid-income trap and poverty
There is also however a lower and poor socio-economic Conversely, the huge population and domestic consumption
class that is growing alongside the middle class. The World base which is the platform for current economic growth and
Bank estimates that 200 million or 82% of Indonesia’s investment potential, is what makes Indonesia so attractive
population live on less than USD4 a day, with half of these to investors and one advantage of operating a business in
on USD2. In January 2015 the Central Statistic Agency (BPS) the country.
released the latest poverty data with 27.73 million people
Economist and media commentators have referred to three
or 11% of the population living below the poverty line as at
interrelated solutions:
September 2014. BPS defines “poor” as living on less than
IDR312,328 (USD25) a month. The World Bank sets a higher • Lower the population growth rate. Calls have been
internationally accepted standard of USD2 per day being made for more support to programs of the National
the average of the national poverty lines for all countries: if Population and Family Planning Board (BKKBN)
this is applied, as many as another 9 million people would • Faster economic growth
be added to the BPS number for Indonesia. As many as • Increase access to and quality of education, a typically
68 million vulnerable Indonesian people live just above the successful corrective action to lower population growth,
poverty line according to the World Bank. A commonly held but moreover create more employable human capital:
view is that poverty reduction is stagnating. refer further discussion in Chapter 9 on Labor and
Current and forecast population growth numbers were Employment
presented in Chapter 2. Indonesia needs human resources
or capital to develop the nation, however the unqualified and A World Bank report indicates that Indonesia needs
unemployable which the country has to feed are a strain economic growth of 8-9% to provide employment for an
on society. References are being made to risks around the estimated 15 million new workers coming on line by 2020
current 250 million population doubling by 2060, and the or Indonesians risk being caught in a “mid-income trap”,
challenges of providing food, education, health facilities and an emerging condition being reported in the media since
infrastructure for 500 million people. mid-2014 and characterized by per capita income below
USD12,000, low investment, slow manufacturing growth
and low industrial diversification.
Sources:
(1) KPMG Research and Intelligence (8) World Bank, “Doing Business in Indonesia 2014”, October 2013
(2) Central Statistic Agency (BPS) website: www.bps.go.id, February (9) World Bank, “Doing Business in Indonesia 2015”, October 2014
2015 (10) Fortune Magazine, “The New World of Business”, February 2015
(3) Economist Intelligence Unit (EIU) website: www.eiu.com, June (11) The Borneo Post, “Indonesia Year in Review 2014”, 17 January
2014 2015
(4) Fitch Ratings website: www.fitchratings.com , June 2014 (12) Perusahaan Listrik Negara (PLN), “Statistik PLN 2013”, June 2014
(5) Moody’s website: www.moodys.com, June 2014 (13) Directorate General of Industrial Relations & Social Security
(6) Standard & Poor’s websites: www.standardandpoors.com, June Workers website: www.naker.go.id, March 2015
2014 (14) Discussion with Securities House Economist: March 2015
(7) World Bank, “Indonesia: Avoiding the Trap”, June 2014 (15) BKPM “Monitoring Investment Climate in Indonesia”: Seminar 20
May 201512 | Investing in Indonesia - 2015
4. Infrastructure
Overview
Recognizing the pressing need for infrastructure development, Unless progress is made, this will be a major barrier to
the Indonesian government has increased its focus on sustained longer term economic growth and development
improving the regulatory environment and stimulating across many industries, as well as to foreign investment.
infrastructure spending. Over the past 5 years, infrastructure Indonesia’s low infrastructure ranking is consistently identified
spending has more than doubled, and more spending is by companies as a constraint on their operations and
expected over the next few years with the removal of the fuel investment.
subsidy allowing reallocation of funds to infrastructure.
Indonesia infrastructure
Indonesia has a huge task ahead. The World Economic Forum
ranks Indonesia’s infrastructure as 72nd out of 144 countries, Road 508,000 kilometres of which 56.7% is paved
and 4th in the ASEAN region, below Singapore, Malaysia and network
Thailand. Toll Roads • 820.2 kilometres (operated)
• 936.4 kilometres (construction/land
acquisition)
Infrastructure 5 20 76 72 95 112
• 334.4 kilometres (tender preparation/
process)
Road 6 19 50 72 87 104
Railway N/A 12 74 41 80 52
Railway 5,107.8 kilometres, of which 235 kilometres
network are electrified
Port 2 19 54 77 101 88
Airport 1 19 37 64 108 87
Air 296 airports, of which 27 are international
airports
Power 6 39 58 84 87 88
5 airports > 3,001 m runway
Maritime 111 ports managed under Pelindo I-IV with
Infrastructure spending in Indonesia (both public and private) 436.5 million ton/m3 loading/unloading
remained subdued following the 1997 Asian economic crisis.
Clean water • 350 regional water supply companies
As a result, Indonesia has poor basic infrastructure and
(PDAMs)
remains under-invested, holding back not only Indonesia’s
• 39 non-regional water supply (non-PDAM)
growth potential but also progress in poverty reduction. The
of which 18 are limited liability companies
symptoms of close to two decades of limited infrastructure
• 3,347 million m3 clean water production
investment include increasing road congestion, over utilized
per year.
airports, weak rail connectivity, an underdeveloped port
• 20-40% Non-Revenue Water
sector, high inter-island cargo costs, electricity blackouts and
poor access to improved sanitation. Population pressures Power • 82% electrification ratio
and strong foreign interest in Indonesian commodities give • 49.7 GW/year of which 16% is installed by
rise to a significant need for infrastructure development in IPP
the country. • 41,749 kmc transmission lines
• 878,926 kmc distribution linesInvesting in Indonesia - 2015 | 13
Road network and toll roads quality of track, e.g., double-tracking of the southern rail
line from Jakarta to Surabaya; and connectivity through its
Indonesia’s road network amounts to 508,000km, of
“Trans-rail” projects for Java, Sumatra, Sulawesi, Kalimantan
which 287,926km (56.7%) are paved or sealed and 820km
and Irian Jaya.
are operational toll roads. It is estimated that 90% of all
domestic passenger transport and 50% of cargo traffic is
carried by road. Indonesia has experienced a rapid increase
Air
in the numbers of cars in circulation, with virtually no major
investment in toll and other road infrastructure. The rise of In February 2015, there were 296 airports, of which 27 are
the Indonesian economy over the past decade has boosted international airports, and 5 airports have runways of more
the number of vehicles by 13.7% (two wheel) / 9.6% (four than 3,001m; operated by Angkasa Pura I, Angkasa Pura II
wheel) % p.a. (CAGR) vs. a 2.9% p.a. growth of paved roads. and the Directorate General for Aviation.
The road network is most developed on the islands and main Key annual statistics include, 173 million passengers,
population centres of Java, Sumatra and Bali where over 1,160,818 tons of cargo, and 1.7 million aircraft movements
80% of Indonesia’s population live. Mining-related transport both domestic and international. The growth rate of
(road, rail) infrastructure is more developed in Kalimantan passengers, cargo and aircraft movements over the past
compared to Sumatra. 5 years were 13.7%, 10%, and 11% p.a. respectively. To
keep up with the demand, new airports are expected to be
Despite being given a high priority in government spending
constructed (either privately or by AP I/II). Both AP I and II
programs, road building in Indonesia has progressed at a
have successfully built and expanded some of the major
slow pace due mainly to land acquisition challenges. Only
airports in Indonesia such as Kualanamu International Airport
135km of new toll roads have been developed since 1997-
(Medan), which began operations in March 2013, Sultan
98, although a further 936.4km of new toll roads are being
Hasanuddin International Airport (Makassar), Sepinggan
constructed or are in progress of design and land acquisition.
International Airport (East Kalimantan), and Ngurah Rai
Land acquisition challenges are commented on overleaf.
International Airport (Bali).
Toll road traffic volume has climbed around 7% over the past
7 years based on the 576km operated by PT Jasa Marga
(Persero). A further 244km are operated privately through Toll Maritime
Road Concession Agreements awarded/supervised by the
As an archipelago comprising more than 17,000 islands,
Toll Road Regulatory Agency (BPJT).
covering an area of over 2 million square kilometers astride
The Government has plans to build 4,621km of additional toll the main trade routes between the Indian Ocean and the
roads, of which 60% are on Sumatera Island as part of its Pacific Ocean, air and maritime connections are vital to
Trans Java and Trans Sumatra highway program. Indonesia and its economy. There are 21,579km of navigable
waterways among the larger islands that represent over
90% of Indonesia’s land, Sumatra, Java, Madura, Kalimantan,
Railway network Sulawesi and Irian Jaya.
The railway system covers 5,107.8km, all of which is narrow There are 111 ports operated by the state-owned port
gauge; and 235km of which is electrified. corporations, Pelindo I, II, III, and IV under KM 17/2004 and
534 ports managed by the government under KM 63/2002.
Most of the Indonesian rail network is operated by the
Of these 645 ports 4 are classified as “Prime” (Jakarta,
state-owned enterprise/PT Kereta Api (Persero), while
Surabaya, Medan and Makassar) and 14 are classified as
some freight railways are privately owned and operated in
“Class I” including Semarang and Banjarmasin. Prime
Sumatera and Kalimantan. 220 million people and 27 million
and Class I ports are defined as suitable for international
tonnes of cargo (of which 60% is coal) travel by rail each
shipping. The country’s largest port, Tanjung Priok, in North
year on Sumatera and Java Islands. The development rate
Jakarta, is expected to complete the building of Terminal 1
of rail tracks over the past 5 years was 1.52% vs 1.57% for
of its Phase I expansion program, in the first half of 2015,
passenger movements. Recognizing the importance of rail
increasing maximum draft from 11.5m to 16m and expanding
transport, the Government’s plans include improving the
its cargo handling capacity to 6.5 milion TEU p.a.14 | Investing in Indonesia - 2015
In 2013, marine fleets operating in Indonesia amounted Power
to 17,838 vessels, consisting of 13,120 national vessels,
Growth in the demand for electricity over the next ten years
354 foreign chartered vessels and 4,364 foreign agency
is estimated 8.7% p.a., from 219.1TWh in 2014 to 464.2TWh
vessels. The average growth rate of container handling by
in 2024. As of mid-2014, Indonesia’s electrification ratio
terminal yards in Indonesia handled by Pelindo I - IV ports
was 82%, above the Philippines (70%) but below Malaysia
corporations was 35% over the past 5 years. The new
(100%), Thailand (99%) and Vietnam (96%), although some
President, who made his acceptance speech on a traditional
progress has been made since 2008 (62% electrification
sailing ship in Sunda Kelapa harbor, Jakarta’s historical
ratio). The slow progress of the Government’s Fast Track
trading port, has stated that the target of Tanjung Priok port
Program (FTP) I and II is one of the main reasons for the
in 2017 is approximately 15 million TEUs a year. In addition,
low electrification ratio. FTP I and II were enacted through
the new Government is expected to improve and build 24
Presidential Regulations in 2006 and 2010. The new
seaports and deep seaports as the main component of the
Government has introduced a new 35GW program as part of
“sea toll road” that is one of the main priorities of the new
its total target for the next five years, of which 24.9GW will
Government.
be awarded as IPPs.
Tonnage through Indonesian ports amounted to 71,915,789
The progress of FTP I (10,000 MW) was estimated at around
DWT in 2013, having dropped an average 13.6% p.a. since
77% as of November 2014 since its enactment in 2006.
2009. This decrease was due to a decrease in international
Most of the delays were caused by contractor performance
cargo: with domestic cargo growing by 10.9% p.a. over the
and permit and land acquisition issues, despite irrevocable
same period.
and unconditional guarantees on loans (both interest and
Indonesian ports are among the least efficient in South-east principle) for FTP I provided by the Government. As part
Asia in terms of lead times, which are 3 days compared of a strategy to reduce two step loans and in accordance
to those of most ASEAN countries, which are only 1 day. with Presidential Regulation No. 48/2011, the Government
Logistics costs from factories to Tanjung Priok ports) for is required to provide business viability guarantee letters
a 40ft dry container is USD 579: far higher than logistics (“BVGLs”) on FTP II projects. However, FTP II progress
costs from factories in Myanmar to port, which are USD is also slow due to projects struggling in their preparation
323, Cambodia is in the same range. Corresponding costs in stage. For FTP II (17,458MW), under Presidential Regulation
Vietnam are lower again at USD 237. No. 48/2011 revised by Minister of Energy and Minerals
Resources Regulation No. 21/2013, PLN is responsible for
investing in 32% of capacity with the remaining 68% to be
Clean water available through public bidding by experienced and proven
IPP investors under BOT/BOOT/BLT and lease schemes. PLN
Installed capacity of the 350 Regional Water Companies
(a Fortune 500 company) is the main off-taker for the power
(with USD 1.3 Billion of total assets) is 159,043.5 l/s (litres
industry.
per second) and produce 117,225 l/s for only 55 million
people in their serviced areas, which contain an estimated There are 40 IPPs in operation (7,743 MW) and 173 (9,584
140 million people. That means only 40% of the population MW) under development, mainly in Java and Sumatra with
have direct access to clean water. Although there are 8.3 coal as the main fuel source. PLN planning is being updated
million water connections in Indonesia, half of Regional for a 35GW fast track program with an estimated US$62.8
Water Companies are not considered as being in a “healthy” billion of investment needed over the next 10 years.
condition. In addition to that, 70% of Regional Water
Equally important, transmission and distribution grids need
Companies do not apply Full Cost Recovery (FCR), which
to be well prepared and developed. To balance generator
makes it difficult for the industry to improve profitability
construction, PLN estimates that 59,000kmc of transmission
performance. In addition, only 32 Regional Water Companies
and 164,400kmc distribution grids will be required, with
have a Non-Revenue Water ratio below 20%
estimated costs of USD20.6 billion and USD14.5 billion,
The average tariff of the 350 Regional Water Companies respectively.
is estimated to be around IDR 3,273/m3 and their average
cost of goods sold excluding depreciation and interest is
estimated at IDR 3,099/m3, which results in an operating
surplus of only IDR 174/m3. Water tariffs need to use a FCR
mechanism both for the 350 Regional Water Companies and
the non-Regional Water Companies.Investing in Indonesia - 2015 | 15
Land acquisition is the key challenge underpinning comprises IDR 4,012 trillion (USD 440 billion) of investment,
progress with IDR 1,786 trillion or USD 196 billion assigned for basic
infrastructure and substantial investments planned for roads,
The lack of clear regulations on land acquisition for public
railways, ports and power plants.
use and the provision of land compensation to owners have
caused delays to toll road and other infrastructure projects. Under Indonesia’s national medium-term development plan
There has been a long history of informal land ownership in for 2015-2019, infrastructure investment has been targeted
Indonesia that gives rise to any number of individuals claiming as requiring up to USD 550 billion for the economy to grow
the rights to the land during the land acquisition process. The at its full potential. One fifth is allocated to roads/toll roads,
implication of this is the need for an administrative process around USD 107 billion is part of a connectivity program
involving a number of government institutions to resolve land covering railways, mass transportation, sea transportation and
ownership issues, which is problematic. to support airline industry by added more airports. Meanwhile,
gas, energy, power, clean water, waste management and
Another frequent issue encountered is land owners holding on
information technology investment is estimated at around
to their land as long as possible to benefit from appreciation in
USD 258.7 billion. Government/regional budgets are expected
value while a project progresses, which has led to unexpected
to fund 22%, and 78% is being sought from State Own
land cost escalation. Property prices in Indonesia and
Enterprises (SOE), public private partnerships, off balance
especially Java and Jakarta are increasing at a rapid rate.
sheet financing, loans and obligations.
Land acquisition issues have been one of the main obstacles
As indicated, more infrastructure spending is expected over
for infrastructure projects in Indonesia. Enactment of
the next few years to fill the 22% gap of RPJMN targets.
Presidential Regulation No.36/2005 concerning Land
Acquisition for Infrastructure Development was intended to
outline the rules and procedures for infrastructure projects Government institutions
serving public purposes. However, the regulation was not In September 2012, the World Bank approved a new project
effective due to vagueness in the rules. to support the newly established Indonesian Infrastructure
Guarantee Fund (“IIGF”), an institution under the Ministry
The Government has enacted Law No.2/2012 concerning Land
of Finance (“MOF”) responsible for providing guarantees for
Procurement for Development Purposes in Public Interest to
infrastructure projects, or more specifically Public-Private-
improve and put clarity around the land acquisition framework.
Partnership (“PPP”) projects. With the World Bank’s support,
However, for the Law to be practical, a Presidential Regulation
IIGF will be able to provide guarantees to leverage private
elaborating on the law was required. “Presidential Regulation
investments in infrastructure projects such as toll roads,
No.71/2012 concerning Administration of Land Procurement
bridges, railroads, irrigation canals, wastewater infrastructure,
for Development Purposes in Public Interest” was issued
telecommunication towers and power generators, among
on 7 August 2012 and subsequently, in the first week of
other undertakings.
November 2012, Regulation of BPN No.5/2012 was issued,
which sets out technical implementation guidelines and rules. PT Sarana Multi Infrastruktur (SMI) was established in 2009
There is anticipation, now that these regulatory developments to accelerate infrastructure development in Indonesia.
have occurred, that the prospects of progress being made The role of SMI is to become a catalyst in the acceleration
and additional private funding flows being achieved will be of infrastructure development in Indonesia, to provide
improved. alternative sources of project financing by working with
stakeholders to obtain appropriate financing solutions,
to promote PPPs in financing infrastructure projects in
“Indonesia to ramp up infrastructure” Indonesia and to increase the size and capacity of SMI
through partnerships with third parties.
Expenditure plans
Recognizing the pressing need for infrastructure development, The Indonesia Infrastructure Fund (IIF) was established as
the Indonesian government has increased its focus on part of the government’s 100-day Priority Program. IIF is an
improving the regulatory environment and stimulating infrastructure financing company, majority privately owned,
infrastructure spending. Whether this can be achieved or not with initial shareholders being the Asian Development Bank
is open to discussion but what is certain is that long lead (“ADB“), International Finance Corporation (“IFC”), Deutsche
times are involved. Indonesia’s 2011-2025 Development plan Investitions-und Entwicklungsgesellschaft mbH (“DEG”) and
PT SMI.
Sources:
(1) KPMG Research and Intelligence
(2) World Economic Forum 2014-15 and Logistic Performance Index 2014: Indonesia, World Bank
(3) Ministry of Public Work, Bappenas, Ministry of Finance, Statistic Indonesia, Ministry of Transportation, Ministry of Energy and Mineral
Resources, and PT PLN (Persero)16 | Investing in Indonesia - 2015
5. Investment
Introduction generally held around 65-70% of the free-float value of the
Indonesian equity market. At 31 December 2014, the foreign
Indonesia welcomes foreign investment on its own terms.
portfolio ownership was 72.1% of the Total Free Float Value
Government policies aim at ensuring that foreigners work
of the Jakarta Composite Index (JCI).
with Indonesians to assist in development of the country’s
economy and skill-base. There is a general recognition that The Indonesian government encourages Direct investment by
Indonesia needs the development capital, and the technical foreigners or Foreign Direct Investment (“FDI”) in most areas
and management skills of foreigners. of the Indonesian economy, and less so in others. Foreign
investment approvals can be issued either by BKPM in Jakarta
Government regulation of foreign investment in Indonesia is
or an Investment Board (BPM) in every Province, Investment
manifested in a variety of ways, for example:
Institution in Regency Municipality or through Representative
• approved and monitored through governmental bodies Offices of the Republic of Indonesia in several countries.
• companies can employ only a limited number of
expatriates, and are required to demonstrate plans for
replacement of Investment Law, Negative List and FDI
• those expatriates by Indonesians (with the exception of The Investment Law regulates FDI by granting a right of
expatriate directors and commissioners) entry to foreign businesses through a government licensing
• certain fields of business are closed to investment by procedure principally controlled by BKPM. It specifies that
foreigners foreign investment shall be in the form of a limited liability
• foreign individuals are permitted to acquire land or land PMA Company incorporated in Indonesia, in which the
rights with a number of restrictions. investor goes into partnership with an Indonesian person or
entity as shareholders. Foreign investors can hold between
A “foreign investor” is usually a foreign company 30% to 95% ownership in various industries or even up to
incorporated under the laws of its host nation; however 100%, but this varies within sectors and business fields.
foreign individuals are also acceptable.
Foreigners are permitted to invest with no restriction on
the maximum size of the investment, the source of funds
or whether the products are destined for export or for the
Direct and Indirect investment
domestic market. This is except in an industry sector which
Law No.25/2007 concerning Capital Investment is listed as closed to foreign investment on the Negative
(“Investment Law”) defines investment as Direct investment Investment List (“Negative List”) which attaches to the
and Indirect investment. Indirect investments, also known Investment Law under Presidential Regulation. The principal
as Portfolio investments, are transactions made through the starting position (not always the case in practice) is that all
domestic capital market/stock exchanges of a country. The industry or fields of business are open to foreign investment
Indonesian equity market is highly institutionalized, whereby unless mentioned otherwise in the Negative List. This is
over the period from 2002 to 2014 foreign institutions provided that certain conditions are fulfilled and foreign
investment in an industry is not also regulated in Ministerial
or other laws, regulations and decrees.You can also read