MBA Forecast Commentary: November 19, 2020 - Mortgage Bankers ...
←
→
Page content transcription
If your browser does not render page correctly, please read the page content below
MBA Forecast Commentary: November 19, 2020
Mike Fratantoni, Joel Kan

Housing Market Healthy Going Into 2021
As the US economy continues to recover from recession in the first half of 2020, the housing market
remains one of the brightest spots. From new construction to home sales to mortgage applications,
housing market data show strong growth as we approach the end of the year and think ahead to 2021.

Existing home sales are running at a pace not seen since 2005, housing starts are at their fastest pace
since 2007, and mortgage rates are at records lows. As a result, purchase mortgage originations not only
turned around remarkably in the summer of 2020 but are now expected to rise to a record $1.59T in
2021, which would eclipse the previous all‐time high of $1.51 trillion in 2005. We anticipate refinance
originations will slow next year, decreasing to $971B after an almost $2T year in 2020. The rapid pace of
refinance activity in 2020 will spill over into the first half of 2021, but we expect a rather abrupt slowing
in refinances in the second half of the year as mortgage rates are expected to rise to almost 3.5 percent
in 2021, driven by increasing Treasury rates as the federal budget deficit remains abnormally high,
economic growth stays in positive territory, and the job market continues to recover. Overall mortgage
originations in 2021 are expected to fall to around $2.56T, but this would still be the second‐highest
total in the past 15 years.

After a full year contraction of around 2.5 percent in 2020, the economy is expected to rebound in 2021
and grow 3 percent. After a 31 percent decline in the second quarter and a 33 percent rebound in the
third quarter, the level of output remains lower than where it was pre‐pandemic, as sectors such as
leisure and hospitality and education struggle to bounce back. The level of payroll employment for the
US exhibited a similar trend – a sharp drop in March and April followed by an almost as steep rebound,
but overall employment levels are still about 6 percent below January and February levels. The
unemployment rate has come down dramatically from over 14 percent in April to 6.9 percent in
October, and is expected to improve further, and reaching the 5 percent mark by the end of 2021. As we
expressed in previous months, the shape of this recovery hinges significantly on the course of the
pandemic as well as how well and how quickly an effective vaccine can be distributed.

This would allow a more complete recovery in those hardest hit sectors of the economy and help many
of those unemployed workers to regain employment. However, this will not only depend on how

                                                                                                            1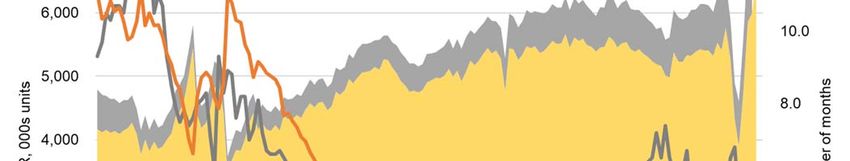
businesses adapt to the changing economy, but also if improvement in the public health situation allows
for less restricted economic activity again.

In light of the current conditions, the Federal Reserve has loudly and clearly committed to keeping short‐
term rates at the lower bound for the foreseeable future. There does not seem to be anything in respect
to current economic data, or expectations regarding the impact from the election, that changes their
plans. However, the Fed has been somewhat less clear regarding their plans of continuing to add U.S.
Treasuries and MBS to their balance sheet. Their most recent statement reiterated a commitment to
keep the paces of these asset purchases at current levels ‘over coming months’, but it did not provide
guideposts that could lead to changes in the pace. These purchases are certainly contributing to record‐
low mortgage rates, which have enabled an enormous refinance wave, as well as supporting a strong
housing market.

Job growth was much stronger than anticipated in October, with private sector payrolls up by more than
900,000. Total employment remains 6.6 percent below the level in February and indicates just how far
we still have to go to reattain full employment. Some of the largest job gains this month were in those
sectors hardest hit by the pandemic: leisure and hospitality, and retail trade. However, these sectors still
have employment that is 4 million below February’s level. Government employment declined due to the
conclusion of the decennial U.S. Census count, and the continued job losses occurring in local education
jobs. The sharp decline in the unemployment rate this month occurred despite the fact that the labor
force participation rate increased. It remains about 1.5 percentage points below February’s level.

While the U‐6 and other measures of underemployment remain quite elevated, they are declining
almost as quickly as the headline rate. That said, there was an increase in the number of workers with
part‐time spots who wanted full‐time work, an indication that people are making tough choices to go
back to work because enhanced unemployment insurance benefits have ended. While the number of
works who are temporarily laid off declined, it is still almost triple the historical average, and we have
seen the number of permanent layoffs remain close to its highest level since 2013. Once again, the
degree to which the job market can recover will depend on the pandemic situation and how quickly
these workers are able to return to work or if there will be deeper scarring for both industry sectors and
household finances.

As mentioned earlier, the housing market is one segment of the economy that continues to thrive.
Housing starts increased for the second straight month to a seasonally adjusted annual pace of 1.53
million starts – the highest since this February. Most notably for the housing market’s continued supply
shortages, the pace was driven by 1.179 million single‐family starts. Single‐family construction has now
increased for six consecutive months and is at the highest level since 2007. The rise in construction is in
line with other data on homebuilder confidence and should help to alleviate the supply and demand
imbalances seen in most parts of the country. To be clear, this pace is likely still insufficient given that
we faced an inventory shortage even before the pandemic, but this increased production is certainly
helping.

                                                                                                               2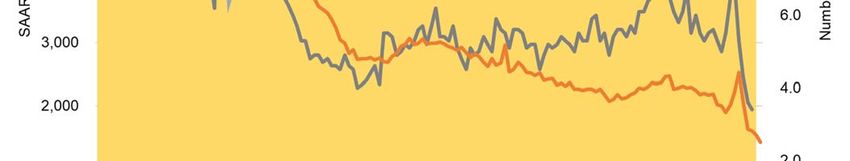
October existing‐home sales increased for the fifth consecutive month, reinforcing the remarkable
strength in the housing market seen this year. The 6.85 million unit sales pace was the highest since
November 2005, and on an annual basis, sales were up a robust 26.6 percent. The housing market has
only strengthened since the pandemic‐induced lows in the spring. MBA’s mortgage application data
show similar trends, with early signs that the increase in sales will continue. Purchase applications have
now increased year‐over‐year for more than six months, with eight of the past nine weeks showing
growth of more than 20 percent.

Turning to mortgage forbearance, the total number of loans in forbearance has decreased for 11 weeks
in a row to 5.47 percent of all loans serviced, as of November 8, 2020, a 20‐basis‐point improvement
from the week before, and well down from the peak of over 8 percent. According to our forbearance
survey estimates, 2.7 million homeowners are currently in forbearance plans. This continued to vary by
investor type, as the share of Fannie Mae and Freddie Mac loans in forbearance dropped 13 basis points
to 3.36 percent, Ginnie Mae loans in forbearance decreased 25 basis points to 7.70 percent, and the
forbearance share for portfolio loans and private‐label securities (PLS) decreased by 32 basis points to
8.38 percent. There was a significant increase in the rate of forbearance exits, which led to the past
week’s declines, particularly for portfolio and PLS loans. More than 76 percent of borrowers in
forbearance are now in an extension, as we are well past the six‐month point for most borrowers’
forbearance plans.

Our National Delinquency Survey for the third quarter of 2020 showed a decrease in the mortgage
delinquency rate, driven by a sharp decline in newer 30‐day delinquencies and 60‐day delinquencies,
however, the 90‐day delinquency rate continued to rise and reached its highest level since the second
quarter of 2010. With forbearance plans still active and foreclosure moratoriums in place until at least
the end of the year, many borrowers experiencing longer‐term distress will remain in this delinquency
category until a loss mitigation resolution is available.

According to Marina Walsh, CMB, MBA’s Vice President of Industry Analysis, “There are no guarantees
that last quarter’s improvement in the delinquency rate will continue. Recent actions to combat another
wave of COVID‐19 cases could slow or halt the recovery in some sectors – particularly the service
industries – and the passage of another stimulus package is still uncertain.” Certain homeowners,
particularly those with FHA and VA loans, continue to be disproportionately impacted by the pandemic‐
driven crisis, since many of these borrowers are likely to have jobs in the hardest hit sectors. The FHA
delinquency rate dropped slightly in the third quarter but was still at its second‐highest rate in the
survey. Furthermore, the FHA seriously delinquent rate – the percentage of loans that are 90 days or
more past due or in the process of foreclosure – reached a survey‐high 10.76 percent.

Our November forecast includes a strong pace of single‐family starts next year, which should provide
sufficient inventory to support a faster pace of home sales, albeit still with solid home‐price growth.
Combined, these trends will lead to a record year of purchase originations in 2021. We are currently
forecasting $3.39T in 2020, an upward revision from the $3.175T forecasted in October. Overall volume
of $3.39T is a 50 percent increase from 2019 ($2.25T) and the highest since 2003 ($3.81T). As we
                                                                                                             3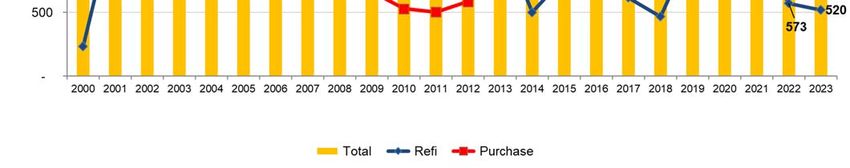
received stronger than expected incoming data, Q3 2020 total origination volume was revised from
$860B to $962B, and Q4 2020 from $824B to $937B. For 2020, given these revisions, refinance
originations are expected to jump 91.5% in 2020 to $1.97T – highest since 2003 ($2.53T). With rebound
in home sales and mortgage applications seen thus far, we expect purchase originations in 2020 to
increase 16 percent to $1.42T – highest since 2005 ($1.51T). Mortgage rates are expected to end 2020
at 2.9% as Treasury rates have stayed below 1 percent and mortgage to Treasury spreads show signs of
narrowing. With the economic growth and expected stimulus spending in 2021, we forecast the
mortgage rate to increase to 3.3 percent by Q4 2021.
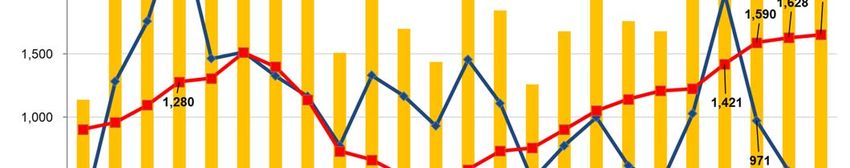
Figure 1.
2019 2020 2021 2022 2023
GDP Growth 2.3% -2.5% 3.0% 2.0% 1.9%
Inflation 1.8% 1.4% 2.8% 2.3% 2.5%
Unemployment 3.7% 8.1% 5.5% 4.6% 4.6%
Fed Funds 1.625% 0.125% 0.125% 0.125% 0.625%
10-year Treasury 1.8% 0.9% 1.4% 1.9% 2.4%
30-year Mortgage 3.7% 2.9% 3.3% 3.6% 4.1%
New home sales (000s) 685 839 960 980 997
Existing home sales (000s) 5,331 5,584 6,208 6,260 6,259
Purchase originations ($B) 1,225 1,421 1,590 1,628 1,653
Refi originations ($ B) 1,028 1,969 971 573 520
Total originations ($B) 2,253 3,390 2,561 2,201 2,173
Source: MBA Forecast
4Figure 2.
Source: MBA Forecast
5Figure 3.
Source: Bureau of Labor Statistics
6Figure 4.
Source: Census, National Association of Home Builders
7Figure 5.
Source: Census, National Association of Realtors
8You can also read