Update on the Kansas Economy & Tax Policy - Kansas Governor

Page created by Nicholas Dunn
 
CONTINUE READING
Update on the Kansas Economy & Tax Policy - Kansas Governor
Update on the Kansas
     Economy & Tax Policy
                                        Donna K. Ginther
                   Roy A. Roberts Distinguished Professor of Economics
            Director, Institute for Policy & Social Research, University of Kansas
                Research Associate, National Bureau of Economic Research

April 2, 2021
Update on the Kansas Economy & Tax Policy - Kansas Governor
Overview

      • Update on COVID-19 in Kansas and the United States
      • What’s happened to the US & Kansas economies so
        far?
      • The effect of COVID on Women’s employment
      • Distributional Impact of SB-50

2   Donna K. Ginther, PhD
Update on the Kansas Economy & Tax Policy - Kansas Governor
We Have Exceeded 30.5 Million Cases &
                           553,000 Deaths
                                                     • In the past week we’ve
                                                       averaged 68,182 cases
                                                       per day.
                                                     • This is an increase of
                                                       17% compared in the last
                                                       two weeks.
                                                     • 1,138 deaths on April 1st
                                                     • Cases are beginning to
                                                       rise again.

3   Donna K. Ginther, PhD   Source: New York Times
Update on the Kansas Economy & Tax Policy - Kansas Governor
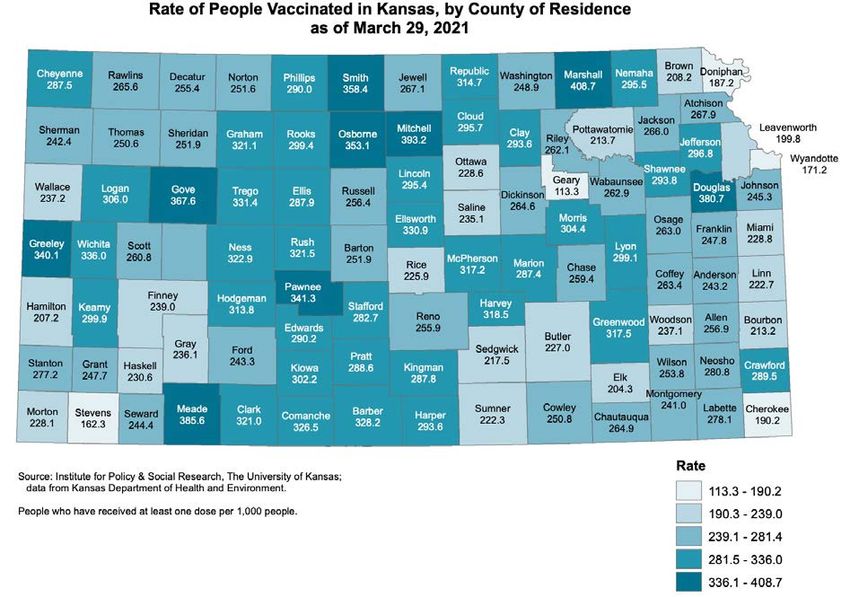
Kansas Daily Cases Are Decreasing
                                             • The 7-day moving average
                                               of new cases trended down
                                               in the past weeks.
                                             • Cases are decreasing:
                                                 • Cases are forecast to
                                                   increase.
                                             • Kansas has had 304,179
                                               cases and 4,902 deaths

4   Donna K. Ginther, PhD
Update on the Kansas Economy & Tax Policy - Kansas Governor
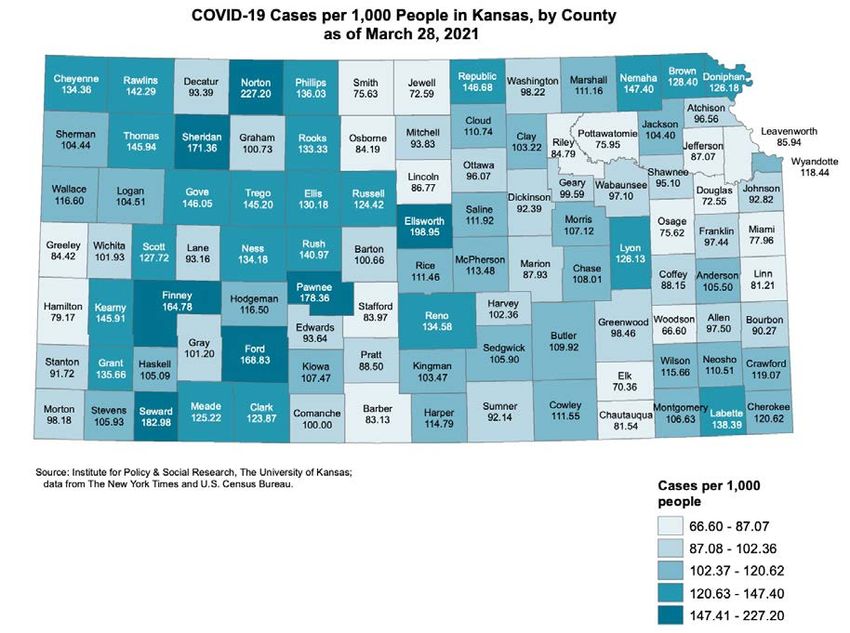
Case Rates by County
                                               • Darker colors indicate that
                                                 these counties have
                                                 higher case rates:
                                                  • Ford, Seward, and Finney
                                                    Counties have case rates
                                                    that are > 164 per 1,000
                                                  • Douglas, Sedgwick &
                                                    Johnson Counties have case
                                                    rates of 72–106 per 1,000
                                                  • Leavenworth & Wyandotte
                                                    Counties have case rates of
                                                    86–118 per 1,000

Source: New York Times & US Census Bureau
Update on the Kansas Economy & Tax Policy - Kansas Governor
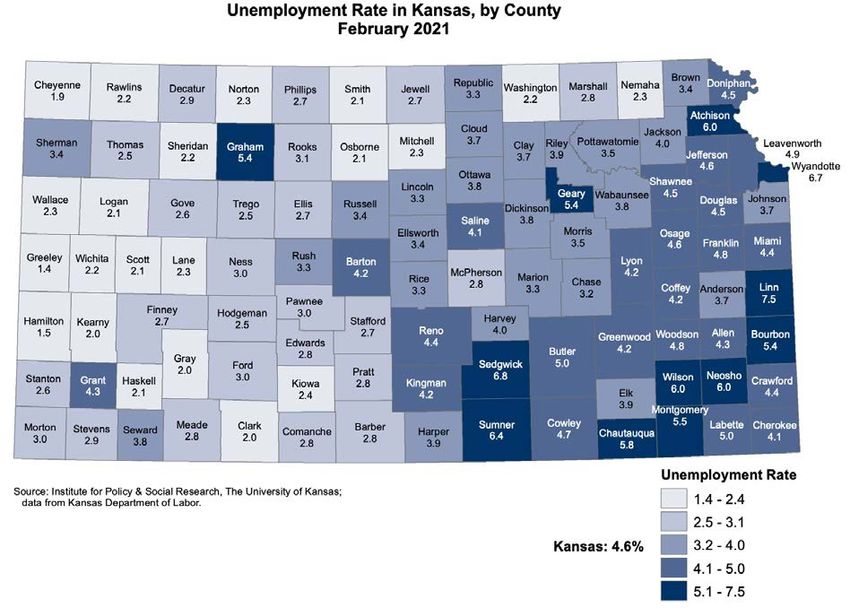
Covid Vaccines per 100 People per County

                                   • 26.7% of Kansas
                                     population has received at
                                     least one shot.
                                   • 78% of vaccine has been
                                     used
                                   • Darker colors indicate that
                                     these counties have more
                                     vaccine per population:
                                      • Uneven distribution of the
                                       vaccine.

Source: KDHE
Update on the Kansas Economy & Tax Policy - Kansas Governor
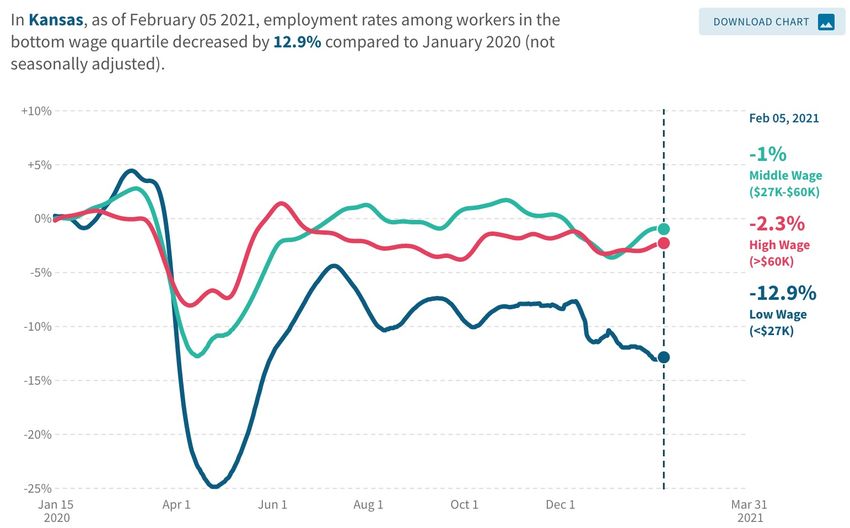
COVID Cases are Likely Underreported
                                      • Dots indicate COVID
                                        Genes per day in
                                        Lawrence wastewater.
                                      • Green line is 14 day
                                        average of reported
                                        cases.
                                      • COVID genes are still
                                        high but reported cases
                                        are falling.
                                      • Why is that?

Source: City of Lawrence
Update on the Kansas Economy & Tax Policy - Kansas Governor
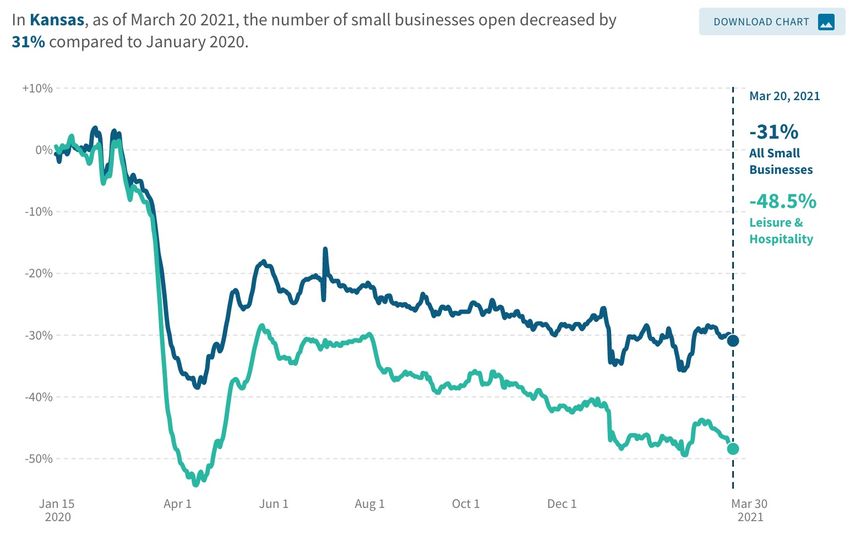
Kansas has Stopped Testing

         •   Testing has been falling in Kansas since Jan. 1, even though
             hospitalizations were at their highest level of the pandemic
             then, according to Tami Gurley, co-chair of the virus task force
             at the University of Kansas Medical Center. The state is now
             doing fewer tests relative to its population than any state
             except Idaho.

Source: https://www.nytimes.com/2021/04/01/us/coronavirus-testing-declines.html
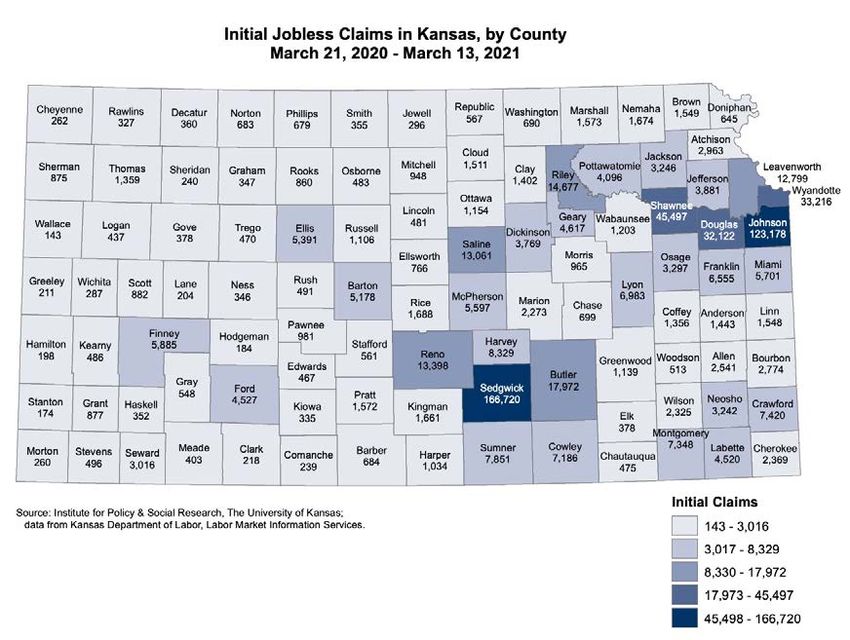
Update on the Kansas Economy & Tax Policy - Kansas Governor
COVID-19 and the
US & Kansas Economies
      A Stalling Recovery
Update on the Kansas Economy & Tax Policy - Kansas Governor
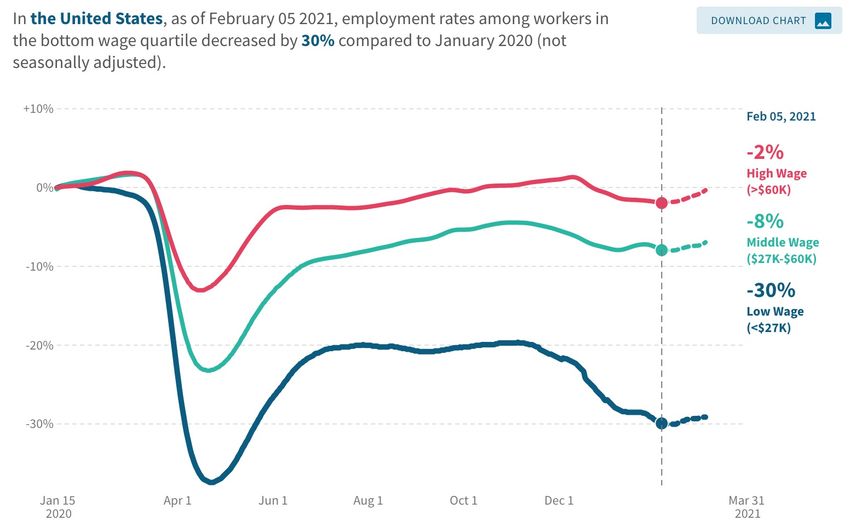
US Gross Domestic Product & Consumption Annual Rate

                                                                                      • Gross Domestic Product
                                                                                        was still down 2.4%
                                                                                        from a year ago in Q4.
                                                                                      • Consumption was down
                                                                                        2.7% in Q4.
                                                                                      • GDP grew 1.1% in Q4
                                                                                        compared to Q3.

10   Donna K. Ginther, PhD   Source: Lewis, FRED, Federal Reserve Bank of St. Louis
Industrial Production & Retail Sales in February

                                                                   •   Compared to a year ago,
                                                                       retail sales are up 4.2%.
                                                                   •   Compared to a year ago,
                                                                       industrial production is down
                                                                       4.2%.
                                                                   •   Although sales have
                                                                       recovered, production has
                                                                       not.

11   Donna K. Ginther, PhD   Source: https://fred.stlouisfed.org
US & Kansas Gross Domestic Product

                                                                                        • Gross Domestic Product
                                                                                          was still down 2.5%
                                                                                          from a year ago in Q4.

                                                                                        • Kansas Gross State
                                                                                          Product was down .15%
                                                                                          in Q4 compared to a
                                                                                          year ago.

12   Donna K. Ginther, PhD     Source: Lewis, FRED, Federal Reserve Bank of St. Louis
Kansas Economy Made Up Lost Ground in Q4

                                             • Green is growth
                                             • Red is contraction
                                             • Growth:
                                                • Agriculture up 27%
                                                • Retail up 7.8%
                                                • Finance up 6.8%
                                             • Contraction:
                                                • Accommodation & Food
                                                    -19%
                                                •   Transportation &
                                                    Warehousing -17%
                                                •   State & Local -4%

13   Donna K. Ginther, PhD   Source IPSR
Employment Situation
Employment & Unemployment in March 2021

                                                • Unemployment
                                                  decreased to 6% in
                                                  March.
                                                • Kansas unemployment
                                                  fell to 3.2% in
                                                  February.

•    Economy added 916,000 new jobs in March.
     February’s numbers were revised up to
     416,000. Gains in leisure & hospitality.
•    Source: NY Times

15    Donna K. Ginther, PhD
Employment in Kansas and US
                               Compared to a Year Ago
                                                 • Kansas employment was
                                                   down 4.9% from a year
                                                   ago in February.
                                                 • US employment was down
                                                   4.5% compared to a year
                                                   ago in March.
                                                 • The economy added
                                                   916,000 jobs in February.
                                                 • Now we’re only down 8.5
                                                   million jobs compared to
                                                   March 2020.

16   Donna K. Ginther, PhD
Cumulative Initial Unemployment Claims by Industry
               Kansas Industries with Largest Cumulative Job Losses March 14, 2020 -
                                          March 20, 2021
                                                                                                                                 • Industries hardest hit
450,000                                                                                                                           include:
400,000
                                                                                                                                    • Manufacturing: 138,487
                                                                                                                       57,133
                                                                                                                                    • Accommodation & Food
350,000
                                                                                                                                      Services: 83,816
300,000                                                                                                                             • Health care & Social
250,000
                                                                                                                       138,487        Assistance: 81,053
200,000
                                                                                                                                    • Retail Trade: 57,133
                                                                                                                       27,324       • Other Services: 27,324
150,000

100,000
                                                                                                                       83,816    • These five industries account
                                                                                                                                  for 60% of people who have
 50,000                                                                                                                81,053     lost their jobs.
     -
                    r

                 ay

                   n

                   n

                    l

                   g
                 ug

                 ep

                  ct

                  ct

                 ov

                   n

                   n
                 eb

                  ar
          16 r
                  ar

                 ec
                -Ju
                Ap

                  p

                Au
                Ju

               -Ju

                Ja

               -Ja
               -O

               -O

               M
     -M

               -A

             -M

              -D
              -N
              -A

              -S

              -F
             2-
             6-

            18
            4-

            8-

           23
           27

            6-
           10

           31
           25

           19

           13
          12
          29

          21
    14

         Health Care & Social Assistance   Accommodation & Food Services   Other Services   Manufacturing   Retail Trade

   17        Donna K. Ginther, PhD                  Source: Calculations using KS and MO Department of Labor Data
Average Initial Unemployment Claims by Industry
                                                             Kansas Initial Claims by Industry
                                                       Top 10 for Weeks Ending 3/21/20 - 3/20/21                                                                                     •   Our Five Largest
                                     Pre COVID-19 Average (weeks ending 1/4/20 - 3/14/20)                COVID-19 Average (weeks ending 3/21/20 - 3/20/21)
                                                                                                                               Initial Claims
                                                                                                                                                                                         Industries by
                                                                        0                   500

                                                                                             433
                                                                                                               1,000               1,500         2,000       2,500           3,000
                                                                                                                                                                                         Employment:
                                                     MANUFACTURING

                                ACCOMMODATION AND FOOD SERVICES
                                                                             66
                                                                                                                                                                     2,575
                                                                                                                                                                                         •   Public Administration
                                                                                                                                       1,486

                                 HEALTH CARE AND SOCIAL ASSISTANCE
                                                                                 99
                                                                                                                                       1,485
                                                                                                                                                                                         •   Health Care
                                                         RETAIL TRADE
                                                                                 103
                                                                                                                       1,026                                                             •   Manufacturing
                                                EDUCATIONAL SERVICES
                                                                            17
                                                                                                                    1,019                                                                •   Retail
                                                                                            409
                                                       CONSTRUCTION

                                                                                      166
                                                                                                     654
                                                                                                                                                                                         •   Accommodation & Food
      ADMIN AND SUPPORT AND WASTE MGMT AND REMEDIATION SVCS

                   PROFESSIONAL, SCIENTIFIC, AND TECHNICAL SERVICES
                                                                             53
                                                                                                     653
                                                                                                                                                                                             Service
                                                                                                   585
                                                                            26
                                              PUBLIC ADMINISTRATION
                                                                                              488
                                                                            23
                                                       OTHER SERVICES
                                                                                            426

Source: Kansas Department of Labor, Labor Market Information Services; Unemployment Insurance Statistics Program

       18         Donna K. Ginther, PhD
Initial Claims are Trending Down
                                                     Initial Unemployment Claims in Kansas and Missouri, March 2020 - March 2021
120,000
              Total Initial Unemployment Claims: 657,067                                                                                                                                                                                                                                                                                                                                      •   Kansas continuing and
100,000
                                                                                                                                                                                                                                                                                                                                                                                                  initial unemployment
                                                                                                                                                                                                                                                                                                                                                                                                  claims remain high.
 80,000
                                                                                                                                                                                                                                                                                                                                                                                              •   There are 2,389 new
 60,000
                                                                                                                                                                                                                                                                                                                                                                                                  initial claims as of the
 40,000                                                                                                                                                                                                                                                                                                                                                                                           week ending Mar 20th.
 20,000                                                                                                                                                                                                                                                                                                                                                                                       •   State Unemployment
                                                                                                                                                                                                                                                                                                                                                                           6,936

                                                                                                                                                                                                                                                                                                                                                                                2,389
                                                                                                                                                                                                                                                                                                                                                                                                  ~3.2%.
     -
          March 7th
                      March 21st

                                                                                                                                                                                                                                      October 31st

                                                                                                                                                                                                                                                                     November 28th
                                                                                                                                                                                                                                                                                     December 12th
                                                                                                                                                                                                                                                                                                     December 26th
                                   April 4th
                                               April 18th
                                                            May 2nd
                                                                      May 16th
                                                                                 May 30th
                                                                                            June 13th
                                                                                                        June 27th
                                                                                                                    July 11th
                                                                                                                                July 25th
                                                                                                                                             August 8th
                                                                                                                                                          August 22nd
                                                                                                                                                                        September 5th
                                                                                                                                                                                        September 19th
                                                                                                                                                                                                         October 3rd
                                                                                                                                                                                                                       October 17th

                                                                                                                                                                                                                                                     November 14th

                                                                                                                                                                                                                                                                                                                     January 9th
                                                                                                                                                                                                                                                                                                                                   January 23rd
                                                                                                                                                                                                                                                                                                                                                  February 6th
                                                                                                                                                                                                                                                                                                                                                                 2/20/21

                                                                                                                                                                                                                                                                                                                                                                                    3/20/21
                                                                                                                                                                                                                                                                                                                                                                           3/6/21

                                                                                                                                            Kansas                                      Missouri

    19           Donna K. Ginther, PhD
Cumulative Unemployment Claims by County

                                                                  Top 5 Counties by Cumulative
                                                                  Initial Claims:
                                                                      •   Sedgwick 166,720
                                                                      •   Johnson 123,178
                                                                      •   Wyandotte 33,216
                                                                      •   Shawnee 45,497
                                                                      •   Douglas 32,122
                                                                  Data calculated March 21, 2020 – March
                                                                  13, 2021.
                                                                  657,067 Initial Claims Filed in One Year.

Source: IPSR calculations using Kansas Department of Labor Data
  20    Donna K. Ginther, PhD
December Kansas Unemployment Rate 3.2%

                                                                                               • Uneven impact across
                                                                                                 the state:
                                                                                                 •   Sedgwick County 6.8%
                                                                                                 •   Douglas 4.5 %
                                                                                                 •   Johnson 3.7%
                                                                                                 •   Wyandotte 6.7%
                                                                                                 •   Shawnee 4.5%
                                                                                               • Unemployment
                                                                                                 decreased compared to
                                                                                                 January.

21   Donna K. Ginther, PhD   Source: IPSR calculations using Kansas Department of Labor Data
Employment by Major City in Kansas Through
            December 2020

                           • Kansas City MSA is down
                             4.2% from a year ago.
                           • Wichita is down 7.2%.
                           • Lawrence is down 10.6%.
                           • Manhattan is down 10.8%.
                           • Topeka is down 3.6%.
Women are Paying a
   Higher Price
Year over Year Percentage Change in Labor Force Participation

                                      • Women’s Labor Force
                                        Participation recovered
                                        faster than Men’s between
                                        April and July.
                                      • When school started back
                                        in August, all of that
                                        changed.
                                      • Women’s participation
                                        rebounded strongly in
                                        March.
Relative Effect of Pandemic on Employment & Leaving
                      Labor Force
                                               • Each Bar calculates the
                                                 Female – Male
                                                 Employment Difference
                                                      •   Purple Bar—Married with
                                                          children
                                                      •   Orange Bar—Single with
                                                          children
                                                      •   Gold Bar—Married w/o
                                                          children
                                                      •   Blue Bar—Single w/o
                                                          children
                                               • Married & Single Women
                                                 with children are worse off.

25   Donna K. Ginther, PhD
                             Source: Albanesi & Kim NBER Working Paper 28505
Few Gender Differences in Initial Unemployment
                                                          Claims
                                                                                              Kansas Weekly Initial Claims Totals by Gender
                                                                                                                                                  MALE                   FEMALE                                                                                                                                                           • This is also true in Kansas
                                                                                                                                                                                                                                                                                                                                          • Women have filed slightly
                                                                                                                                                                                                                                                                                                                                            fewer initial unemployment
 25,000

 20,000
                                                                                                                                                                                                                                                                                                                                            claims than men during the
                                                                                                                                                                                                                                                                                                                                            COVID-19 pandemic.
                                                                                                                                                                                                                                                                                                                                          • In recent months, men are
 15,000

 10,000
                                                                                                                                                                                                                                                                                                                                            filing more UI claims.
                                                                                                                                                                                                                                                                                                                                          • We would need to do
                                                                                                                                                                                                                                                                                                                                            analysis of microdata to
  5,000

      0
                                                                                                                                                                                                                                                                                                                                            get labor force participation
                                                                                                                                                                                                                                                                                                                                            rates by gender for
          1/4/20

                              2/1/20

                                                                                                   5/9/20

                                                                                                                      6/6/20

                                                                                                                                         7/4/20

                                                                                                                                                              8/1/20

                                                                                                                                                                                                               10/10/20

                                                                                                                                                                                                                          10/24/20

                                                                                                                                                                                                                                               11/21/20

                                                                                                                                                                                                                                                                    12/19/20

                                                                                                                                                                                                                                                                               1/2/21
                   1/18/20

                                       2/15/20

                                                 2/29/20

                                                           3/14/20

                                                                     3/28/20

                                                                               4/11/20

                                                                                         4/25/20

                                                                                                            5/23/20

                                                                                                                               6/20/20

                                                                                                                                                   7/18/20

                                                                                                                                                                       8/15/20

                                                                                                                                                                                 8/29/20

                                                                                                                                                                                           9/12/20

                                                                                                                                                                                                     9/26/20

                                                                                                                                                                                                                                     11/7/20

                                                                                                                                                                                                                                                          12/5/20

                                                                                                                                                                                                                                                                                        1/16/21

                                                                                                                                                                                                                                                                                                  1/30/21

                                                                                                                                                                                                                                                                                                            2/13/21

                                                                                                                                                                                                                                                                                                                      2/27/21

                                                                                                                                                                                                                                                                                                                                3/13/21     Kansas.
                                                                                                                                                             Week Ending

Source: Kansas Department of Labor, Labor Market Information Services; Unemployment Insurance Statistics Program

       26                    Donna K. Ginther, PhD
However, That is a Big Change from Previous
                                            Recessions
                                   Kansas Initial Claims by Gender                                                                                   Kansas Initial Claims by Gender
                                       Pre COVID-19 Average                                                                                                COVID-19 Average
                                   Weeks Ending 1/4/20 - 3/14/20                                                                                     Weeks Ending 3/21/20 - 3/20/21

                  FEMALE, 32.0%

                                                                                                                                FEMALE, 46.6%

                                                                                                                                                                                                                MALE, 53.4%

                                                                                        MALE, 68.0%

Source: Kansas Department of Labor, Labor Market Information Services; Unemployment Insurance Statistics Program   Source: Kansas Department of Labor, Labor Market Information Services; Unemployment Insurance Statistics Program

            • Prior to COVID, women were less likely to experience unemployment. The
              Great Recession was a man-recession.
            • COVID is hitting women hard because of service sector.
      27        Donna K. Ginther, PhD
How Does
Kansas Compare?
Kansas Consumption is Increasing

                                                                                       • Kansas consumption
                                                                                         expenditures are worse
                                                                                         than Missouri and Iowa.
                                                                                           • Kansas up 5%
                                                                                           • Missouri up 16%
                                                                                           • Iowa up 4.8%
                                                                                           • US up 5.5%

                                                                                       • Starting to see evidence
                                                                                         of the Stimulus checks.

29   Donna K. Ginther, PhD   Source: Economic Tracker, https://tracktherecovery.org/
Kansas and US Household Comparison March 15th
                                                                US Census Household Pulse Survey
                                  80%
                                                                                                                                                                  • 41% of Kansas
                                  70%
                                                                                                                                                                    households faced loss in
                                  60%
                                                                                                                                                                    employment income
Percent of Adults in Households

                                  50%          47%

                                         41%                                                                           41%                                          • 35% of Kansas
                                  40%
                                                                        33% 33%                                  35%
                                                                                                                                                        33%           households with children
                                  30%                                                                                                             28%
                                                                                                                                                                      report likely or somewhat
                                  20%                                                                                                                                 likely eviction
                                                                                                                                        13%
                                  10%                   7%
                                                             10%
                                                                                             7% 6%
                                                                                                                                  10%
                                                                                                                                                                    • 10% of Kansas
                                  0%
                                                                                                                                                                      households with children
                                           Loss in
                                        Employment
                                                     Food Insecurity   Likelihood of
                                                                        Eviction or
                                                                                         Not Working due
                                                                                          to Child Care
                                                                                                                Likelihood of Food Insecurity Difficulty Paying
                                                                                                                   Eviction    (households with   for Usual
                                                                                                                                                                      are food insecure
                                          Income                        Forclosure                            (households with     children)     Household
                                                                                                                  children)                       Expenses
                                                                                Kansas     National Average

                                  30    Donna K. Ginther, PhD
31% of Kansas Small Businesses Have Closed Since 2020

                                                                                       • The number of small
                                                                                         businesses open in
                                                                                         Kansas has fallen by 31%
                                                                                         since January, 2020
                                                                                         • In the US, the number is
                                                                                           -34%
                                                                                         • Kansas is doing worse than
                                                                                           Missouri: -25.8% and Iowa:
                                                                                           -29.5%

31   Donna K. Ginther, PhD   Source: Economic Tracker, https://tracktherecovery.org/
Almost Half of Restaurants &
                                                                                 Hotels Have Closed
                                                                                  • In Kansas, 31% of small
                                                                                    businesses have closed since
                                                                                    January, 2020

                                                                                  • 48.5% of Leisure and Hospitality
                                                                                    Businesses in Kansas have
                                                                                    closed since that time.
                                                                                     • This is a huge source of jobs for
                                                                                       low skilled individuals.
                                                                                  • This is better than in the US
                                                                                    (51% have closed).

32   Donna K. Ginther, PhD   Source: Economic Tracker, https://tracktherecovery.org/
Glimmers of Hope
Is This a K-shaped Recovery? Kansas has Improved
                                                                                                                 Kansas has improved
                                                                                This is a big, positive change   compared to the US for
                                                                                from last month.                 high and middle wage
                                                                                                                 jobs.

                                                                                                                 Data from last meeting
                                                                                                                 for Kansas showed
                                                                                                                 high wage jobs were
                                                                                                                 down -7% & Middle
                                                                                                                 wage jobs were down
                                                                                                                 -12%.

                                                                                                                 Low wage jobs were
                                                                                                                 also down -21% in
                                                                                                                 Kansas from the last
                                                                                                                 meeting and are still
                                                                                                                 depressed, but not as
                                                                                                                 much as in the US

                      Source: Economic Tracker, https://tracktherecovery.org/

34   Donna K. Ginther, PhD
How Many Households will get Stimulus Checks?
                                    • Estimate 61% of Kansas
                                     households will get
                                     those payments.
                                    • In some Kansas
                                     counties (darker colors),
                                     over 75% of households
                                     will receive stimulus
                                     checks from the
                                     American Rescue Plan
                                     Act of 2021.

35   Donna K. Ginther, PhD
Distributional Impact of
         SB-50
The Wealthy Benefit More
Distribution of Individual Kansas Income Taxes
            Distribution of Taxpayers by Maximum Kansas Adjusted Gross Income, 2019
500,000                                                                                                  • In FY2019, 61% of Kansas Tax
                                                                                                           Returns had =$100,000
200,000                                                                         194,337                     •   This is the group that would
                                                   160,635                                                      benefit from itemization the most.
150,000
                                                                  117,675

100,000

 50,000                                                                                        36,518
             26,428

     -
             None     $1 -$25,000   $25,001 -     $50,001 -     $75,001 -     $100,001 - Over $250,000
                                     $50,000       $75,000      $100,000       $250,000

   37     Donna K. Ginther, PhD
Who Benefits from Itemization?
           Share of Taxpayers by KAGI Income Category and Those that Itemize 2017 & 2019
500,000
                                                                                                                                     •   SB-50 Itemizers are difference
                                                     All Returns 2019        Itemize 2017        Itemize 2019      SB-50 Itemizers       between those who Itemized in 2017
450,000                 433,014
                                                                                                                                         and Itemized in 2019.
400,000
                                                                                                                                     •   Median Taxpayer is $21,442 KAGI
                                                                                                    Top 18% of Taxpayers
350,000                                                                                                                                   •   1% of filers below the median will
                                          317,859
                                                                                                                                              benefit from itemization.
300,000

250,000
                                                                                                                                     •   Percentages are estimates of those
                                                                                                                                         within KAGI bracket who will be new
200,000                                                                                            194,337
                                                                                                                                         SB-50 itemizers.
                                                             160,635
150,000                                                                                                                                   •   Benefits flow to the top 18% of
                                                                                117,675                                                       taxpayers
100,000
                                                                                                             18%             13%     •   6.6% more taxpayers will benefit from
                                  1%                 4%                 9%                 11%
 50,000
          26,428
                                                    12,421             14,774             13,000
                                                                                                             34,808 36,518
                                                                                                                                         itemization in SB-22.
                    -             4,498                                                                                      4,780
     -
               $0       $0.01 - $25,000      $25,001 -          $50,001 -          $75,001 -         $100,001 -       $250,000 +
                                              $50,000            $75,000           $100,000           $250,000
                                                      Taxpayers by KAGI Category

    38    Donna K. Ginther, PhD
SB-50 Increases the Standard Deduction by $500
                             • This results in a tax reduction that ranges
                               between for our hypothetical taxpayers:
                                • $26.25 to $28.50
                             • This won’t cover the cost of two large pizzas

39   Donna K. Ginther, PhD
Who Benefits from Itemization?
                        Effect of Standard Deduction Plans and Itemization
$600
                                                                                                                      •   Governor’s proposed increase in the
                                                                                               $513                       standard deduction by 35%
                                                                                            Assumes
$500
                                                                                      $17,000 in Deductions               •   Tax savings ranges between $101 to
                                                                      $371
                                                                                                                              $150 per year for our hypothetical
$400
                                                                   Assumes                                                    taxpayers.
                                                             $14,500 in Deductions
                                                                                                                      •   Taxpayers would need $10,750 in
$300                                                                                                 $228                 deductions to break-even with the
                                                                 $157
                                                                                                  Assumes
                                                                                            $12,000 in Deductions
                                                                                                                          Governor’s plan.
                                                 $150         Assumes                                                     •   More deductions mean higher tax
$200                                                    $10,750 in Deductions
                                                                                                                              reductions.
                                           $29
                                                                                                                      •   But only 6.6% of mostly higher
$100
                                                                                                                          income taxpayers would benefit.

 $-
            Single    Head      Head         Married    Married    Married       Married       Married     Married
           $23,000   $28,000   $32,000       $79,000    $85,000    $95,000       $125,000      $125,000    $150,000
            0 dep     2 dep     1 dep         0 dep      1 dep      2 dep          3 dep         1 dep       1 dep

                                   SB-50     Gov 2021   Gov 2022   Itemization

      40   Donna K. Ginther, PhD
GILTI Across the Country
                                                 •   Global Intangible Low-Taxed
                                                     Income (GILTI) is taxed at the
                                                     federal level
                                                 •   Fiscal note in FY 2022 GILTI will
                                                     cost -$24.2 M
                                                 •   Large multinational corporations
                                                     are most likely to pay GILTI
                                                 •   773 corporations paid almost
                                                     91% of corporate taxes.
                                                 •   Assume 200 companies have
                                                     GILTI:
                                                      •   $121,000 tax break per
                                                          company

41   Donna K. Ginther, PhD
PPP Expense Deductions Will be Costly

         •   Kansas received $6.6 Billion in PPP loans
         •   Provision in December COVID Relief Act allowed businesses
             to deduct expenses paid for with PPP loans.
         •   This results in three tax breaks:
               •   Forgiveable loan
               •   Loans are counted as non-taxable income.
               •   Businesses can take additional deductions.
         •   Conforming will cost the state $360 million.

42   Donna K. Ginther, PhD
Thank You!

                             Danke

43   Donna K. Ginther, PhD
You can also read